A boiler punishes drift three different ways. Main steam temperature running quietly above design consumes superheater creep life that no outage ever gives back. Drum level — the single most common cause of plant trips — turns a control oscillation into a turbine trip and a thermal cycle the metal remembers. And the stack reports everything to the regulator in real time through CEMS, where an excursion isn\'t scrap, it\'s a violation. Three failure modes, three time scales, one common cure: statistical control instead of alarm-limit firefighting. iFactory\'s power plant boiler connector streams steam temperature, drum level, and emissions into live AI SPC — SCADA-aware charts that know startup from steady state, cross-unit comparison that ends the "Unit 2 just runs hotter" folklore, and a compliance audit pack that builds itself.
iFactory Power Plant Boiler Connector
Steam Temp, Drum Level, and Emissions — One Live SPC Engine
Boiler-critical signals charted statistically, not just alarmed: temperature drift caught before it eats creep life, drum-level instability flagged before it trips the unit, and stack Cpk proven to the auditor on demand.
#1
cause of plant trips: drum level
Creep life
what sustained over-temperature spends
5 gases
NOx · SO2 · CO · CO2 · PM via CEMS, live
Auto
compliance audit pack per period
Three Signals, Three Different Ways to Pay
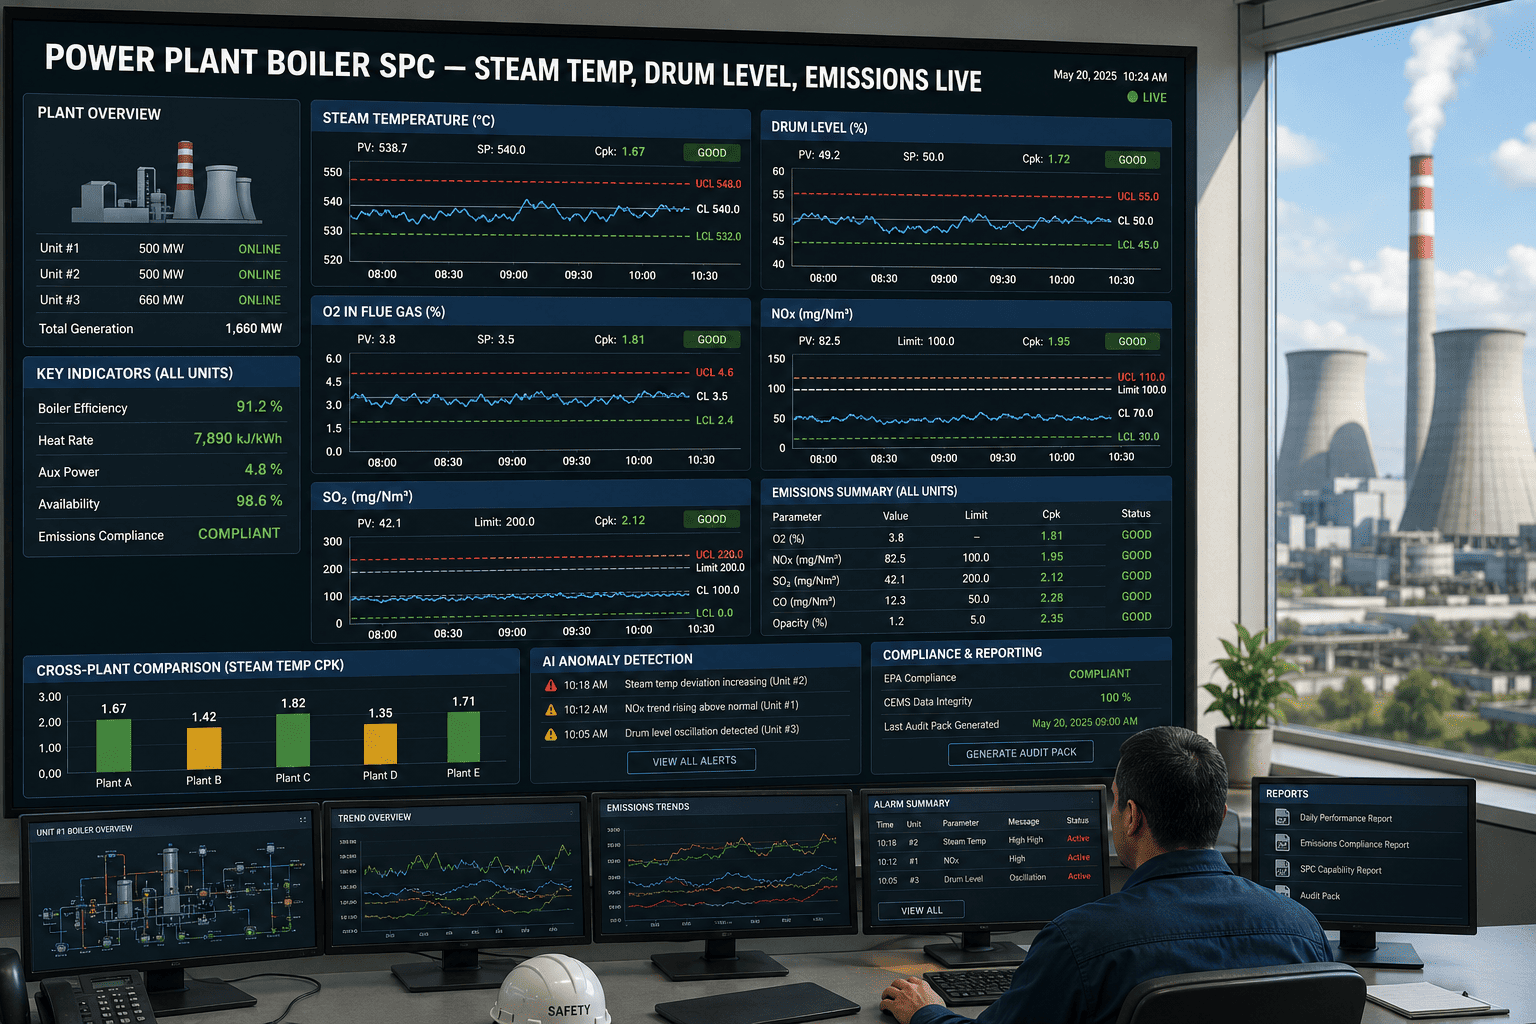
Each parameter bills the plant on its own schedule — metallurgy over years, trips in seconds, the regulator monthly. The panel below is the connector\'s view: every signal carries its target band, live variation, and statistical state, not just an alarm threshold.
Main Steam Temperature
In control · drift watch
540.8°C
Target 540°C · band ±5°C · sigma 1.4°C
Sustained running above design consumes superheater and reheater creep life invisibly — the SPC trend shows mean drift in tenths of a degree, days before any alarm and years before the tube failure it would have caused.
Drum Level
Variability rising
+12 mm
Setpoint 0 · trip limits high/low · sigma up 38% this week
The most common trip in the plant starts as growing oscillation long before a limit is touched. Variance trending flags the unstable loop — feedwater valve, pump switching, shrink-and-swell — while it\'s a tuning job, not a turbine trip.
Stack NOx
Cpk 1.52 vs permit
96 mg/Nm3
Permit limit per CEMS · margin trended per load band
Emissions get capability indices like any other characteristic — Cpk against the permit limit, per load band and fuel, so compliance margin is a managed number instead of a monthly surprise.
Why SCADA Alarms Aren\'t SPC — and Why the Charts Must Be SCADA-Aware
The DCS alarms when a limit is crossed; statistics complain when behavior changes. But naive control charts fail in a power plant, because startups, load ramps, and soot blowing all look like violations to a chart that doesn\'t know the unit\'s state. The connector\'s charts do.
State-Aware Charting
Charts read unit state from SCADA — startup, ramp, steady, soot blow — and apply the right baseline per state, so transients inform instead of false-alarming.
Load-Band Baselines
A 60% load boiler is a different statistical animal than a 100% one — every parameter carries baselines and limits per load band, compared like for like.
Shrink-and-Swell Literate
Drum-level charting distinguishes the physics of transient swell from genuine loop instability — variance trends on the right signal, not the artifact.
Drift Before the Alarm
Run rules and AI baselines flag mean shifts and variance growth deep inside the alarm band — the intervention window the DCS can\'t give you.
How many of last quarter\'s trips announced themselves as rising variance first? Book a demo with your historian data and find out.
Cross-Unit Comparison: Folklore vs Numbers
"Unit 2 just runs hotter." Maybe — or maybe its temperature loop is detuned and its creep budget is being spent twice as fast. With every unit\'s parameters on one statistical basis, the comparison stops being folklore and starts being a work list.
| Parameter · last 30 days | Unit 1 | Unit 2 | Unit 3 | Reading |
|---|
| Steam temp sigma (steady state) | 1.3°C | 2.9°C | 1.4°C | Unit 2 temperature loop needs tuning attention |
| Steam temp mean vs design | +0.4°C | +3.1°C | +0.6°C | Unit 2 is quietly spending creep life |
| Drum level excursions >50% band | 2 | 3 | 11 | Unit 3 feedwater loop is the next trip waiting |
| NOx Cpk vs permit | 1.61 | 1.48 | 1.12 | Unit 3\'s compliance margin is thinning — investigate burners |
| Heat-rate-relevant O2 sigma | 0.21% | 0.24% | 0.41% | Unit 3 excess-air control costs fuel every hour |
AI Anomaly: the Pattern Before the Excursion
Beyond run rules, AI models learn each boiler\'s healthy signature per state and load — and flag the combinations rules can\'t encode: the temperature-spray-position pattern that precedes a temperature excursion, the feedwater oscillation that precedes a level event.
Per-Unit Baselines
Each boiler\'s normal is learned from its own history, per load band and fuel — anomalies are departures from this unit\'s health, not a generic model.
Multivariate Signatures
Spray flow, gas damper position, and steam temp move together when healthy — the AI alarms on the relationship breaking, not just any one signal.
Hours of Warning
Level-loop instability and attemperator misbehavior surface as anomaly scores hours before the alarm — time enough for tuning, not tripping.
Work Orders, Not Just Alerts
A confirmed anomaly raises a maintenance work order with the trends attached — the finding becomes an assigned action on the right valve.
Which unit\'s drum level loop would the variance trend convict? Talk to our power team and run last month\'s data.
The Compliance Audit Pack That Builds Itself
When the environmental auditor arrives, the question is never whether you complied — it\'s whether you can prove it, quickly, for any period they pick. The connector assembles that proof continuously from the same CEMS and process streams it charts.
Emissions vs Permit, Charted
Every CEMS channel against its permit limit with capability indices per period, load band, and fuel — margin proven, not asserted.
Excursions With Their Story
Each exceedance packaged with the process context around it — load, fuel, soot blow, equipment state — and the corrective action that closed it.
Any Period, On Demand
Quarter, permit year, or the auditor\'s arbitrary date range — the pack generates from live records in minutes, identically every time.
CEMS Health Tracked
Analyzer availability, calibrations, and data substitution windows logged alongside the data — the meta-evidence audits also ask for.
Built for the Unit Control Room, Run Inside the Plant
The connector reads DCS historians, CEMS, and SCADA state signals inbound-only, on a pre-configured on-prem edge server. It charts, compares, and alarms; operating authority stays with your operators and your DCS.
Reads What Exists
Historian tags, CEMS streams, and unit-state signals flow in as-is — no new instrumentation to start charting every boiler.
Advisory by Design
Read-only integration: trends, anomaly scores, and work orders out; no write path to controls, ever.
Fleet on One Basis
Units — and sister plants — compared on identical statistical definitions, so a fleet best practice is a number anyone can verify.
On-Prem Edge Server
Pre-configured hardware inside your firewall, no external egress — unit data stays in the plant.
What the Plant Gets Back
Statistical control over the boiler\'s three account books converts directly into trips avoided, creep budget preserved, and compliance margin you can show — not just claim.
Fewer
Drum-level trips
the plant\'s most common trip caught as rising variance, tuned instead of tripped
Preserved
Creep life
tenth-of-a-degree mean drift corrected before metallurgy pays for it
Proven
Emissions margin
stack Cpk per load band and fuel — the auditor\'s question pre-answered
Minutes
To the audit pack
any period\'s compliance evidence generated from live records on demand
What did your last unit trip cost in starts, stress, and lost megawatt-hours? Talk to our power team and price the variance trend that preceded it.
Frequently Asked Questions
What does SPC add on top of our DCS alarms?
A different question. Alarms answer "has a limit been crossed?"; SPC answers "has behavior changed?" — mean drift, variance growth, and pattern breaks that occur entirely inside the alarm band. For a boiler that\'s the difference between tuning a feedwater loop on Tuesday and explaining a turbine trip on Thursday, and between catching a 1°C steam-temp mean shift now versus a tube assessment finding the consumed creep life at the next outage.
How do the charts avoid false alarms during startups and load changes?
By being SCADA-aware. The connector reads unit state and load from your control system and applies state-specific baselines — startup, ramp, steady, soot blowing each judged against their own normal. Drum-level charting additionally accounts for shrink-and-swell physics, so transient swell during a load change isn\'t mistaken for loop instability.
Why compute Cpk on emissions?
Because the permit limit is a specification, and margin against it is exactly what capability measures. NOx or SO2 Cpk per load band and fuel turns compliance from a binary monthly outcome into a managed, trended number — a thinning margin shows up as a falling index months before it shows up as an exceedance, and the audit pack proves the history.
What does cross-unit comparison require from us?
Just the data. Units are normalized onto identical statistical definitions — same states, same load bands, same parameters — so sigma and Cpk compare honestly across boilers and even sister plants. The output is a ranked work list: which loop to tune, which unit is spending creep life, where the compliance margin is thinnest.
What does deployment involve, and where does plant data live?
A pre-configured edge server installs on-premise inside your firewall, reading DCS historians, CEMS, and state signals inbound-only with no external egress — and no write path to controls. The fastest way to evaluate fit is a demo on your own units: bring a month of historian data and your last two trip reports, and we\'ll chart what preceded them.
Chart the Drift. Tune Before the Trip. Prove the Margin.
See Your Boilers on Live AI SPC
Bring a month of historian data, your CEMS feed, and your last two trip reports. We\'ll chart steam temp drift and drum-level variance live, compare your units on one statistical basis, and generate a compliance audit pack for any period you pick — on an on-prem server inside your firewall.
3 signals
temp · level · stack
SCADA-aware
state-based charting
Cross-unit
one statistical basis
On-prem
inside your firewall