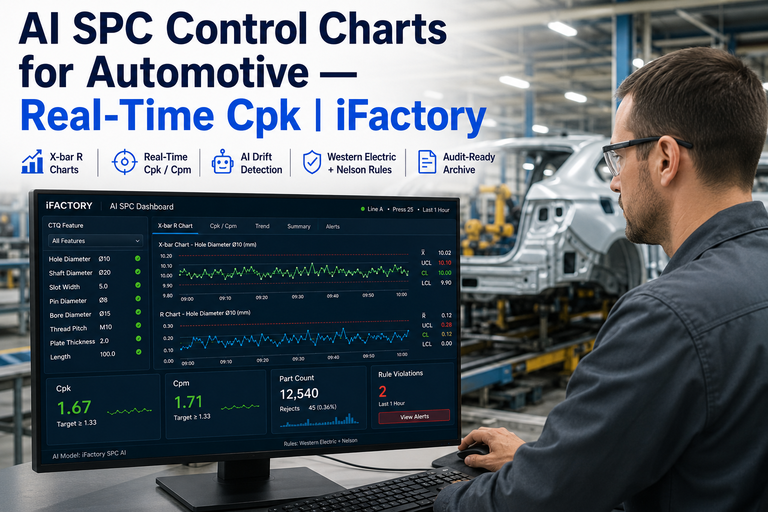
Statistical process control is one of the oldest and most proven quality tools in manufacturing, yet a surprising number of plants still run it as a paperwork exercise — control charts printed and posted on a wall, reviewed once a shift if at all, with out-of-control points caught hours after the process has already drifted and produced scrap. The math behind Xbar-R charts, P-charts, and process capability studies has not changed in decades, but the way that math gets applied on a modern production line should have, because the data needed to calculate control limits and detect violations in real time is already flowing through most plants' sensors and quality systems. The gap is not statistical knowledge, it is the operational discipline of connecting that data to a live monitoring system that alerts someone the moment a process actually goes out of control. iFactory AI's SPC module automates control chart calculation, applies Western Electric and Nelson rules in real time, and suggests likely root causes when a process shifts out of control. Book a Demo to see it running against your own process data.
Real-Time SPC Implementation — From Control Charts to Root Cause Suggestions
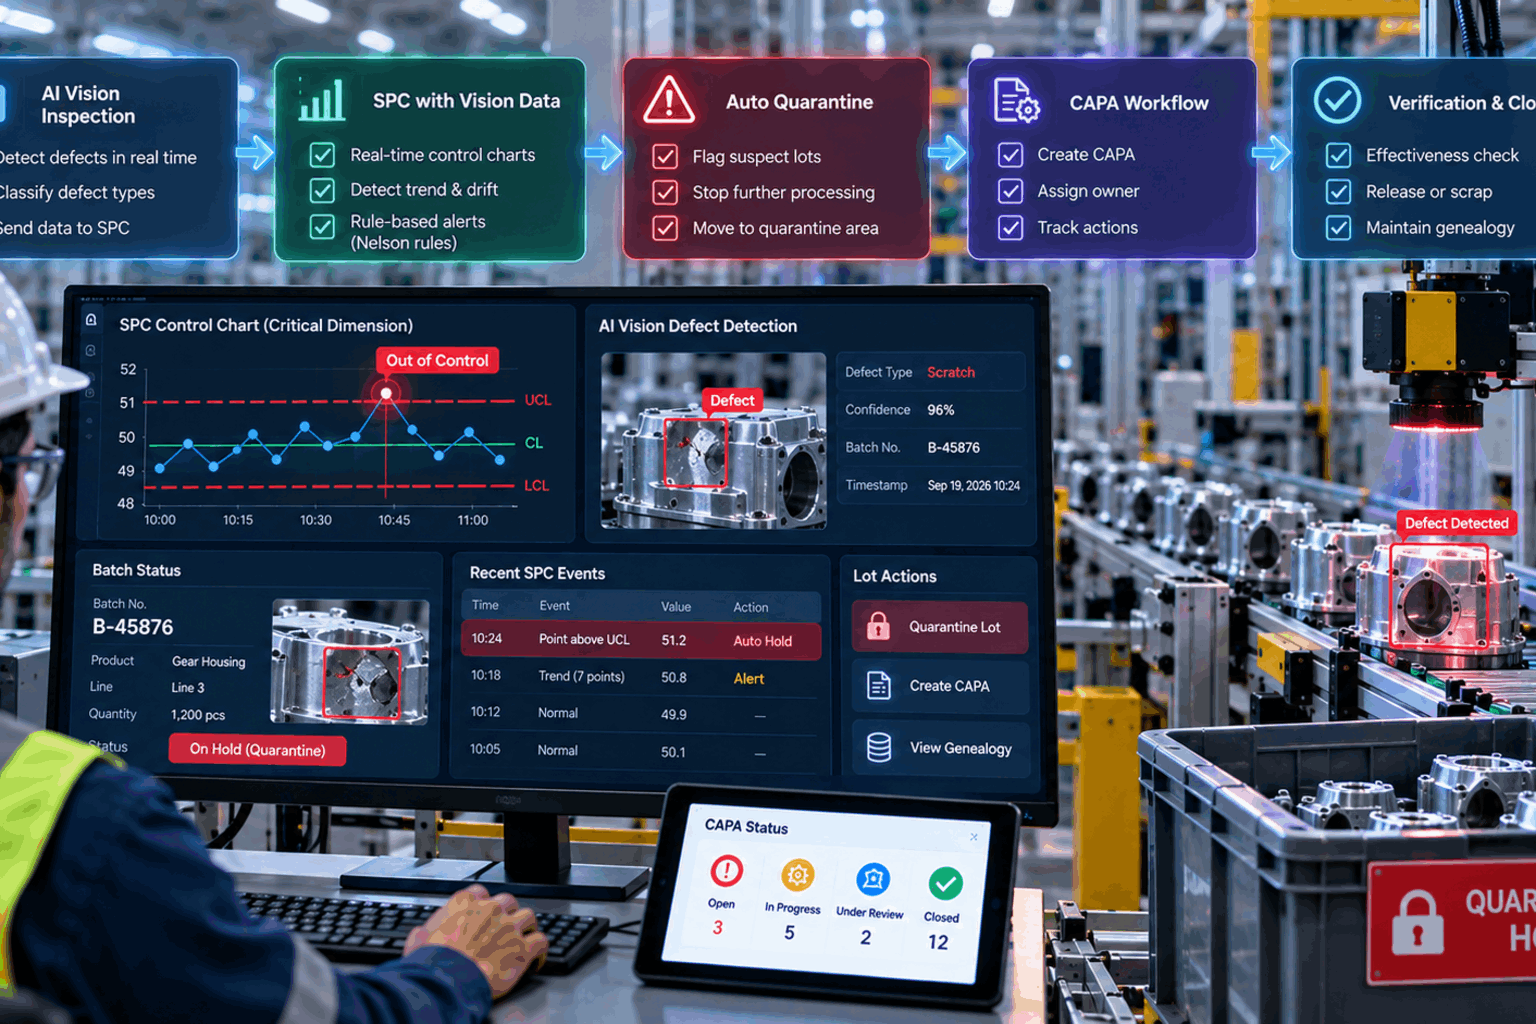
iFactory AI automates Xbar-R and P-chart calculation, applies Western Electric and Nelson rules continuously, and generates capability studies with AI-suggested root causes the moment a process drifts out of control.
Why Statistical Process Control Remains the Foundation of Manufacturing Quality
SPC works because it distinguishes between common cause variation, the normal noise every process exhibits, and special cause variation, the signal that something has actually changed and needs investigation. Plants that skip this distinction end up either ignoring real problems because they look like normal noise, or chasing normal variation as if it were a special cause, wasting engineering time adjusting a process that was never actually out of control in the first place. Applied correctly and in real time, SPC catches process drift before it produces scrap, not after a batch has already failed final inspection.
A Five-Step SPC Implementation Path
Implementing real-time SPC is not primarily a software installation exercise — it requires getting the statistical fundamentals right first, because a control chart built on the wrong sample size or an uncalibrated measurement system produces confident-looking but meaningless results.
Measurement System Analysis
Gage repeatability and reproducibility studies confirm the measurement system itself is precise enough before any control limits are calculated, since a noisy measurement system will produce false signals regardless of how well the chart is built.
Characteristic and Sample Size Selection
Critical-to-quality characteristics are identified and appropriate sample sizes and subgroup frequencies are determined, balancing statistical sensitivity against the practical cost of sampling on a live production line.
Baseline Data Collection and Control Limit Calculation
Initial process data is collected under stable operating conditions to calculate statistically valid control limits, rather than using arbitrary specification limits as a substitute for calculated process behavior.
Real-Time Chart Deployment and Rule Application
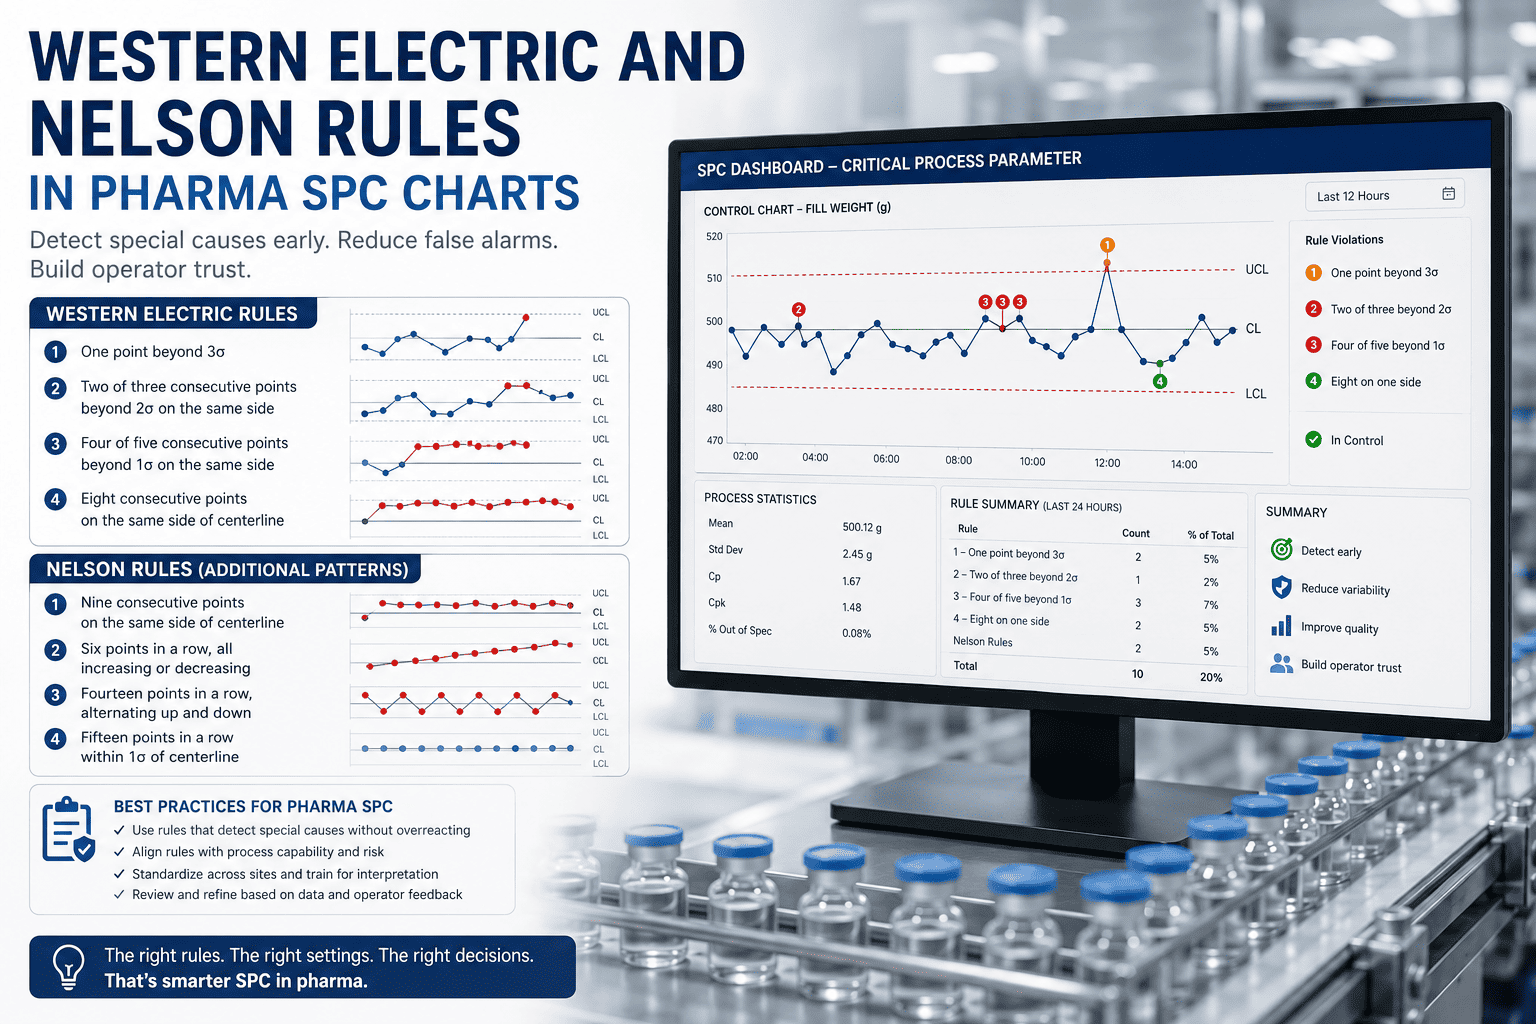
Xbar-R, P-charts, and other appropriate chart types are deployed against live process data, with Western Electric and Nelson rules applied continuously to flag out-of-control points and non-random patterns as they occur.
Operator Training and Response Protocol
Operators are trained to respond to out-of-control alerts with a defined investigation protocol, ensuring the real-time detection capability actually translates into faster corrective action on the floor.
Manual Chart Review vs. Real-Time AI-Enhanced SPC
The statistical methods are the same either way — what changes is the speed and consistency with which out-of-control signals are detected and acted on.
- Charts often reviewed once per shift, sometimes less frequently
- Rule violations detected visually, dependent on reviewer attentiveness
- Root cause investigation starts from scratch each time
- Capability studies recalculated manually on an infrequent schedule
- Control charts updated continuously as new data arrives
- Western Electric and Nelson rules applied automatically to every point
- AI suggests likely root causes based on correlated process variables
- Capability metrics recalculated continuously as new data accumulates
Out-of-Control Detection Rules Applied in Real Time
The table below summarizes the most commonly applied out-of-control detection rules, which iFactory AI evaluates continuously against live process data rather than requiring a reviewer to check for each pattern manually.
| Rule Type | Pattern Detected | What It Typically Indicates |
|---|---|---|
| Single Point Beyond Limits | One point outside 3-sigma control limits | Sudden special cause event, often equipment or material related |
| Run Rule | Multiple consecutive points on one side of centerline | Sustained process shift, often a set point or supplier change |
| Trend Rule | Consecutive points steadily increasing or decreasing | Gradual drift, commonly tool wear or gradual calibration loss |
| Stratification Rule | Points hugging the centerline unusually closely | Possible measurement system issue or mixed data sources |
| Zone Rules | Multiple points in outer control zones | Early warning of increasing process variability |
What Quality Engineers Say About Real-Time SPC
Our SPC program was technically compliant for years, meaning the charts existed and got reviewed, but by the time anyone caught a run violation it had usually been developing for most of a shift. Moving to real-time monitoring changed the conversation entirely — we now get an alert within minutes of a process starting to drift, and the suggested correlated variables have pointed our engineers toward the actual root cause faster than our old tribal-knowledge troubleshooting ever did.
Catch Process Drift the Moment It Starts, Not the Next Time Someone Checks the Chart
iFactory AI applies Western Electric and Nelson rules to your process data continuously, with automated capability studies and AI-suggested root causes when a process shifts.
SPC Implementation — Frequently Asked Questions
What is the first step in implementing SPC correctly?
The first step is a measurement system analysis, typically a gage repeatability and reproducibility study, to confirm the measurement system itself is precise enough to support meaningful control limits. Skipping this step is one of the most common SPC implementation mistakes, because a noisy or uncalibrated measurement system will generate false out-of-control signals regardless of how correctly the control chart itself is built afterward.
What is the difference between control limits and specification limits?
Control limits are calculated statistically from actual process data and represent the natural variation the process exhibits when running normally, while specification limits are set by engineering or customer requirements and represent what is acceptable for the product. A process can be perfectly in statistical control while still producing output outside specification limits, which is why capability studies comparing the two are essential alongside control charting.
How does real-time SPC differ from traditional manual chart review?
Real-time SPC applies the same underlying statistical methods as manual charting but evaluates every new data point continuously against Western Electric and Nelson rules the moment it is collected, rather than waiting for a scheduled review. This typically reduces the time between a process going out of control and someone being alerted from hours to minutes, which directly reduces the volume of scrap or rework produced before corrective action begins.
Can AI actually suggest accurate root causes for out-of-control signals?
AI root cause suggestions are generated by correlating the out-of-control signal against other process variables being monitored simultaneously, such as machine parameters, material batch, or environmental conditions, and surfacing the variables most strongly associated with the shift. This does not replace engineering judgment, but it narrows the investigation starting point significantly compared to troubleshooting from scratch. Contact Support for detail on how correlation models are built for your process.
What Cpk value should we be targeting for our critical characteristics?
A Cpk of 1.33 or higher is a commonly used minimum target for critical-to-quality characteristics in many industries, though specific requirements vary by sector, customer specification, and the consequence of a defect reaching the customer. Automotive and aerospace applications often require higher targets. Book a Demo to discuss appropriate capability targets for your specific process and industry.