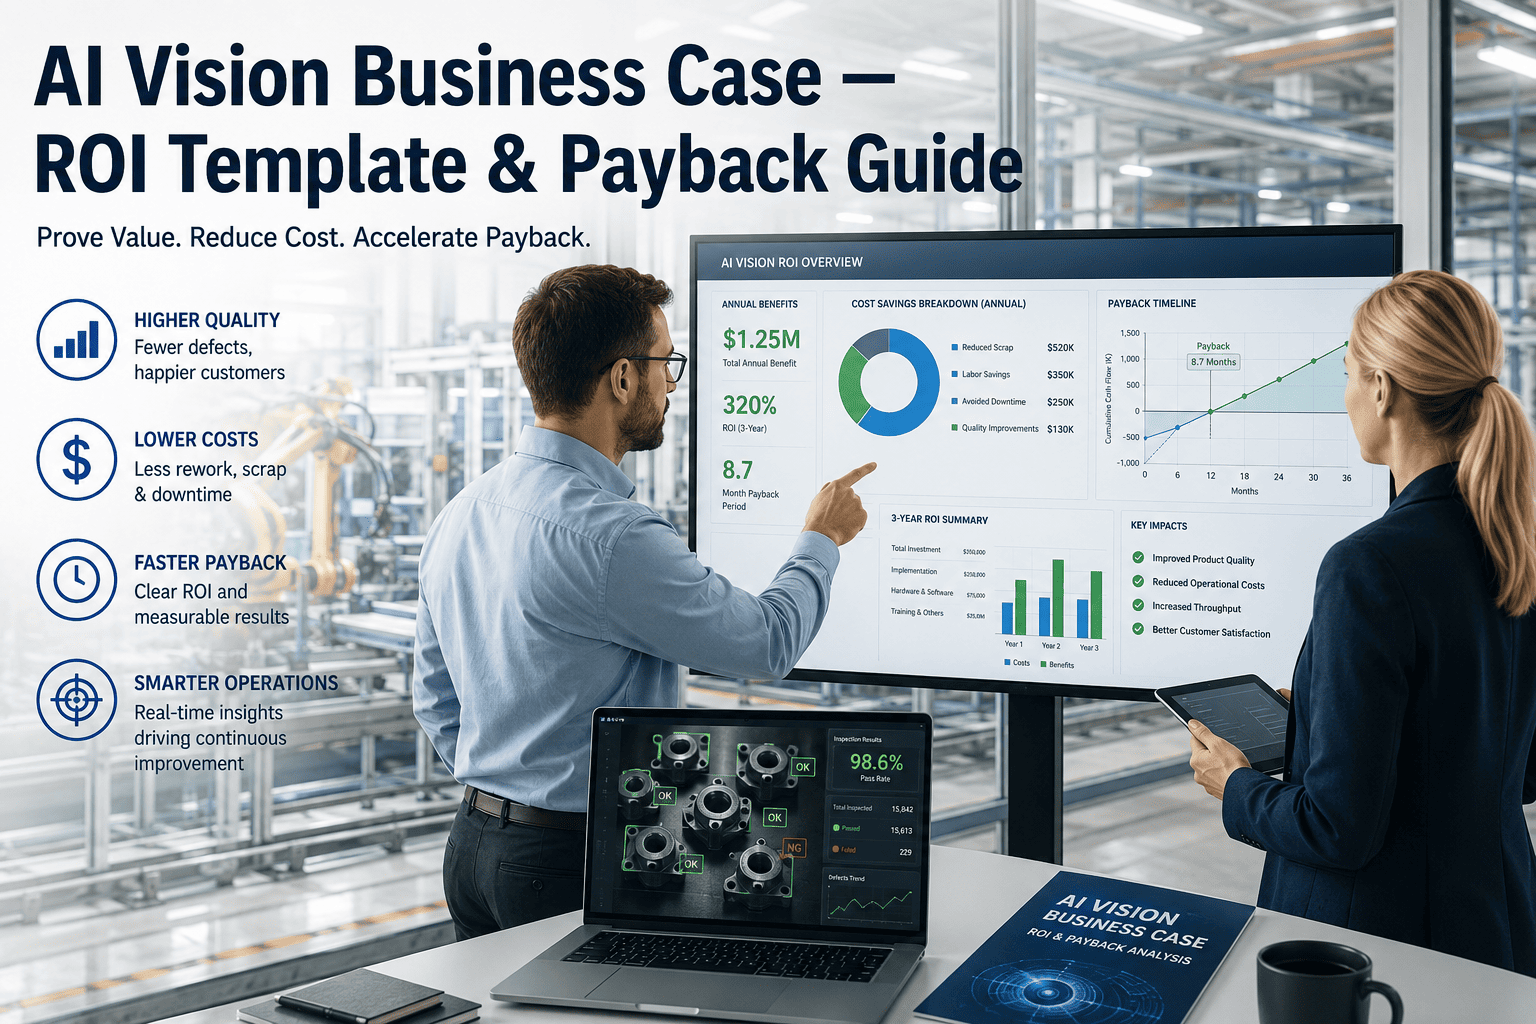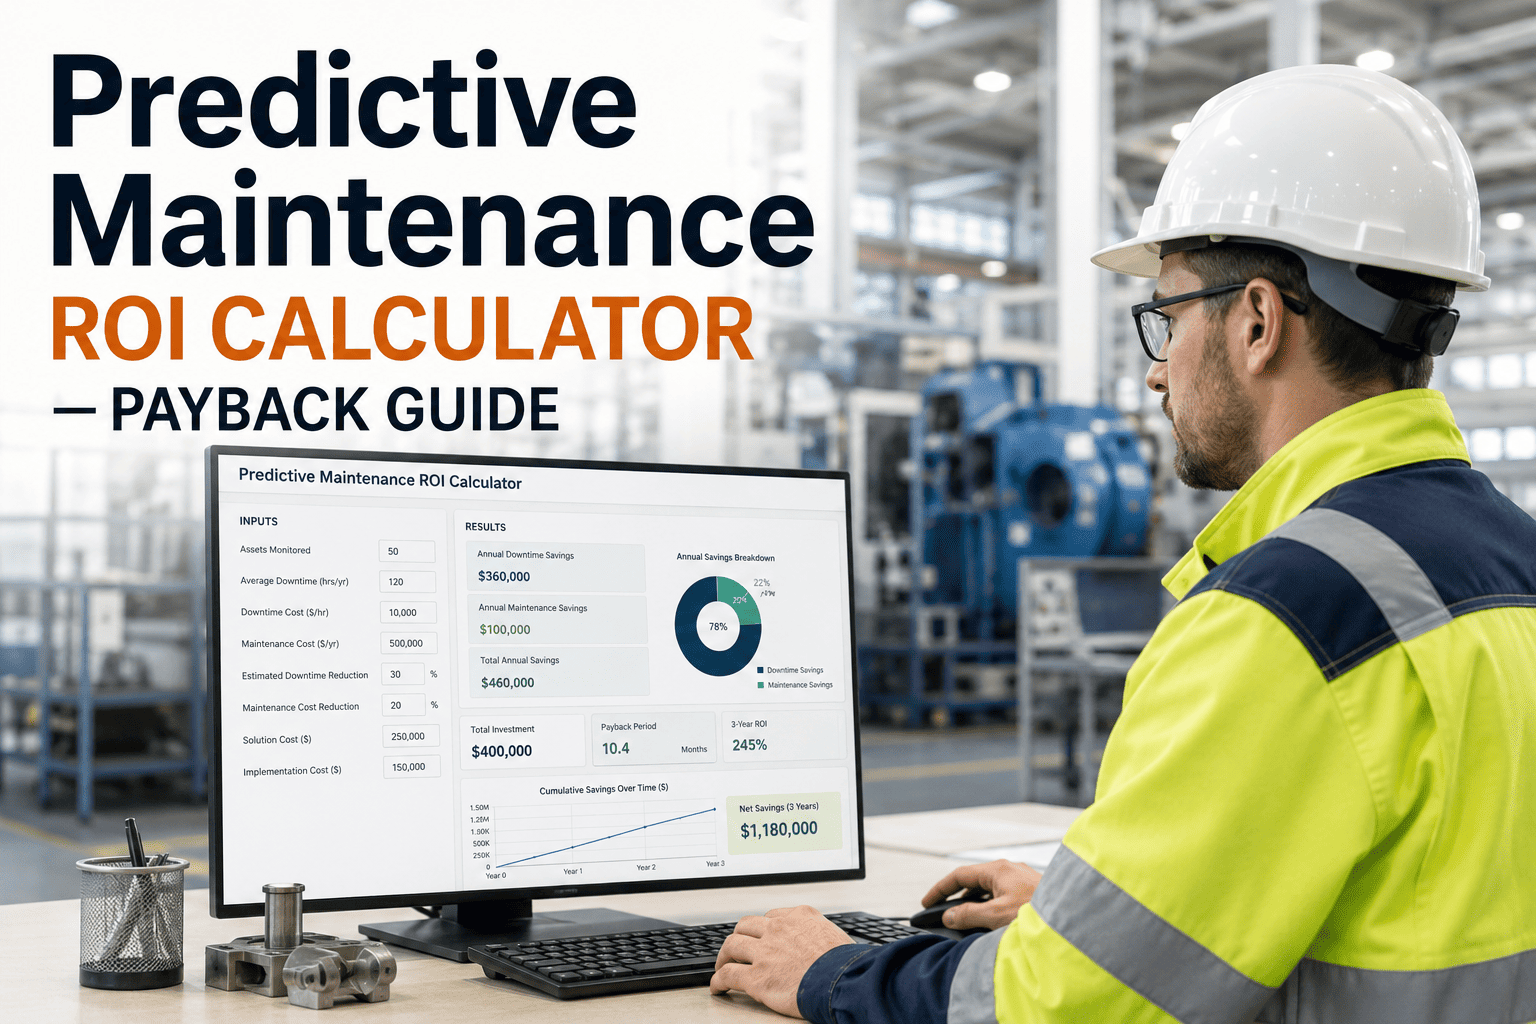
A maintenance director walked into a board meeting asking for $340,000 to fund a predictive maintenance platform, and the CFO asked one question: what do we get back, and when. Without a financial model built from the plant's own downtime history, the project sat tabled for months. That gap between "this reduces unplanned downtime" and "this returns $1.2 million a year with a 4.1-month payback" is the difference between a proposal that gets rejected and one that gets approved in the same meeting. The math behind predictive maintenance ROI is not complicated, but it only works when it is built from a plant's real numbers instead of an industry average nobody in the room fully trusts.
iFactory helps you quantify avoided downtime, labor savings, and OEE gains against your own plant's numbers.
The Formula Finance Teams Actually Use
Predictive maintenance ROI is not a soft metric, it follows the same formula finance teams already apply to every other capital decision: net savings divided by total investment, alongside a payback period expressed in months rather than years. Two inputs drive nearly all of the variance in the result, how many downtime hours a plant actually eliminates, and how accurately it has priced its own cost per hour of unplanned stoppage.
What the Numbers Actually Look Like
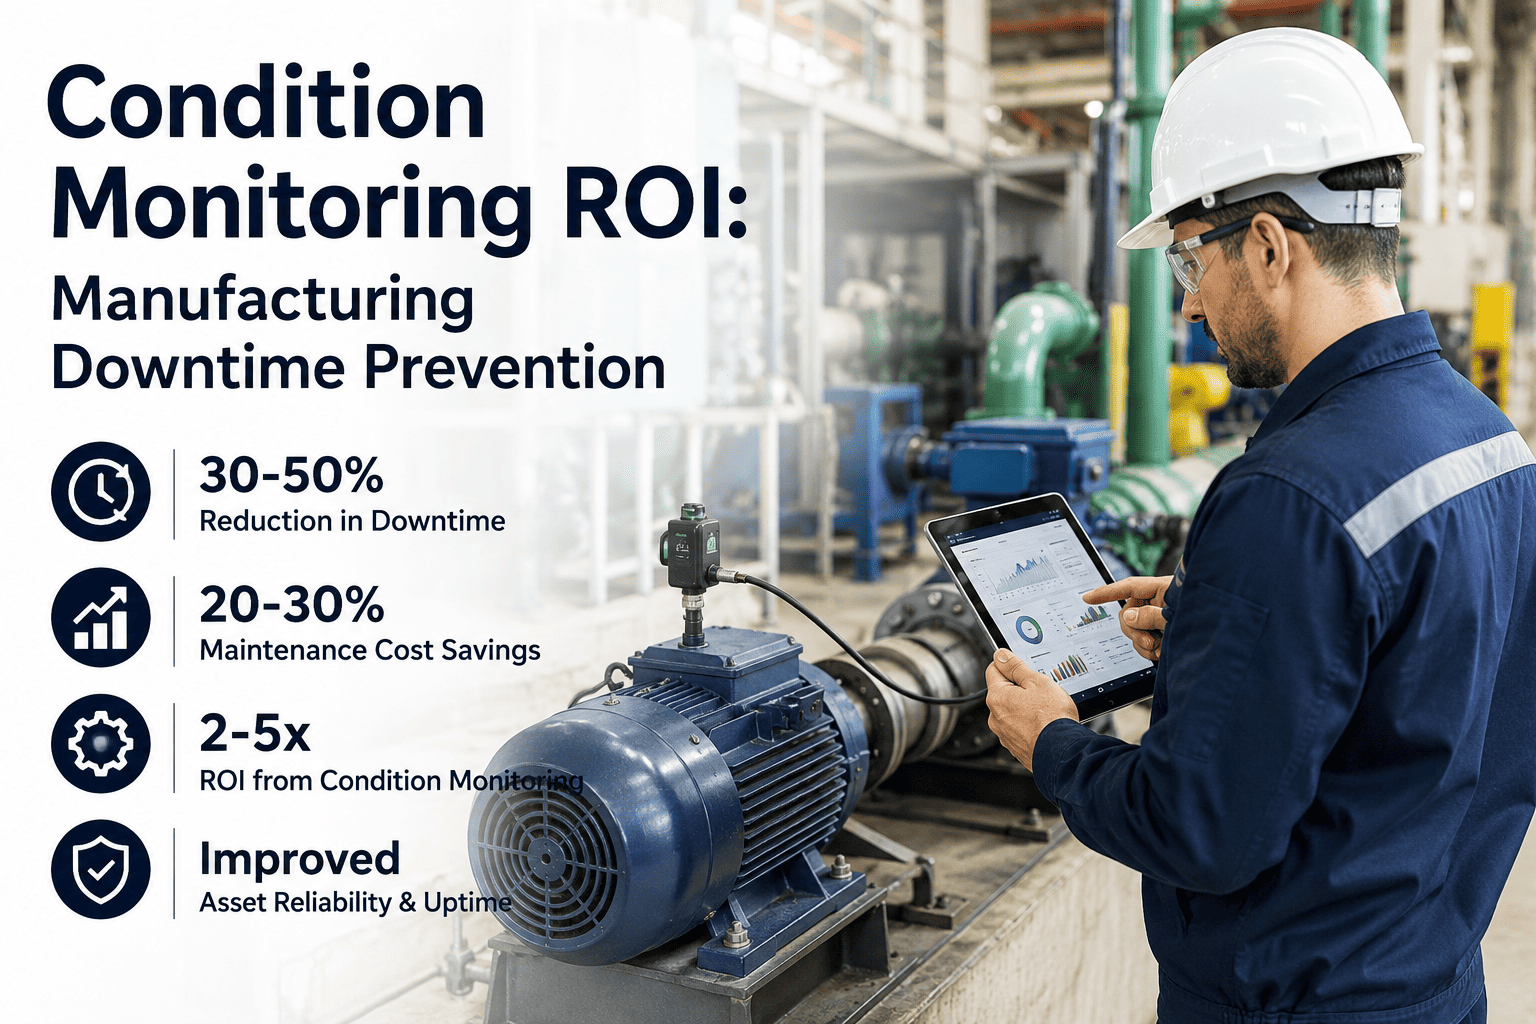
Across published industry studies and aggregated deployment outcomes, the pattern is consistent enough to plan a business case around, even before a plant has run its own pilot.
Downtime Cost Varies Sharply by Industry
The single biggest driver of how fast a plant reaches payback is the true cost of an hour of unplanned downtime, and that figure varies enormously by sector. Book a demo to calculate this against your own facility's actual downtime history.
| Industry | Downtime Cost per Hour | Typical Payback |
|---|---|---|
| Food & beverage | $5,000–$30,000 | 9–14 months |
| Pharmaceutical | $10,000–$50,000 | 6–12 months |
| Mining & minerals | $15,000–$80,000 | 4–9 months |
| Automotive assembly | $25,000–$150,000 | 3–6 months |
| Discrete manufacturing (avg.) | Up to $260,000 | Often under 6 months |
iFactory helps you price your fully loaded incident cost and model the payback finance teams will actually approve.
Building the Case Step by Step
The submissions that get approved in committee share a consistent pattern: they open with the fully loaded cost of the two or three most expensive unplanned failures the plant has already lived through, not a generic industry statistic the CFO has no reason to trust.
Price the fully loaded cost of your two or three most expensive recent unplanned failures, including lost production, labor, expedited parts, and secondary damage.
Apply a conservative 30–40% recovery factor for Year 1, since mature programs in Year 2 and beyond typically recover 60–75% once the program matures.
Calculate what a 30–50% reduction in those specific events recovers annually, and put that number directly against the platform investment.
Present payback in months, not years, since that is the unit finance teams use to evaluate every other capital request in the same meeting.
Frequently Asked Questions
What's the average payback period for a predictive maintenance program?
Most manufacturers hit breakeven within 6 to 14 months of full deployment, with roughly a quarter of programs achieving payback within 12 months. Facilities with high downtime cost per hour, above roughly $50,000, often see payback in well under six months, while lower-cost environments may take up to 18 months to fully recover the investment.
How do I calculate ROI if I don't yet have sensors installed?
Yes, and it should be calculated first. Start with your top five to ten critical assets, multiply your average downtime cost per hour by annual unplanned downtime hours to get a baseline loss figure, then apply a conservative 30 to 40% recovery factor to estimate Year 1 savings against the sensor and software investment.
Which assets should we prioritize first for the fastest payback?
The standard prioritization method weighs three criteria together: downtime cost per hour if the asset fails, how detectable its failure modes are with available sensor types, and its current failure frequency. Assets sitting at the intersection of high cost, detectable failure modes, and frequent incidents produce the fastest, clearest payback case. Book a demo to run this prioritization against your own asset list.
Why do reactive maintenance costs matter in the ROI calculation?
Studies consistently show reactive maintenance costs four to five times more per repair than planned intervention, which is why emergency-driven maintenance spend is one of the largest hidden line items in most maintenance budgets. If a plant spends $500,000 a year on maintenance, a significant share of that is typically emergency-driven overhead that predictive programs eliminate within 12 to 18 months.
Does OEE improvement factor into the ROI, or just downtime avoidance?
Both matter, and they compound. Predictive maintenance improves OEE primarily through availability, since detecting faults before they cause unplanned stops reduces unscheduled downtime hours directly. A plant running at 65% OEE that cuts unplanned downtime by 40% can typically expect to reach 70 to 75% OEE, which translates into additional output without adding shifts or new capital equipment.
Build your ROI case from your own downtime history, not an industry benchmark you'll have to defend.