Two pharma plants make the same tablet. Both pass every release test. But one finds out a blend was drifting out of spec three hours after the batch is finished — the other catches it in the seconds it is happening, and corrects it before a single bad tablet is pressed. The difference is not the people or the equipment. It is whether the plant treats quality as something you measure after the fact or something you watch in real time. That is the line between SPC and PAT — and the best plants do not choose between them. They run both. An iFactory analytics layer is where the two finally live on one screen.
iFactory · Pharma Process Control
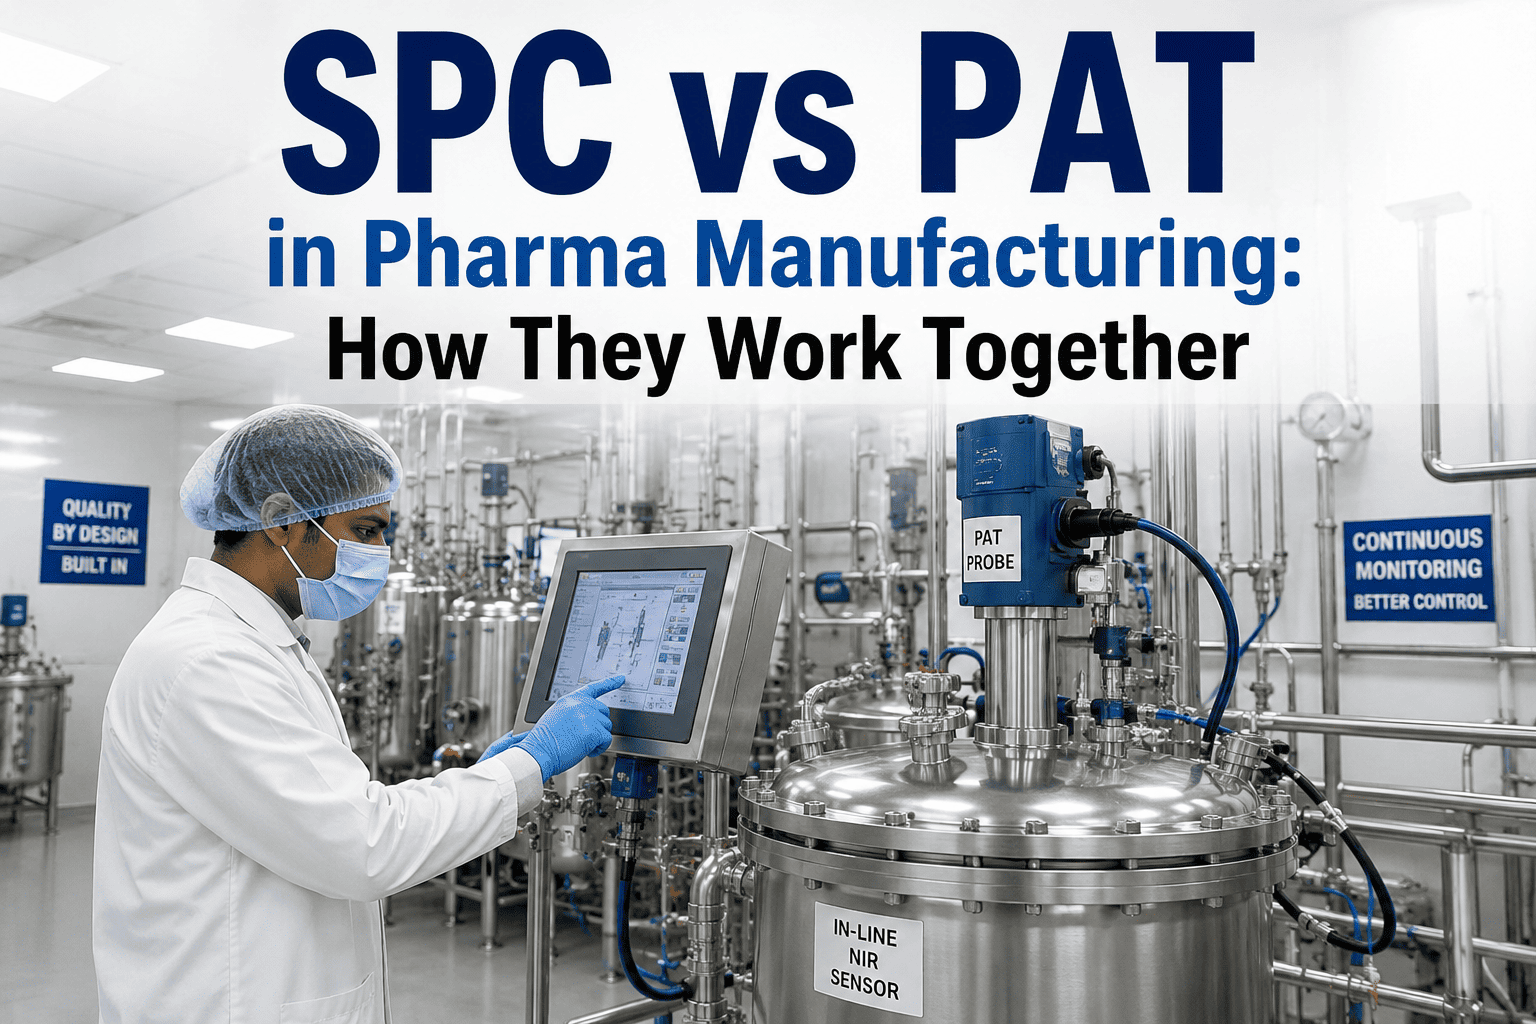
SPC vs PAT: One Looks Back, One Looks Now — You Need Both
SPC tells you what already happened to your process. PAT tells you what is happening right now. Here is how leading pharma plants stop treating them as rivals and wire them into a single real-time control strategy.
2004
FDA PAT framework published
40%
uptime gain PAT can deliver
2.1%
content uniformity RSD with PAT vs 4.8%
QbD
both feed the same goal
The One-Sentence Difference Most People Get Wrong
People treat SPC and PAT as competitors — old way versus new way, charts versus sensors. They are not competitors. They answer two different questions about the same process, at two different points in time. SPC is the rear-view mirror: it takes data the process already produced and tells you, statistically, whether the process is behaving. PAT is the windshield: it measures critical quality attributes while the material is still moving through the line, when you can still do something about it. A plant that has only SPC is driving while looking backward. A plant that has only PAT is watching the road but never reviewing where it has been. The combined plant does both at once.
SPC
Statistical Process Control
"Was my process in control?"
Looks at the past — analyzes data the batch already generated
Control charts and run charts on collected data
Detects variation, trends, and shifts statistically
Often off-line: sample, test, then chart
Answers known to QA after the lot is made
Strong at proving stability over many batches
PAT
Process Analytical Technology
"Is my process in control right now?"
Looks at the present — measures attributes during processing
In-line and on-line sensors (NIR, Raman, more)
Measures CQAs while material is still moving
Enables feedback control mid-process
Information arrives in time to act on it
Foundation for real-time release testing
Same Batch, Two Timelines
The clearest way to see the difference is to follow one tablet batch through both lenses. The blend starts drifting at the same moment in both plants. What changes is when each plant knows — and whether that knowledge arrives early enough to matter.
SPC-only plant
finds out after the fact
09:00
Blending begins. Operator follows the batch record.
09:14
Segregation starts. No one knows — nothing is being measured yet.
11:30
Batch finished. Samples pulled and sent to the lab.
14:30
Lab results charted. Content uniformity out of spec. Whole batch at risk.
Knowledge arrives 5 hours too late to save the batch.
PAT-enabled plant
catches it as it happens
09:00
Blending begins. NIR probe on the feed frame reads continuously.
09:14
Spectra shift. Multivariate model flags segregation in real time.
09:16
Feedback control adjusts the process. Drift corrected mid-run.
11:30
Batch finished in spec. Process data supports real-time release.
Knowledge arrives in 2 minutes — early enough to act.
The Honest Side-by-Side
Neither approach is "better." They are built for different jobs and play to different strengths. The table below is the comparison most teams actually want — where each one wins, and where each one leaves a gap that only the other can fill.
| Dimension |
SPC |
PAT |
| Timing of insight | Retrospective — after data exists | Real-time or near-real-time during processing |
| Core question | Is the process statistically stable? | What are the quality attributes right now? |
| Typical tools | Control charts, run charts, capability indices | NIR, Raman, spectroscopy plus chemometric models |
| Sampling | Often manual, off-line, periodic | In-line or on-line, continuous, non-destructive |
| Best at | Proving long-run stability across batches | Catching deviations before they become defects |
| Enables | Trend detection, audit-ready evidence | Feedback control, real-time release testing |
| The gap it leaves | Blind during the batch itself | Weaker at the long-horizon statistical picture |
Curious how your current control charts would look layered on top of live PAT data? Talk to a process control specialist and we will map your unit operations.
Why "vs" Is the Wrong Word
Here is the shift that changes everything: PAT does not retire SPC — it gives SPC something far more powerful to work with. Traditional SPC charts a handful of off-line measurements per batch. PAT feeds it a continuous stream of in-process data on every critical attribute. When you put statistical control logic on top of a PAT data stream, univariate charts become multivariate process control, and you are no longer waiting for the lab. The same statistical discipline runs live. This is exactly the direction regulators have pointed since the FDA's 2004 PAT framework — both approaches feed the same destination: Quality by Design, where quality is built into the process rather than tested into the product afterward.
SPC brings
The statistical discipline — control limits, trend rules, the long-run view that proves a process is stable batch after batch.
+
PAT brings
The real-time data — continuous in-process measurement of every critical attribute, dense enough to act on mid-batch.
delivers
Together they deliver
Multivariate statistical process control on a live stream — real-time deviation detection, feedback control, and the audit-ready evidence base for real-time release testing and Quality by Design.
What This Looks Like on a Tablet Line
The theory lands when you watch it run on real unit operations. Below is where each lens does its work across a typical solid-dose line — and where the two together close the loop that neither closes alone.
Blending
PAT: NIR probe tracks blend uniformity live
SPC: charts uniformity RSD across every batch
Granulation
PAT: NIR and particle sizers read moisture and PSD
SPC: trends granule attributes for process drift
Compression
PAT: feed-frame probe checks content uniformity
SPC: control charts hardness and weight variation
Coating
PAT: Raman measures coating thickness in-line
SPC: capability indices confirm long-run control
Want to see your real-time PAT feeds and your control charts on one dashboard? Book a demo and we will walk through the integration path.
Frequently Asked Questions
Does PAT replace SPC?
No. They work at different points in time and on different jobs. PAT measures quality attributes during processing so you can act in the moment; SPC applies statistical logic to detect variation and prove long-run stability. The strongest control strategies run statistical control on top of the live PAT data stream — that is multivariate SPC, and it needs both.
Does PAT always mean real-time measurement?
Not strictly. The FDA's definition uses the word "timely," meaning the measurement arrives while it can still influence the process. In-line and on-line measurements are real-time; at-line measurements happen near the line shortly after. What matters is that the information comes early enough to act, not the exact millisecond it arrives.
What tools are actually used for PAT?
Spectroscopy dominates — near-infrared (NIR) is the most common, with Raman widely used for things like coating thickness and content uniformity. These sensors are non-destructive and feed chemometric models (PCA, PLS) that translate raw spectra into the quality attributes you care about, such as blend uniformity, moisture, and API content.
How do SPC and PAT connect to Quality by Design?
QbD is the principle that quality should be designed into the process rather than tested into the product. Both tools serve it: PAT builds the real-time process understanding and control, and SPC provides the statistical evidence that the process stays within its design space. Together they make real-time release testing defensible to regulators.
Where do most plants start if they have SPC but no PAT?
Usually one high-value unit operation — blending or compression — where in-line NIR pays back fastest by catching uniformity problems mid-batch. The existing SPC framework stays; PAT just feeds it richer, denser data. The integration layer that puts both on one screen is what turns the pilot into a plant-wide control strategy.
Stop choosing between looking back and looking now.
See SPC and PAT Running on One Screen
Bring one unit operation — your blender, your tablet press, your coater. We will show how iFactory pulls your live PAT feeds and your control charts into a single real-time view, flags deviations as they happen, and builds the evidence base your QbD and real-time release strategy needs. Turnkey: pre-configured analytics, integrated to your line, live in weeks not quarters.
2 min
to flag a drift, not 5 hours
RTRT
evidence base, built in
Weeks
to live, fully integrated