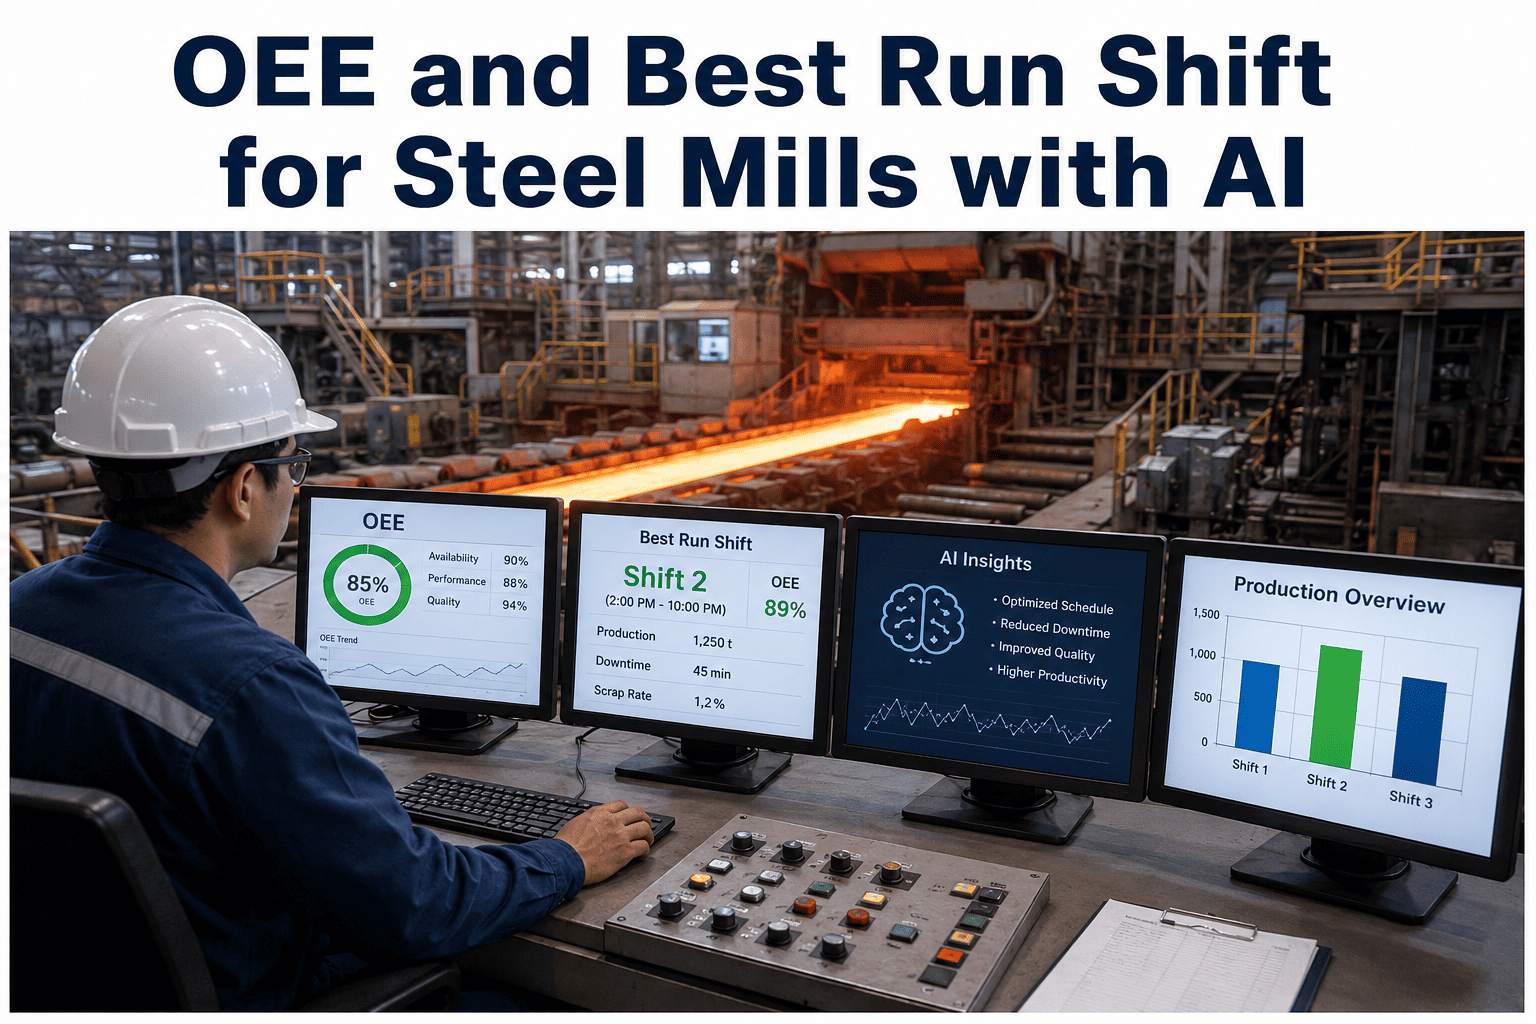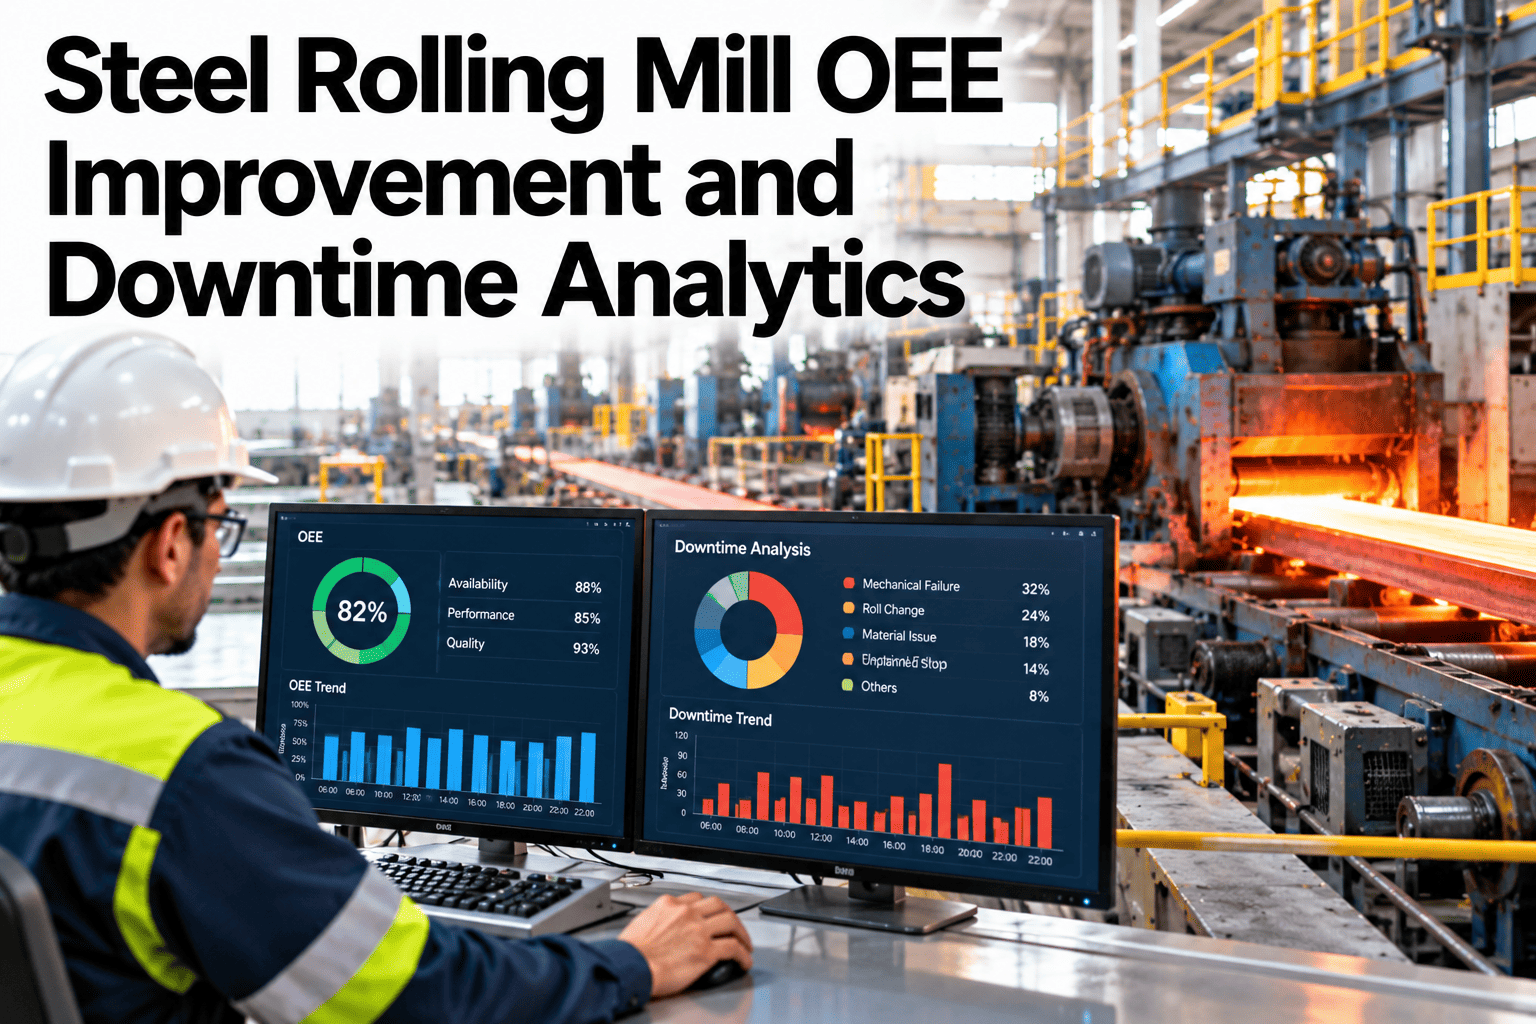
A rolling mill's OEE number often hides more than it reveals. Availability, performance and quality each blend dozens of small losses, roll changes, threading delays, speed restrictions, coil defects, into one tidy percentage that tells leadership very little about what to fix first. Breaking OEE back apart into its real components, and ranking the losses inside each one, is what turns a mill's efficiency score into an actual improvement plan. Mill operations and reliability leaders can break down a mill's OEE into ranked loss categories on iFactory AI to see where the next improvement project should start.
One OEE Number Hides a Dozen Different Losses
iFactory AI splits mill OEE into availability, performance and quality losses, then ranks what's actually costing the most tonnage.
Where Mill Losses Actually Hide
Roll changes, threading delays, unplanned stops for mechanical or electrical faults.
Speed restrictions below the mill's rated capability, often for quality or equipment reasons.
Coil defects, gauge deviation and surface issues that trigger downgrade or scrap.
The Losses Most Reports Never Separate
| Loss Category | OEE Bucket | Typical Root Cause |
|---|---|---|
| Roll change time | Availability | Roll wear schedule, changeover procedure |
| Threading delays | Availability | Operator timing, strip handling issues |
| Speed restriction | Performance | Gauge control limits, equipment constraints |
| Coil defects | Quality | Roll condition, temperature control, tension |
| Gauge deviation | Quality | Control loop tuning, sensor calibration |
Rank Your Mill's Losses by Real Tonnage Impact
Bring a month of mill production data to a 30-minute session and see which loss category to tackle first.
Blended OEE vs Split OEE
A Composite Scenario: The Mill That Chased the Wrong Fix
Picture a mill where leadership, seeing a flat OEE trend, invests in a roll-change time reduction project because it is the most visible downtime on the daily report.
A split OEE view shows that gauge-deviation downgrades in the quality bucket are actually costing more tonnage than roll changes. The roll-change project still helps, but the gauge control investment would have moved the number further, faster.
Where iFactory AI Fits
Splits the OEE buckets
Separates availability, performance and quality losses automatically.
Ranks by tonnage impact
Orders loss categories by real production cost, not event count.
Tracks root causes
Links each loss category to its likely mechanical or process cause.
Measures the fix
Shows whether an improvement project actually moved its targeted bucket.
Expert Review
A steel mill operations consultant's perspective, reviewed for accuracy before publication: a single blended OEE number is useful for a quarterly summary and almost useless for deciding what to fix next. The mills that improve fastest are the ones that stopped debating the headline number and started ranking the loss categories underneath it. Splitting a real month of mill data usually surprises leadership about where the tonnage is actually going.
Frequently Asked Questions
Why does a single OEE percentage hide more than it shows?
OEE combines availability, performance and quality losses into one multiplied figure, so two very different mills with very different problems can show the same headline number. Without splitting the buckets apart, leadership can't tell whether the loss is downtime, speed restrictions or defects, which means the improvement project chosen is often a guess. See your own mill's OEE split into its three components in a short session.
How do speed restrictions get counted differently from downtime?
Downtime falls into the availability bucket, since the mill isn't running at all during that time. A speed restriction, where the mill runs but below its rated capability, falls into the performance bucket instead. Both cost tonnage, but they point to different root causes and different fixes. Ask for a breakdown of how your restrictions split from your downtime.
Should we rank losses by frequency or by tonnage lost?
Tonnage lost is generally the more useful ranking for deciding where to invest, since a less frequent but longer or more severe loss category can cost more production than a frequent minor one. Frequency still matters for understanding process stability, so tracking both gives a fuller picture, but investment priority should follow the tonnage. Explore a tonnage-ranked view of your own mill's losses.
Can split OEE show whether an improvement project actually worked?
Yes, because tracking the specific bucket and loss category a project targeted lets you see its effect directly, rather than hoping a change shows up in a blended overall number that many other factors also influence. This makes it much easier to justify continued investment in what's working and stop what isn't. Try a before-and-after view of a recent improvement project.
How much historical data is needed to trust a loss ranking?
Enough to smooth out normal shift-to-shift and product-mix variation, which for most mills means several weeks to a few months of production data rather than a single week's snapshot. Comparing across different product grades and campaigns specifically helps confirm whether a ranking is structural or just a temporary pattern. Join a review of how much of your own history is available to analyze.
Stop Guessing Which Loss Bucket to Fix First
iFactory AI splits and ranks mill OEE losses so the next improvement project targets the real tonnage. Book a walkthrough on your own mill data.