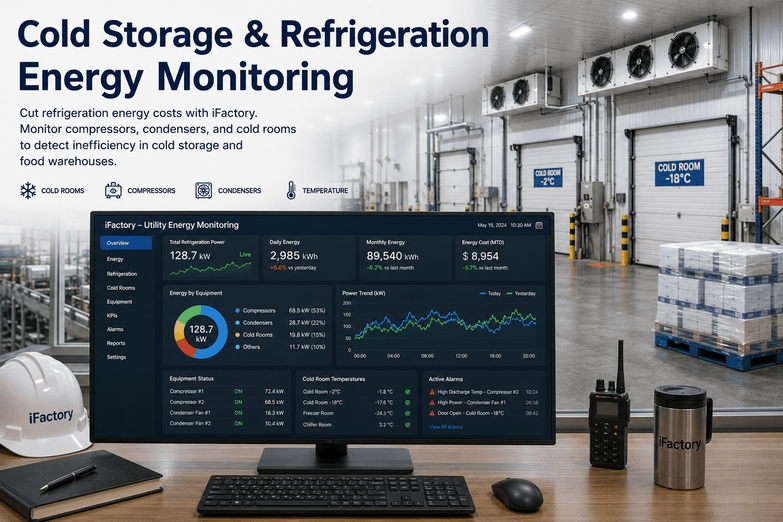
Refrigeration degradation is silent. A compressor that has quietly lost 8% of its efficiency over six months sets off no alarm. A condenser fouled enough to run 12°C above its clean setpoint still keeps the cold room cold — it just does it at 18% higher energy draw. Nothing trips, nothing looks wrong, and the product stays frozen, so the loss hides inside the utility bill for years. In a cold store where compressors run 24/7 and refrigeration consumes the bulk of a facility's 40 to 60 kWh per square foot each year, that silent drift is real money. iFactory's utility energy monitoring watches compressors, condensers, and cold rooms continuously, so inefficiency that the eye can't see becomes a number you can act on.
iFactory Utility Energy Monitoring
Make Silent Refrigeration Energy Waste Visible
Monitor compressors, condensers and cold rooms continuously to catch efficiency loss the moment it starts — cutting refrigeration energy cost across cold storage and food warehouses.
72%
of cooling load is compressors
18%
more energy from one fouled condenser
22%
energy cost cut, monitored facility
24/7
compressors always running
Where the Cold Room's Energy Actually Goes
Before you can cut refrigeration cost you have to know where it is spent. In a monitored cold storage facility, the load breaks down sharply toward the machine room — which is exactly why a small compressor or condenser inefficiency matters so much more than it looks.
72%
Compressors
The dominant load by far — and the place where a few points of lost efficiency translate into the biggest dollar swing.
14%
Evaporator fans
Continuous fan energy in the cold zones, where speed control and defrost timing offer real savings.
8%
Condensers
Smaller on the meter, but fouling here quietly forces the compressors above to work far harder.
5%
Defrost systems
Defrost cycles that run on a fixed timer rather than actual need burn energy that load-based control recovers.
The Degradation You Never See
The danger of refrigeration is that failure is gradual and invisible. Equipment keeps holding temperature while its efficiency slides, so without trending the data nobody notices until the bill or a breakdown forces the issue. These are the drifts that hide in plain sight.
Compressor COP Decay
A unit losing 8% of its coefficient of performance over months never alarms — it just draws more power for the same cooling.
Condenser Fouling
A condenser running 12°C above its clean setpoint keeps the zone cold at roughly 18% higher energy, with no obvious symptom.
Door & Seal Leaks
Failing seals and dock gaps let heat in continuously, loading the compressors without ever showing on a control screen.
Drifting Setpoints
Head and suction pressures left fixed instead of floating with conditions quietly cost compression energy all day.
Want to know what's silently degrading in your machine room? Book a demo and we'll show the trends a control screen hides.
From Sensor Signal to COP Baseline
Making degradation visible is a sequence: read the right signals, establish what good looks like, then watch for the slide. iFactory connects suction pressure, discharge pressure, and motor current, baselines each compressor, and alerts the moment efficiency drops below where it should be — long before the loss becomes significant.
1
Connect the Signals
Suction and discharge pressure and motor current per compressor stream in, the data needed to infer real efficiency.
2
Baseline Each Unit
A COP baseline is established per compressor over roughly 30 days, capturing what healthy performance looks like.
3
Trend Against Baseline
Live performance is compared to baseline continuously, surfacing the slow slide a single snapshot would miss.
4
Alert Before It Hurts
A predictive alert fires when COP falls past threshold — triggering a work order before efficiency loss becomes costly.
The KPIs That Run a Cold Store
Once the data is trended, the right metrics turn raw readings into decisions. These are the indicators that tell you whether the machine room is healthy and where the next dollar of savings is hiding.
Compressor COP
Efficiency per unit trended against baseline, so a 6% drop becomes a work order rather than a year of silent overspend.
Condenser Discharge Temp
Monitored continuously so a cleaning order fires on actual fouling — confirmed by temperature, not assumed by calendar.
kWh per Square Foot
Normalized energy intensity that benchmarks the whole facility and exposes drift as ambient conditions change.
Energy vs Ambient
Consumption tracked against outdoor temperature, separating weather-driven load from genuine inefficiency.
Curious how your compressors trend against a clean baseline? Talk to our energy team and we'll benchmark your machine room.
Turn Insight Into a Work Order
Visibility only pays when it drives action. Because monitoring connects to maintenance, a degrading compressor or a fouled condenser does not just appear on a chart — it raises the right job at the right time, so the fix happens before the energy waste compounds or the unit fails outright.
COP Alert to Service
A compressor slipping below baseline triggers a maintenance work order, catching the underperformer while the loss is still small.
Fouling to Cleaning
A condenser exceeding its discharge-temperature threshold generates a cleaning order based on real fouling, not guesswork.
Protect the Cold Chain
Catching degradation early guards temperature integrity, helping reach zero exceedance events alongside the energy savings.
Prevent the Breakdown
The same trend that flags wasted energy often flags an impending failure, turning an emergency into planned work.
On-Prem AI, Inside Your Firewall
Facility data, refrigeration recipes, and energy history are operational IP. The iFactory platform runs on a pre-configured edge server on-premise, with all processing inside your firewall and read-only links to your refrigeration controls and meters — no external egress required to operate, so your data and your machine-room detail stay in the building.
All Processing On-Site
Trending and alerting run on the in-plant edge server; nothing about your refrigeration system leaves the facility.
Read-Only Integration
Links to refrigeration controls and power meters are inbound only — no external egress, no path into controls from outside.
Works With Your Sensors
Connects the pressure, temperature, and current sensors you already have, plus meters, with no rip-and-replace.
One Unified View
Energy, equipment health, and maintenance live on one platform, so a spike and its fix sit side by side.
What Refrigeration Monitoring Delivers
Making silent degradation visible converts directly into recovered energy, protected product, and prevented breakdowns. These reflect outcomes cold storage operators report after connecting refrigeration sensor data to monitoring and maintenance.
22%
Energy cost cut
at a monitored cold storage facility through smart monitoring
$150K
Waste eliminated
annual energy waste removed at a 180,000 sq ft facility
$62K
From compressors
yearly saving from finding three underperforming units
Zero
Temp exceedances
no temperature exceedance events across 18 months
Curious how much your silent degradation is costing right now? Talk to our energy team and benchmark it against continuous monitoring.
Frequently Asked Questions
Why does refrigeration waste hide for so long?
Because the equipment keeps doing its job while its efficiency slides. A compressor can lose 8% of its COP over six months and a condenser can foul to 12°C above its clean setpoint — and the cold room stays cold the whole time, so nothing alarms. The extra energy, often 18% or more on a fouled condenser, simply disappears into the utility bill. Without sensor trending, that degradation is invisible.
Which components should we monitor first?
Start with compressors — they account for around 72% of refrigeration electricity in a typical cold store, so a few points of lost efficiency there moves the bill more than anything else. Condensers are next: at roughly 8% of the load directly, but fouling there forces the compressors to work far harder. Evaporator fans and defrost systems round out the picture and offer control-based savings.
How does COP baselining actually work?
The system connects suction pressure, discharge pressure, and motor current on each compressor and establishes a coefficient-of-performance baseline over roughly 30 days — capturing what healthy looks like for that specific unit. Live performance is then trended against that baseline, and a predictive alert fires when COP falls past a set threshold, triggering a maintenance work order before the efficiency loss becomes significant.
Does monitoring help product safety too, or just energy?
Both. The same trending that catches energy waste also protects the cold chain. Catching a degrading compressor or a fouling condenser early keeps zones reliably at temperature, which is how monitored facilities have reached zero temperature exceedance events over many months while also cutting energy cost. Energy savings and product integrity come from the same early visibility.
Do we need new equipment, and does our data leave the site?
No rip-and-replace — the platform connects the pressure, temperature, and current sensors and meters you already have. And no data leaves: it runs on a pre-configured edge server on-premise inside your firewall, with read-only links to your controls and no external egress. The fastest way to see fit is a demo on your own machine room; book a slot and bring your compressor and condenser list.
Stop Paying for Cooling You Can't See.
See Your Machine Room's Hidden Waste
Bring your compressor and condenser list. We'll show COP trending against baseline, condenser fouling caught by discharge temperature, and the work orders that turn silent degradation into action — protecting both your energy bill and your cold chain, all on an on-prem server inside your firewall.
On-prem
inside your firewall