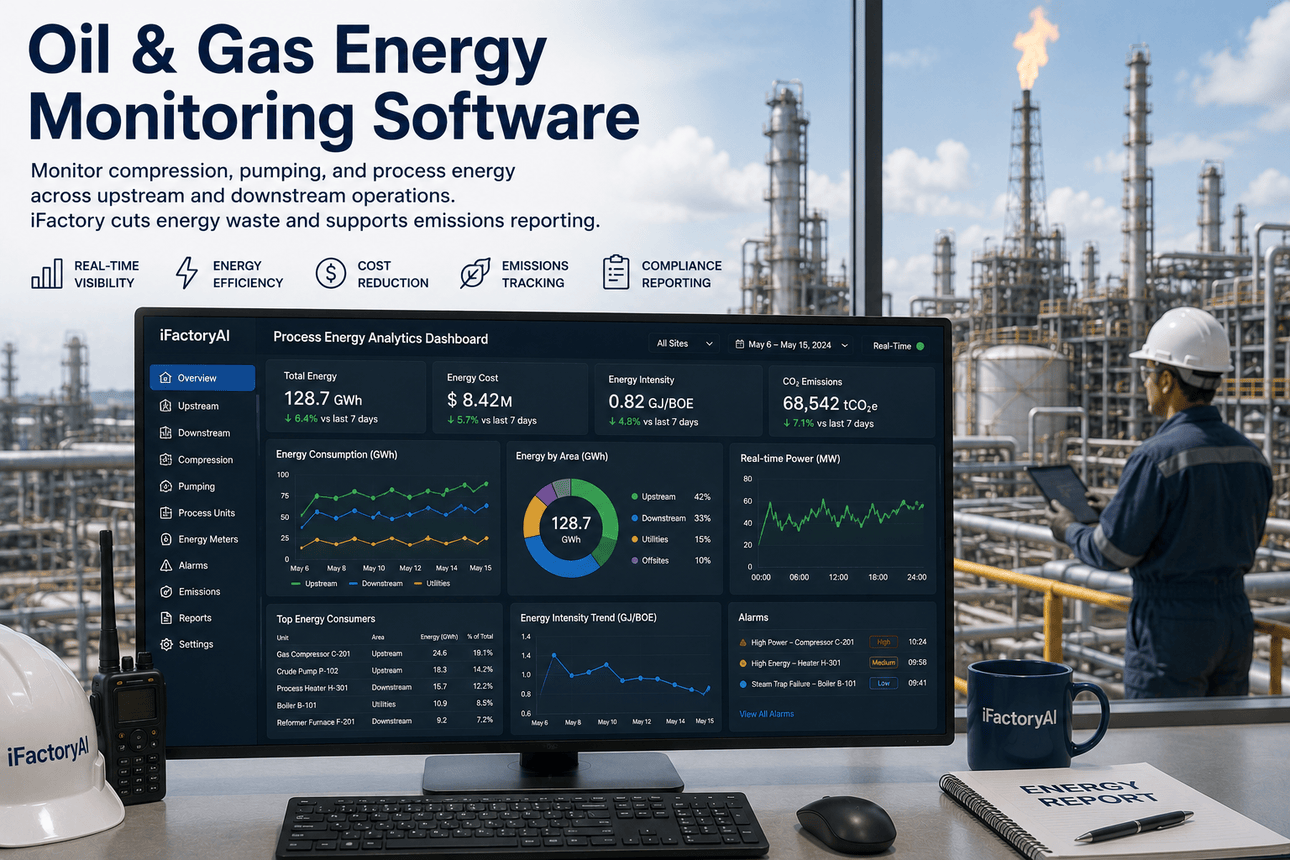
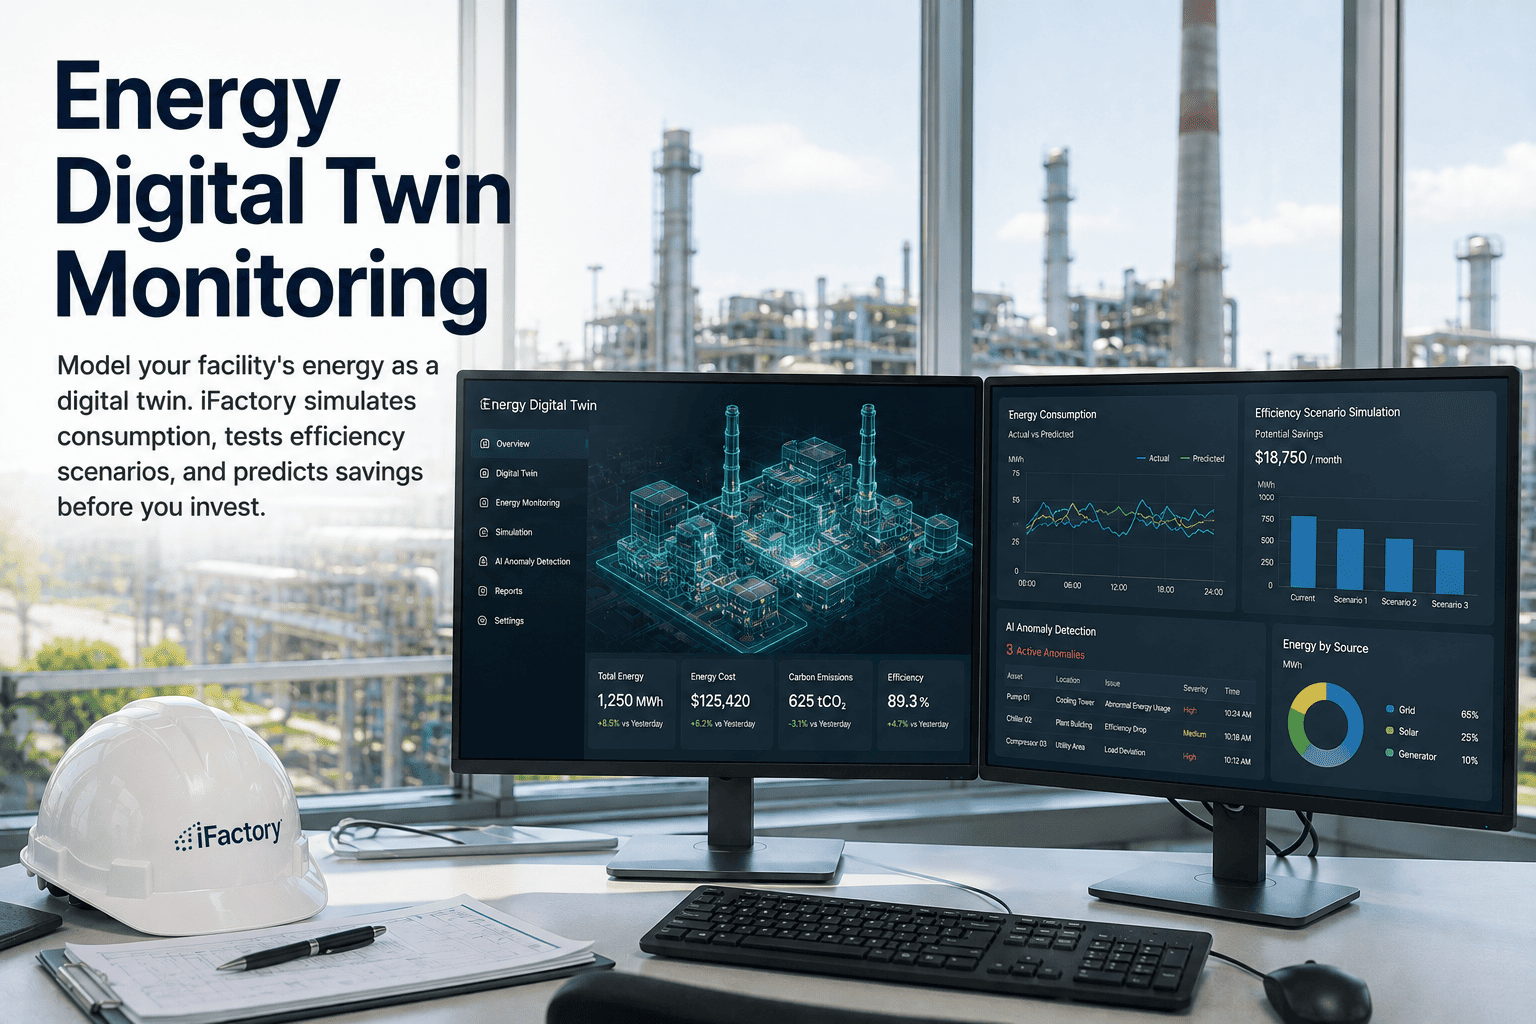
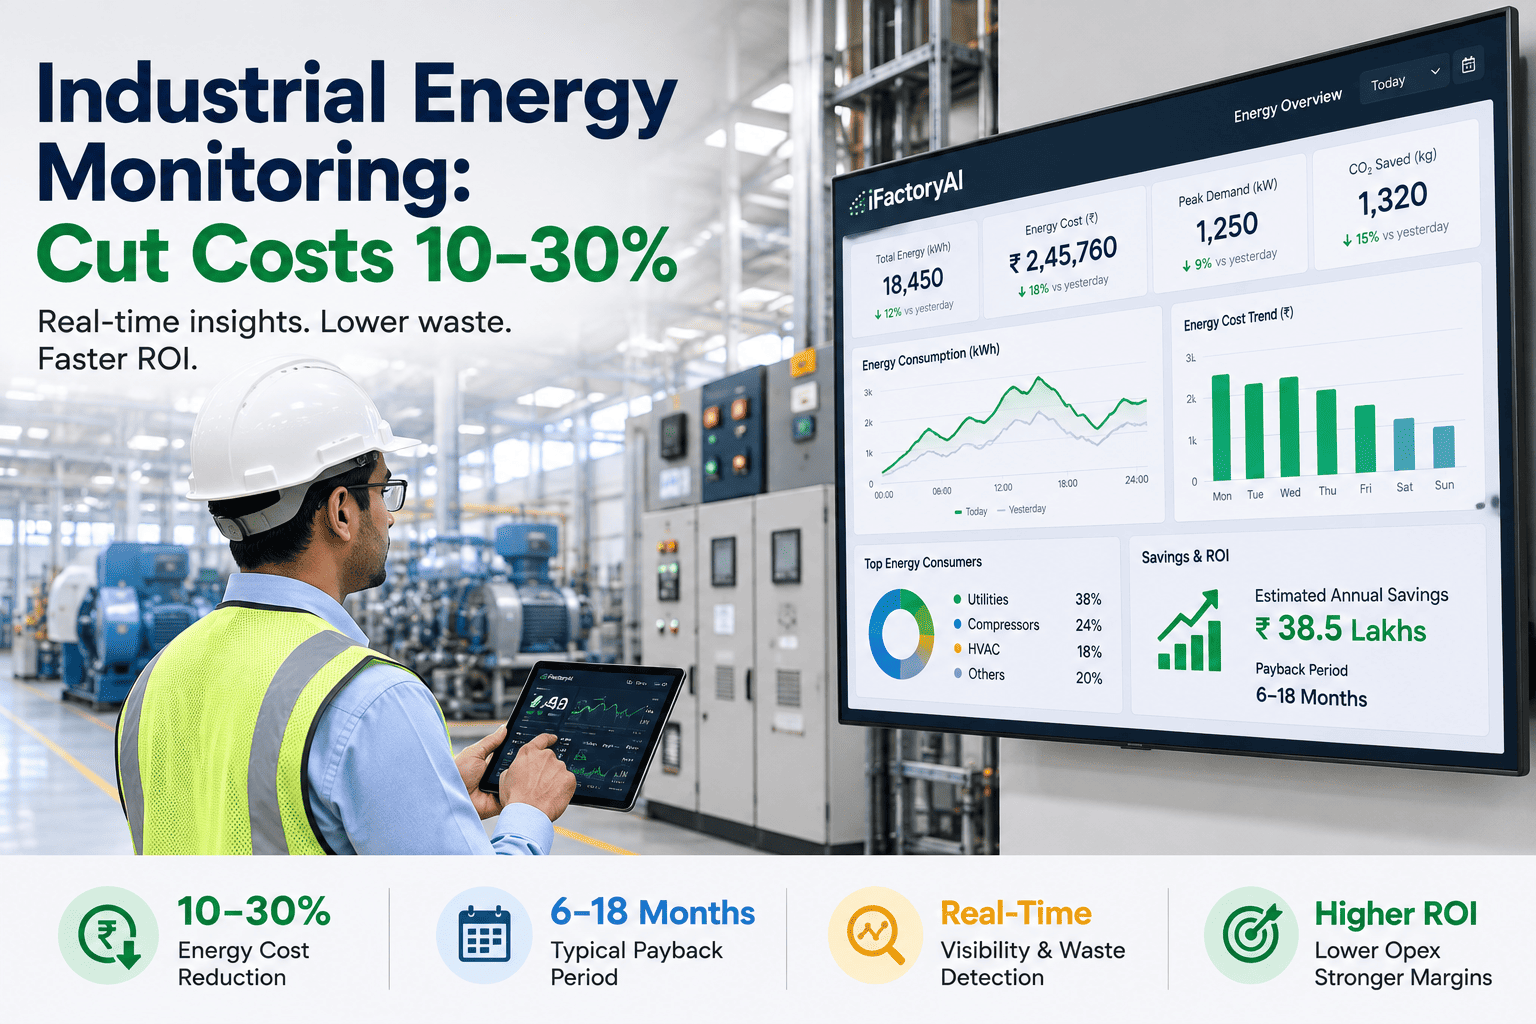
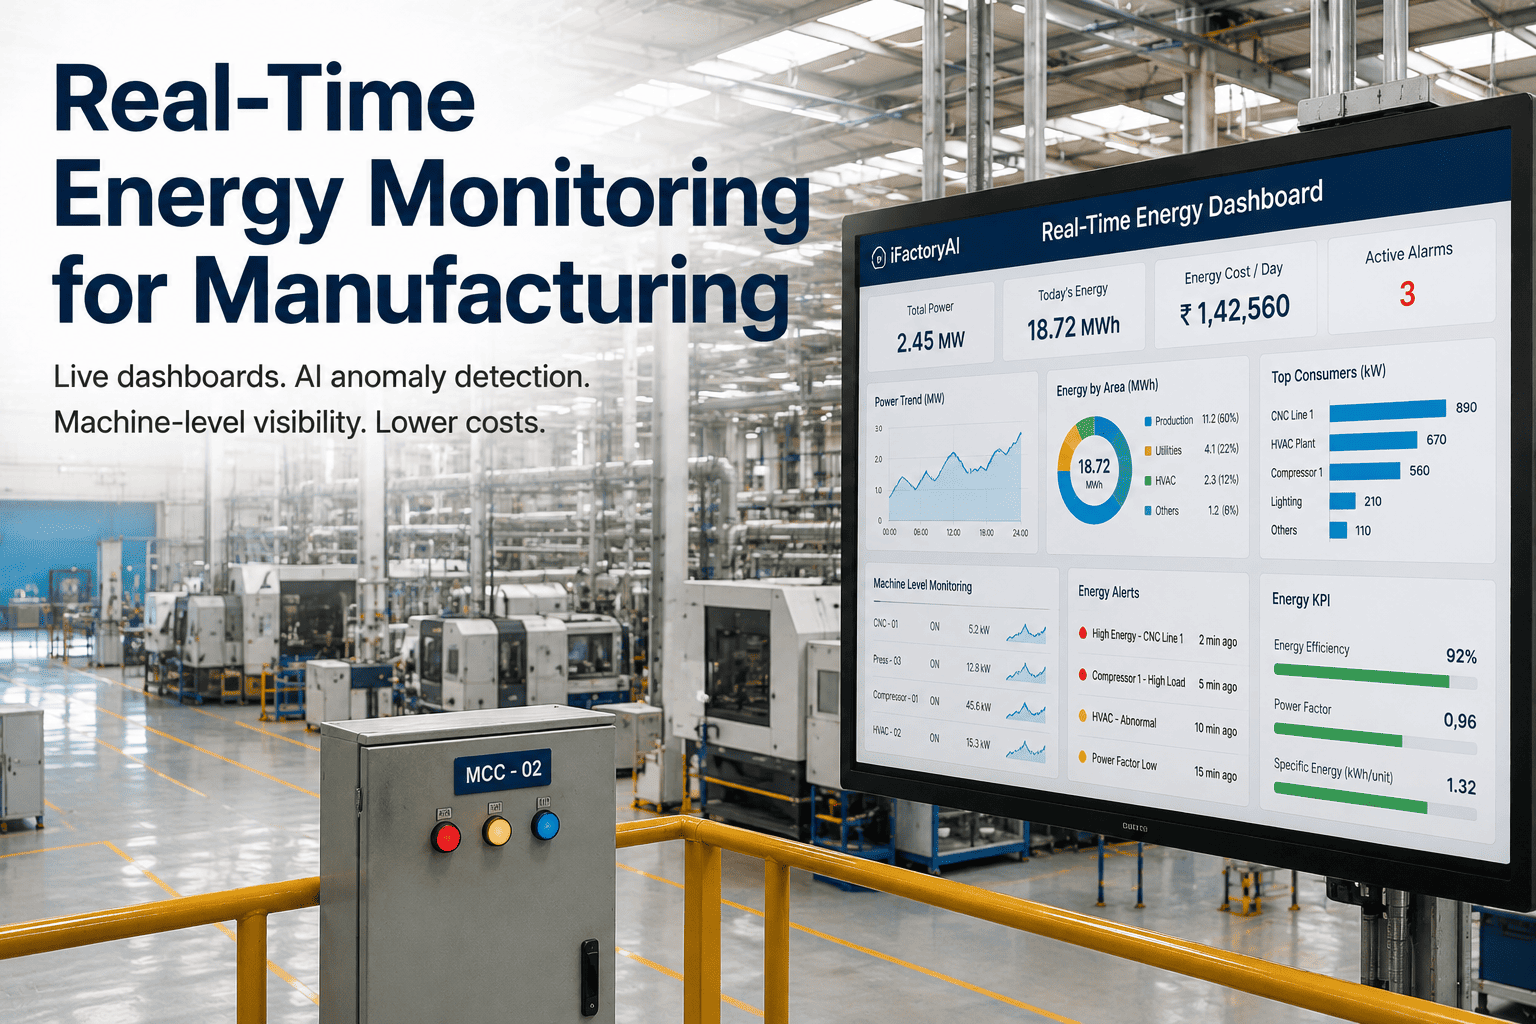
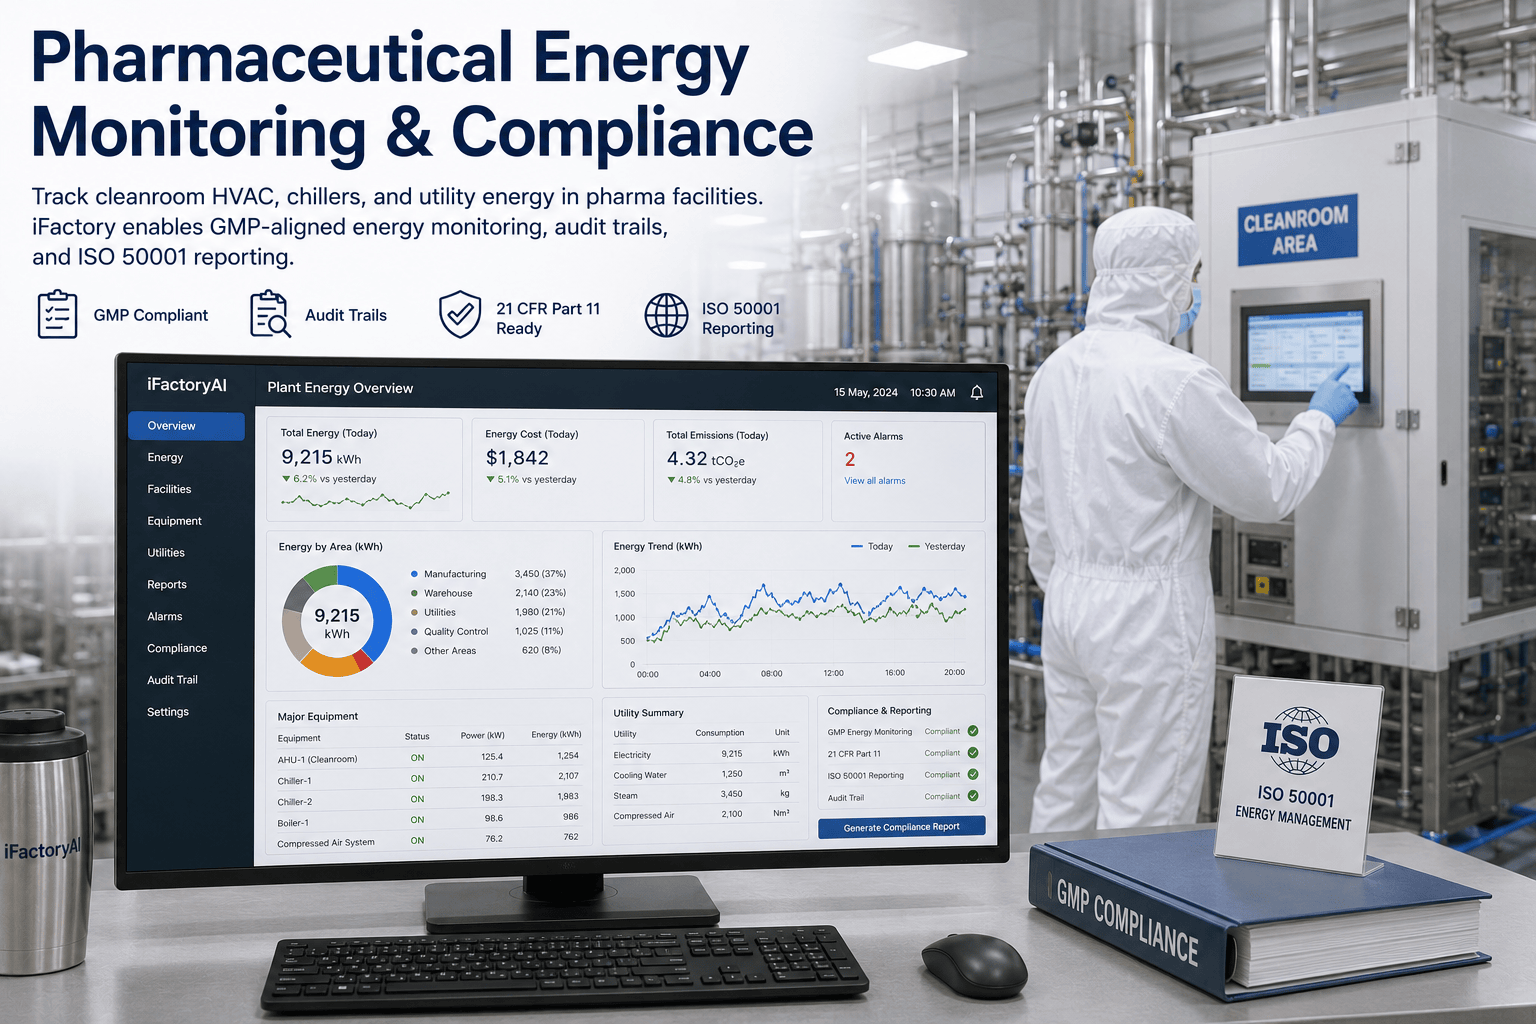
In oil and gas, the energy you burn to run the operation and the emissions you have to report are the same problem viewed from two sides. Compression and pumping are the dominant energy consumers across upstream and downstream facilities — the gas turbines, electric drives, and fired equipment that move and process hydrocarbons run on fuel that becomes both your operating cost and your Scope 1 and 2 footprint. The IEA calls improving operational efficiency one of the lowest-cost ways to cut emissions, and notes that many of these measures pay for themselves by avoiding wasted gas. iFactory's process energy analytics gives plant-wide visibility into compression, pumping, and process energy — so cutting waste and supporting emissions reporting become one workflow.
iFactory Process Energy Analytics
Energy Monitoring Across Upstream & Downstream
Monitor compression, pumping and process energy from wellhead to refinery — cut energy waste and support emissions reporting from one plant-wide platform, on-prem.
62%
of emissions digital tools can curb
140 bcm
gas flared globally each year
50%
emissions-intensity cut achievable
Scope 1&2
energy is emissions
Energy and Emissions Are the Same Bill
Every barrel and every cubic meter carries an energy cost, and in this industry that cost is paid in fuel that emits. Compression, pumping, fired heaters, and power generation consume the bulk of it — which means the fastest route to lower emissions runs straight through energy efficiency, not around it.
Compression Dominates
Gas compression is among the single largest energy consumers, so small efficiency losses scale into large fuel and emissions costs.
Pumping Runs Constantly
Water injection, lifting, and product transfer pumps draw continuous power across every facility, often with little visibility.
Fuel Becomes Footprint
The fuel gas burned to run equipment is both an operating cost and a Scope 1 emission, tying efficiency directly to reporting.
Flaring Wastes Twice
Gas sent to a flare is value combusted and emissions created — roughly 140 bcm goes up globally every year.
From Wellhead to Refinery
Energy intensity does not stop at one stage — it stacks across the whole value chain. iFactory gives a single view spanning upstream, midstream, and downstream, so the plant-wide picture is complete instead of fragmented across sites and systems.
Upstream
Drilling, artificial lift, water injection, and field compression — the energy of getting hydrocarbons out of the ground.
Compression
Gas compression trains monitored for efficiency and load, where the largest single energy savings usually hide.
Midstream
Pipeline pumping and transport energy tracked across the network, including the power behind moving product to market.
Downstream
Refinery fired heaters, process units, and gas processing — the heavy, continuous energy loads of conversion.
Want your compression and pumping fleet mapped for efficiency? Book a demo and we'll show where your energy is going across the chain.
Compression and Pumping, Watched Closely
Because rotating equipment dominates the energy bill, that is where monitoring pays first. iFactory trends the performance of compressors and pumps against their healthy baselines, surfacing the efficiency drift and developing faults that quietly raise fuel burn and emissions long before they trip an alarm.
Compressor Efficiency
Train performance trended continuously, so a slow loss of efficiency becomes visible as extra fuel and emissions, not a mystery.
Pump Energy
Injection and transfer pump consumption monitored, exposing throttling losses and oversized operation that waste power.
Predictive Health
The same trending that catches energy drift flags developing faults — the analytics that have kept critical assets running for years.
Load Optimization
Matching machine load to actual demand, with sequencing and variable-speed insight, trims the energy of running too hard.
Turn Flaring Into a Tracked Number
Flaring is the most visible waste in the industry — gas burned because it was not captured, and emissions created in the process. With roughly 70% of flared gas going to flares that run near-continuously, the path to the Zero Routine Flaring goal starts with measuring it. iFactory makes flaring a tracked metric, not an estimate.
Flaring Intensity
Track gas flared against oil produced, the standard intensity ratio, so the trend is benchmarked and visible over time.
Routine vs Upset
Separate continuous routine flaring from upset events, so reduction effort targets the near-continuous sources first.
Maintenance Link
Better maintenance and early fault detection reduce the intermittent flaring that equipment trips and failures cause.
Recovery Visibility
See the volume that flare gas recovery could capture instead of combust, turning waste into a quantified opportunity.
Curious what your flaring intensity trend looks like? Talk to our energy team and we'll help you benchmark it.
From Sensor to Emissions Report
Cutting waste and reporting emissions draw on the same data, so iFactory runs them as one flow: meter the energy, tie it to production, trend the intensity, and surface it as a report that satisfies both the operations team and the regulator. One pipeline, two outcomes.
1
Meter the Energy
Fuel gas, power, and rotating-equipment performance captured across the facility as the trustworthy basis for everything.
2
Normalize to Output
Energy tied to barrels and throughput becomes energy intensity, the metric that exposes real efficiency, not raw totals.
3
Trend & Detect
Continuous trending surfaces efficiency drift, abnormal fuel burn, and rising flaring before they become big numbers.
4
Report Emissions
Energy and flaring data roll into emissions reporting automatically — the same numbers serving compliance and savings.
One Platform, Plant-Wide Visibility
Energy analytics is strongest when it does not stand alone. Because the same platform carries asset health and maintenance, an abnormal energy signature on a compressor can raise a work order — the kind of predictive maintenance that reduces unplanned failures and the intermittent flaring they cause. Energy becomes one more lens on the whole operation.
Links to Maintenance
An abnormal energy signature can raise a work order, turning a developing compressor or pump fault into planned service.
Fewer Upsets, Less Flaring
Predictive health cuts the unplanned trips and failures that drive intermittent flaring, protecting both uptime and emissions.
Plant-Wide View
Compression, pumping, process units, and utilities on one screen, so the whole facility's energy story sits in one place.
Runs On-Prem
The platform runs on a pre-configured edge server inside your firewall, with read-only links and no external egress.
What Process Energy Analytics Delivers
Treating energy and emissions as one problem converts directly into lower fuel cost, reportable progress, and waste turned into recovered value. These reflect outcomes oil and gas operators pursue when they bring energy monitoring to compression, pumping, and process operations.
Lower
Fuel & energy cost
efficiency drift caught on the equipment that burns the most
Tracked
Flaring intensity
a measured number trending toward zero routine flaring
Report
Ready emissions
energy and flaring data rolled into Scope 1 and 2 reporting
Fewer
Unplanned upsets
predictive health cuts the trips that drive intermittent flaring
Curious how much fuel and flaring you could recover? Talk to our energy team and benchmark it against process energy analytics.
Frequently Asked Questions
Why is energy monitoring an emissions tool in oil and gas?
Because the energy you consume and the emissions you report come from the same source. Compression, pumping, fired heaters, and power generation run on fuel gas and electricity, and burning that fuel produces Scope 1 and 2 emissions. The IEA identifies improving operational efficiency as one of the lowest-cost ways to cut emissions — so monitoring energy and reducing waste directly lowers your footprint while cutting cost.
Which equipment should we monitor first?
Compression and pumping — they are the main energy consumers across oil and gas operations, so a few points of lost efficiency there move both the fuel bill and emissions more than anywhere else. iFactory trends compressor train and pump performance against healthy baselines, surfacing the efficiency drift and developing faults that quietly raise fuel burn long before they trip an alarm.
How does it help with flaring?
It turns flaring from an estimate into a tracked metric. The platform trends flaring intensity — gas flared against oil produced — and separates near-continuous routine flaring from upset events so reduction targets the right sources. Because around 70% of flared gas goes to near-continuous flares, and better maintenance reduces the intermittent flaring caused by equipment trips, monitoring supports progress toward the Zero Routine Flaring goal.
Does it cover upstream and downstream both?
Yes — it gives a single view from wellhead to refinery. Upstream drilling, lift, water injection, and field compression; midstream pipeline pumping and transport; and downstream refinery fired heaters, process units, and gas processing. Energy intensity stacks across the whole chain, so a plant-wide platform replaces the fragmented, site-by-site picture most operators work with today.
Does our operational data leave the site?
No. The platform runs on a pre-configured edge server on-premise, inside your firewall, with read-only links to your systems and no external egress required to operate — important for the sensitive, safety-critical environments oil and gas operates in. The fastest way to see fit is a demo on your own facility; book a slot and bring your compression and pumping list.
Cut the Waste. Report the Progress.
See Process Energy Analytics on Your Operation
Bring your compression and pumping list. We'll map energy across upstream and downstream, show compressor and pump efficiency trended against baseline, track flaring intensity, and demonstrate how the same data rolls into Scope 1 and 2 reporting — all on an on-prem server inside your firewall.
Compression
& pumping watched
Flaring
intensity tracked
On-prem
inside your firewall