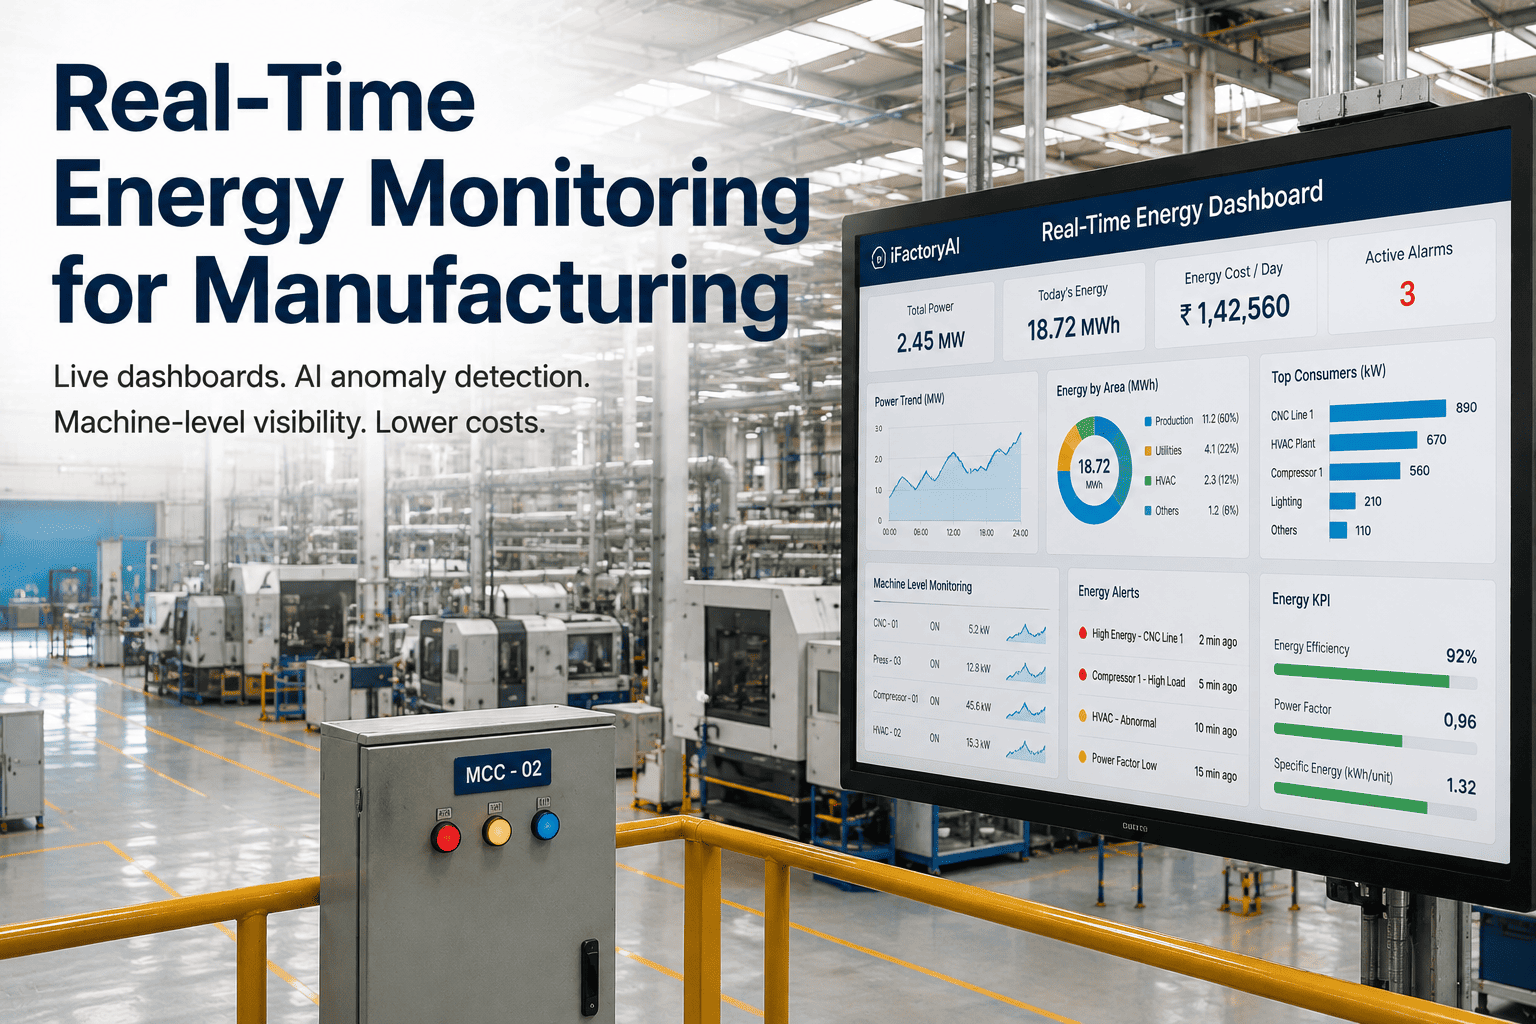
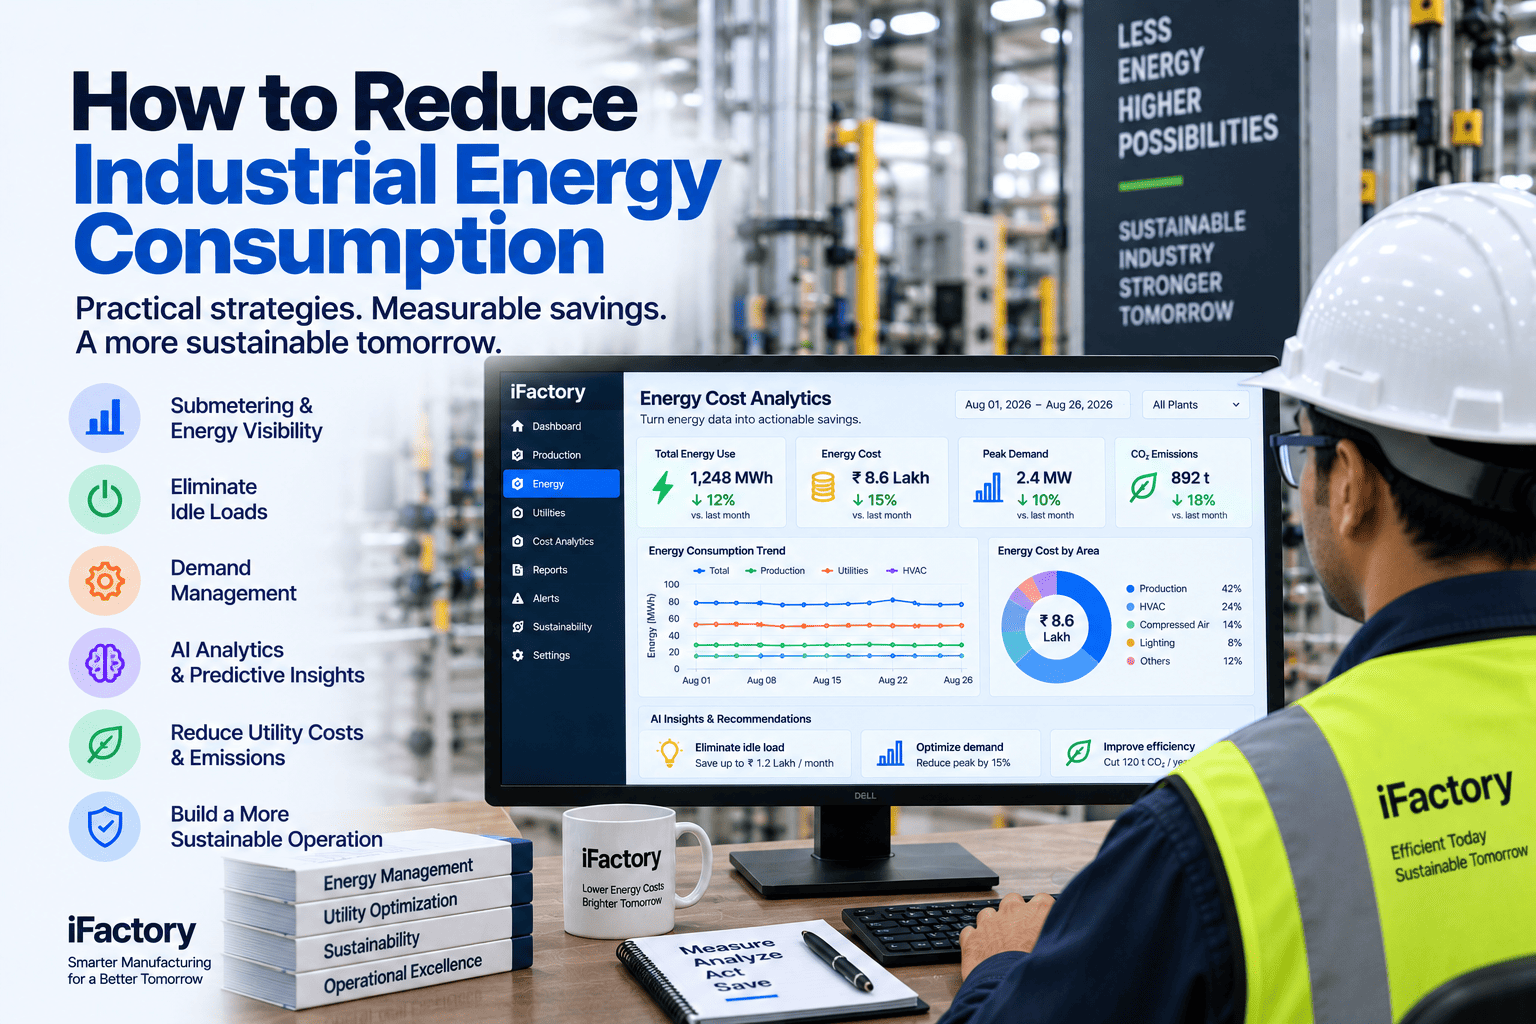
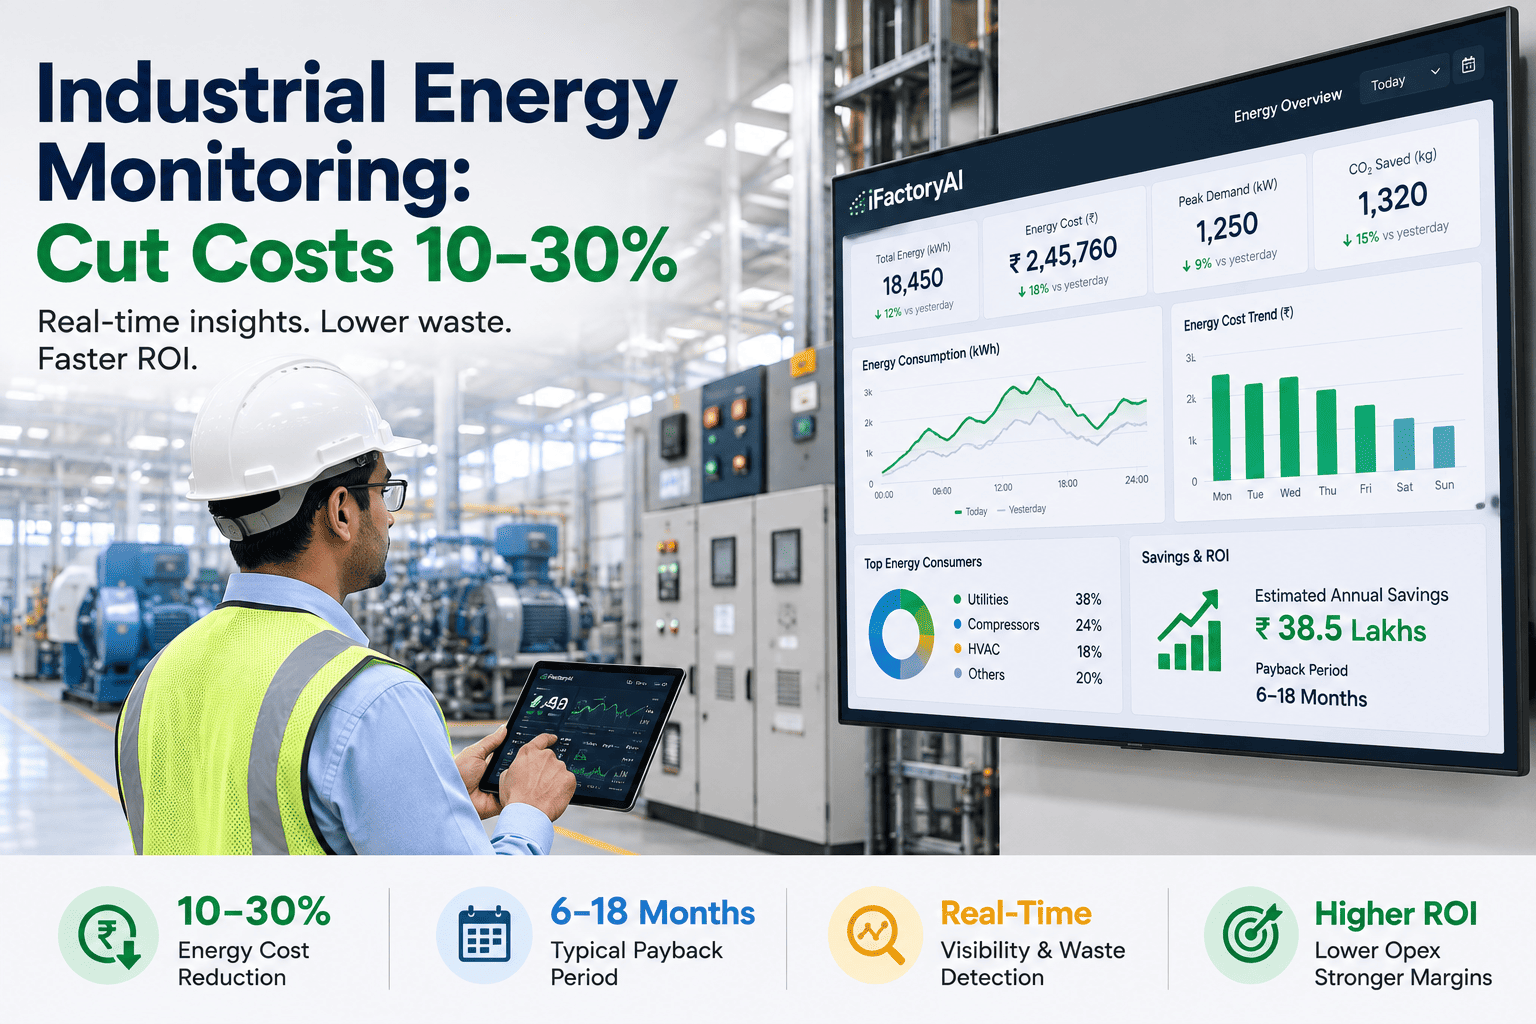
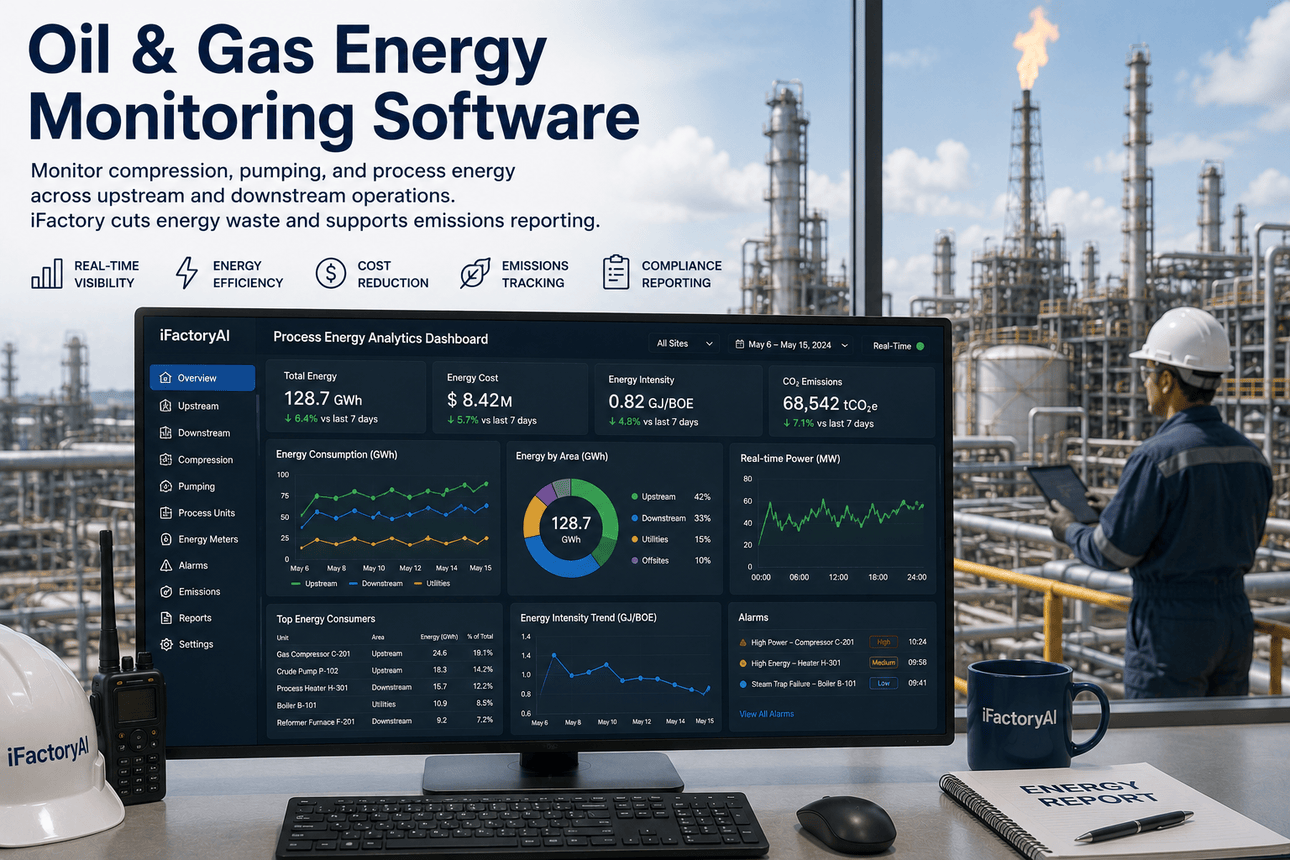
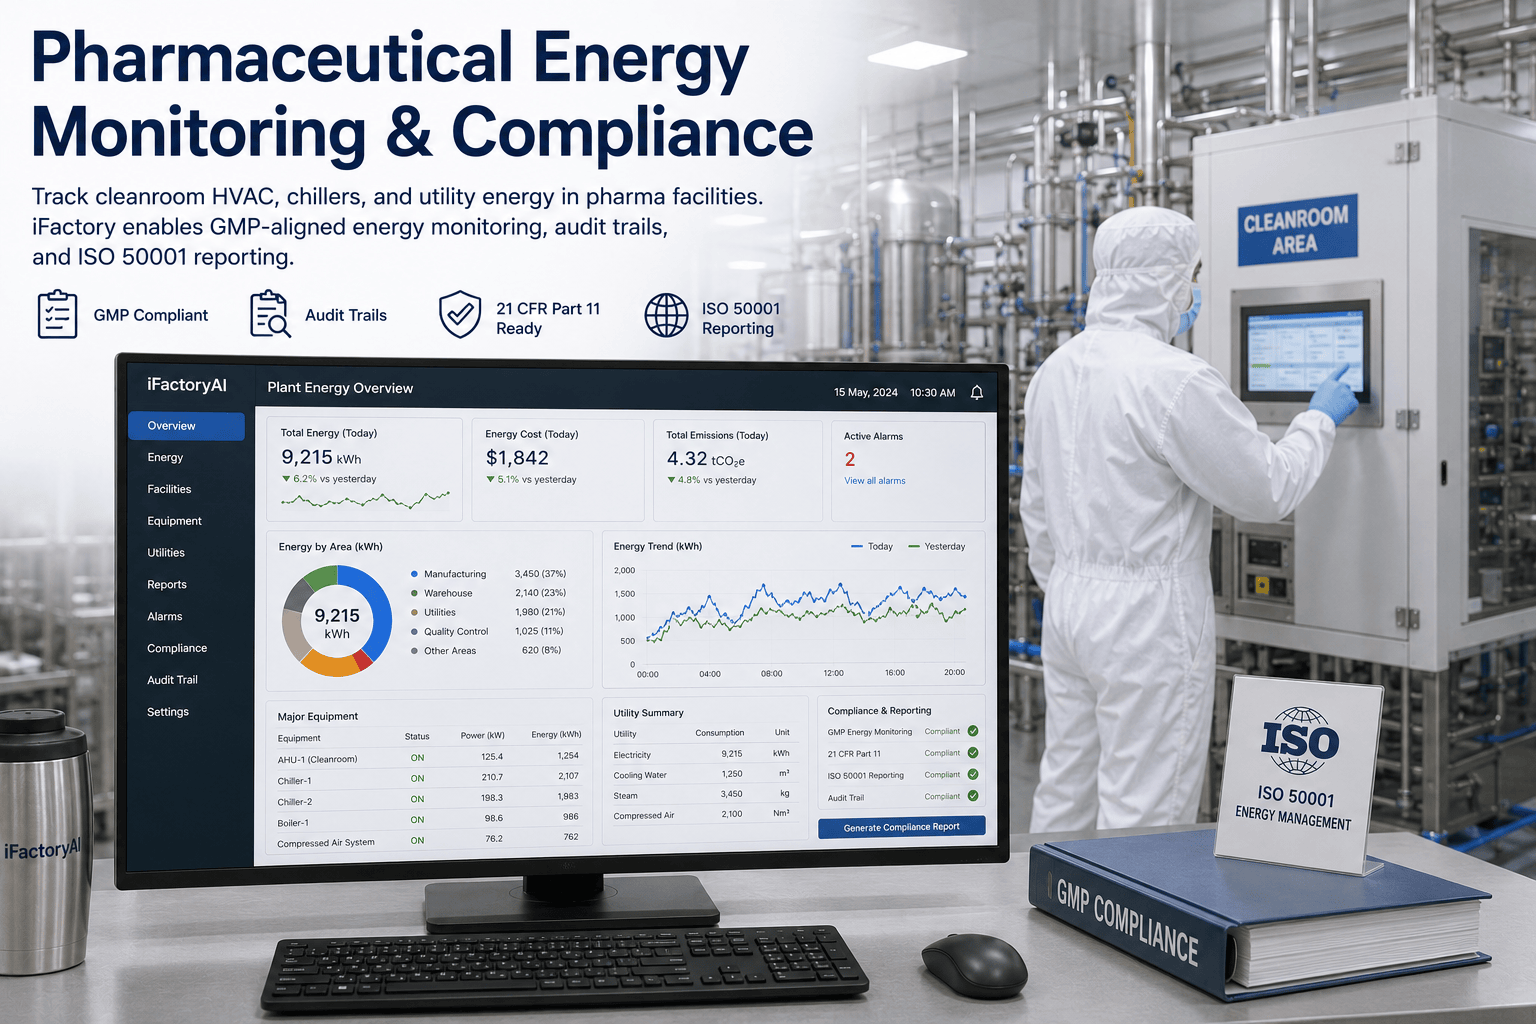
Most plant managers know their total energy bill to the dollar. Far fewer can say which machine, which shift, or which process is responsible for the largest share of it — and almost none can say it in real time. That gap is where the money leaks. A factory burns energy every second of every shift, hundreds of machines each drawing power at different rates, and when consumption is visible only as a monthly invoice, waste accumulates unchecked until a periodic audit finds it months after it happened. Compressed air runs at a fraction of its rated efficiency, HVAC holds temperature through empty shifts, phantom loads draw power from idle equipment overnight, and demand spikes from uncoordinated startups inflate the bill by thousands — none of it visible on a spreadsheet. Real-time energy monitoring closes the gap: live consumption streamed from every meter and machine onto one dashboard, AI that learns each asset's baseline and flags an anomaly in seconds, and consumption tied directly to production so you finally see energy per unit made. Manufacturers who make that shift routinely cut energy costs 10 to 30 percent. To see a live dashboard on your own plant, book a demo.
MANUFACTURING · REAL-TIME ENERGY MONITORING
See Every Kilowatt as It's Consumed — Down to the Machine.
A monthly invoice can't tell you which asset is bleeding energy. iFactory's real-time energy dashboard streams live kWh from every meter and machine, learns each asset's baseline, flags spikes and phantom loads in seconds, and ties consumption to production — so waste becomes visible, attributable, and fixable. Manufacturers cut energy costs 10 to 30 percent.
10–30%
Energy cost reduction manufacturers capture
<5 sec
From an abnormal spike to an alert
machine-level
Drill from plant-wide to a single asset, live
15–30%
Of energy commonly lost to waste and malfunction
The Visibility Gap That Costs You Every Shift
Manual energy management creates a blind spot: without real-time, machine-level data, operators can't see the relationship between production schedules, equipment use, compressed-air leaks, and HVAC operation — so hidden losses accumulate unchecked until an audit catches them months after the waste occurred. Energy is one of the largest controllable costs in manufacturing, yet it stays one of the least understood, because the tools most plants use report a total instead of resolving it. Traditional systems collect data but rarely unify it or turn it into action, leaving the plant with a number it can't diagnose.
The Invoice Is a Total, Not a Diagnosis
A monthly bill tells you the plant spent more, not which of hundreds of machines caused it. Without sub-metering and live data, every load is lumped into one figure, so a compressor running inefficiently or a line left energized overnight disappears into the aggregate until it's large enough to move the whole bill — long after the waste is spent.
Audits Find Waste Months Too Late
Periodic manual audits are snapshots, and the waste they uncover has usually been running for months by the time it's identified. A leak, a phantom load, or a drifting setpoint bleeds continuously between audits, so a once-or-twice-a-year check can't catch the loss while it's still small and cheap to fix.
Energy Is Treated as Fixed Overhead
Traditional management treats consumption as a fixed cost separate from production planning, which quietly forfeits every optimization that comes from linking the two. When energy is just overhead nobody owns per machine, there's no signal telling the plant that this asset, this shift, or this product run is consuming far more than it should.
Dashboards You Only Watch
Many monitoring tools stop at reporting — charts operators glance at but that never trigger an action. Visibility without attribution and without a path to a fix is passive; it shows the waste is happening without telling anyone which machine to touch or scheduling the work that captures the saving.
The losses aren't exotic. Compressed air often delivers only a fraction of its input energy to the point of use, HVAC conditions empty shifts, idle equipment draws phantom loads around the clock, and startup sequences spike demand charges — an estimated 15 to 30 percent of energy is lost to malfunctioning equipment and poor operating practice. None of it is fixable with a spreadsheet; all of it is visible the moment consumption is monitored in real time, per machine.
One Dashboard, Every Machine, Live
The foundation is a single real-time view that unifies every electrical load, utility system, and site, and lets you move fluidly from the whole plant down to one asset without leaving the screen. This is what turns energy from an opaque total into something you can actually see and interrogate as it happens.
LIVE kWh
Sub-second from IoT sensors
Consumption streams live from smart meters, sub-meters, and IoT sensors on motors, drives, and utility systems, so the dashboard shows actual kilowatts as they're drawn rather than a reading averaged over a billing period. Sub-second data means a change in consumption is visible the instant it happens — the difference between watching the plant's energy and reconstructing it after the fact from a bill.
DRILL-DOWN
Plant → zone → machine
One screen spans the whole plant and drills to a zone, a line, or an individual machine, so a plant-wide anomaly can be traced to the exact asset responsible in a few clicks. Zone-level breakdown turns a vague "consumption is up" into a specific "this machine on this line is the cause," which is the resolution at which an operator can actually act.
SHIFT COMPARE
By shift, day, or run
Consumption is comparable across shifts, days, and production runs, exposing why one crew or one campaign draws more energy than another making the same product. Shift comparison surfaces the operational and behavioral differences — a setpoint left high, equipment not powered down, a startup sequence run inefficiently — that a single aggregate number hides completely.
MULTI-SITE
Unified across all plants
A unified dashboard spans every facility, so an energy team managing multiple plants sees them side by side and benchmarks one against another on the same metrics. Multi-site visibility turns a portfolio of separately billed facilities into a single comparable estate, revealing which site leads and which lags and spreading the best-performing plant's practices across the rest.
See Your Top Energy Waste Sources — Live
In 30 minutes, iFactory engineers will show real-time consumption on a dashboard, identify the top waste sources the machine-level view exposes, and calculate the savings you could capture in year one. Real dashboards, real numbers, your factory.
AI That Learns Normal and Flags the Rest
Live data is the input; the value comes from AI that knows what each asset's consumption should look like and catches when it doesn't. Machine-learning models learn every asset's energy baseline and flag deviations the moment they appear — turning a stream of numbers into a prioritized list of things worth fixing.
01
Per-Asset Baseline Learning
The AI learns the normal consumption pattern of each machine and utility system from its own history, so "normal" is defined per asset rather than by a blanket threshold. That baseline is what lets the system tell a genuine anomaly from a legitimate change in load — the foundation every alert is measured against.
02
Spike Alerts in Under Five Seconds
When consumption deviates from baseline, an alert fires in under five seconds by push, email, or SMS, so an abnormal spike is known in the moment rather than discovered on next month's bill. Fast, specific alerting is what makes real-time monitoring actionable instead of merely observational.
03
Phantom Load Detection
The models find phantom loads — the hidden draw of equipment left idle or energized when it shouldn't be, overnight or between runs — that no one notices because nothing is visibly running. Surfacing this always-on waste is one of the fastest paybacks a monitoring program delivers, because it's pure loss with no production value.
04
Degradation and Efficiency Drift
Beyond sudden spikes, the AI catches the slow climb of an asset's consumption as it degrades — a compressor losing efficiency, a motor drawing more for the same work — flagging the drift long before it shows up as a failure or a materially higher bill. Rising energy is often the earliest sign a machine is going bad.
Anomaly detection does double duty. A sudden consumption spike can signal a machine malfunction, so catching it early enhances energy efficiency and reduces downtime and maintenance cost at once — the same alert that saves a kilowatt can be the first warning of a failing asset, which is why one plant's anomaly detection caught a failing compressor that would otherwise have driven a six-figure unplanned outage.
Energy Per Unit: Tie Consumption to Production
The single most powerful move in manufacturing energy monitoring is linking consumption to production output, because that's what converts raw kilowatts into a true efficiency metric. Energy per unit made — not total energy — is the number that tells you whether the plant is getting more or less efficient, and it only exists when energy and production data live in the same system.
THE METRIC
Energy Per Unit, Not Just Total kWh
Total consumption rises and falls with output, so it can't tell you if you're getting more efficient — a busy month costs more even when every machine runs perfectly. Normalizing energy to units produced gives a true efficiency measure that's comparable across shifts, products, and time, revealing real improvement or degradation that a raw total masks. It's the KPI that makes energy a managed variable instead of a fluctuating overhead.
THE INSIGHT
Find the Costly Machine, Shift, and Run
With consumption tied to production, the dashboard exposes which specific machine, shift, or product run carries the highest energy cost per unit — the loss points manual audits consistently miss. That's the difference between knowing the plant's total and knowing that this asset on this shift is the largest controllable waste, which is exactly the resolution needed to target action where it pays. Efficiency stops being a plant-wide abstraction and becomes an assignable, fixable number.
This is also what makes energy and production compatible rather than opposing goals. When AI connects the operational data, efficiency and higher output improve together — real deployments have cut energy use by a fifth while holding or raising throughput, because the waste removed was never producing anything in the first place.
The Difference: Waste Connected to a Work Order
Most energy monitoring tools show you charts. iFactory connects energy waste directly to the equipment causing it and turns the finding into a fix — because a dashboard that only displays a problem still leaves someone to notice it, diagnose it, and schedule the work. Closing that loop automatically is what separates monitoring that saves money from monitoring that just describes the loss.
1
Detect the Waste and Its Source
The platform flags an energy anomaly and attributes it to the specific asset — a compressor running inefficiently, a motor drawing above baseline — so the finding arrives as a diagnosed problem on a named machine, not a generic "consumption high" on a chart. Attribution is the step passive dashboards skip.
2
Auto-Generate the Maintenance Work Order
Rather than just flagging the inefficiency, the platform auto-generates a maintenance work order for the offending equipment, schedules the repair, and can order the parts — routing the fix into the maintenance workflow the moment the waste is identified instead of waiting for someone to translate a chart into action.
3
Fix, Then Track the Savings
After the repair, the platform tracks the energy savings against the pre-fix baseline, quantifying exactly what the intervention recovered. That verified number closes the loop and builds the ROI record that justifies the next fix — energy monitoring that pays for itself in measured, not assumed, savings.
4
Energy and Maintenance in One Platform
Because energy and maintenance live on the same platform, an efficiency anomaly and the work order that resolves it are one connected record, not a handoff between two systems. Rising energy becomes a maintenance trigger, and every fix has both its cause and its saving in a single trail.
This is the whole point of manufacturing-integrated energy monitoring: an infrastructure is only as valuable as the maintenance decisions it triggers. When a compressor runs inefficiently, the platform doesn't just flag it — it schedules the repair, orders the parts, and tracks the savings after the fix, so the loss becomes a resolved, quantified action.
Sustainability and Reporting, Automatically
The same real-time data that cuts cost also carries the plant's sustainability and compliance reporting, so ESG stops being a manual quarterly scramble and becomes a byproduct of continuous monitoring. Every kilowatt tracked is also a carbon number and an audit line.
Real-Time Carbon Tracking
Consumption converts to real-time carbon emissions at the asset, process, and facility level, giving the plant a live carbon footprint rather than an annual estimate. That granular, continuous data is the foundation accurate sustainability reporting and credible reduction targets both depend on.
Audit-Ready ISO 50001 Reports
The platform auto-generates the reports that support ISO 50001 energy-management compliance, turning the documentation burden into a scheduled export. Plants have reached certification early because the evidence trail was assembled automatically rather than reconstructed under deadline.
Targets and Industry Benchmarking
Reduction targets are set with AI-recommended paths to reach them, and performance is benchmarked against industry peers, so the plant knows both where it's headed and how it compares. Goals stop being aspirational and become tracked, measurable trajectories with a clear method behind them.
Role-Based Views for Everyone
AI-curated alerts prioritized by impact, a daily digest of the top savings, and role-based dashboards give the operator, the plant manager, and the C-suite each the view they need. Scheduled PDF and Excel exports deliver audit-ready reports to every stakeholder without anyone assembling them by hand.
Connects to the Plant You Already Run
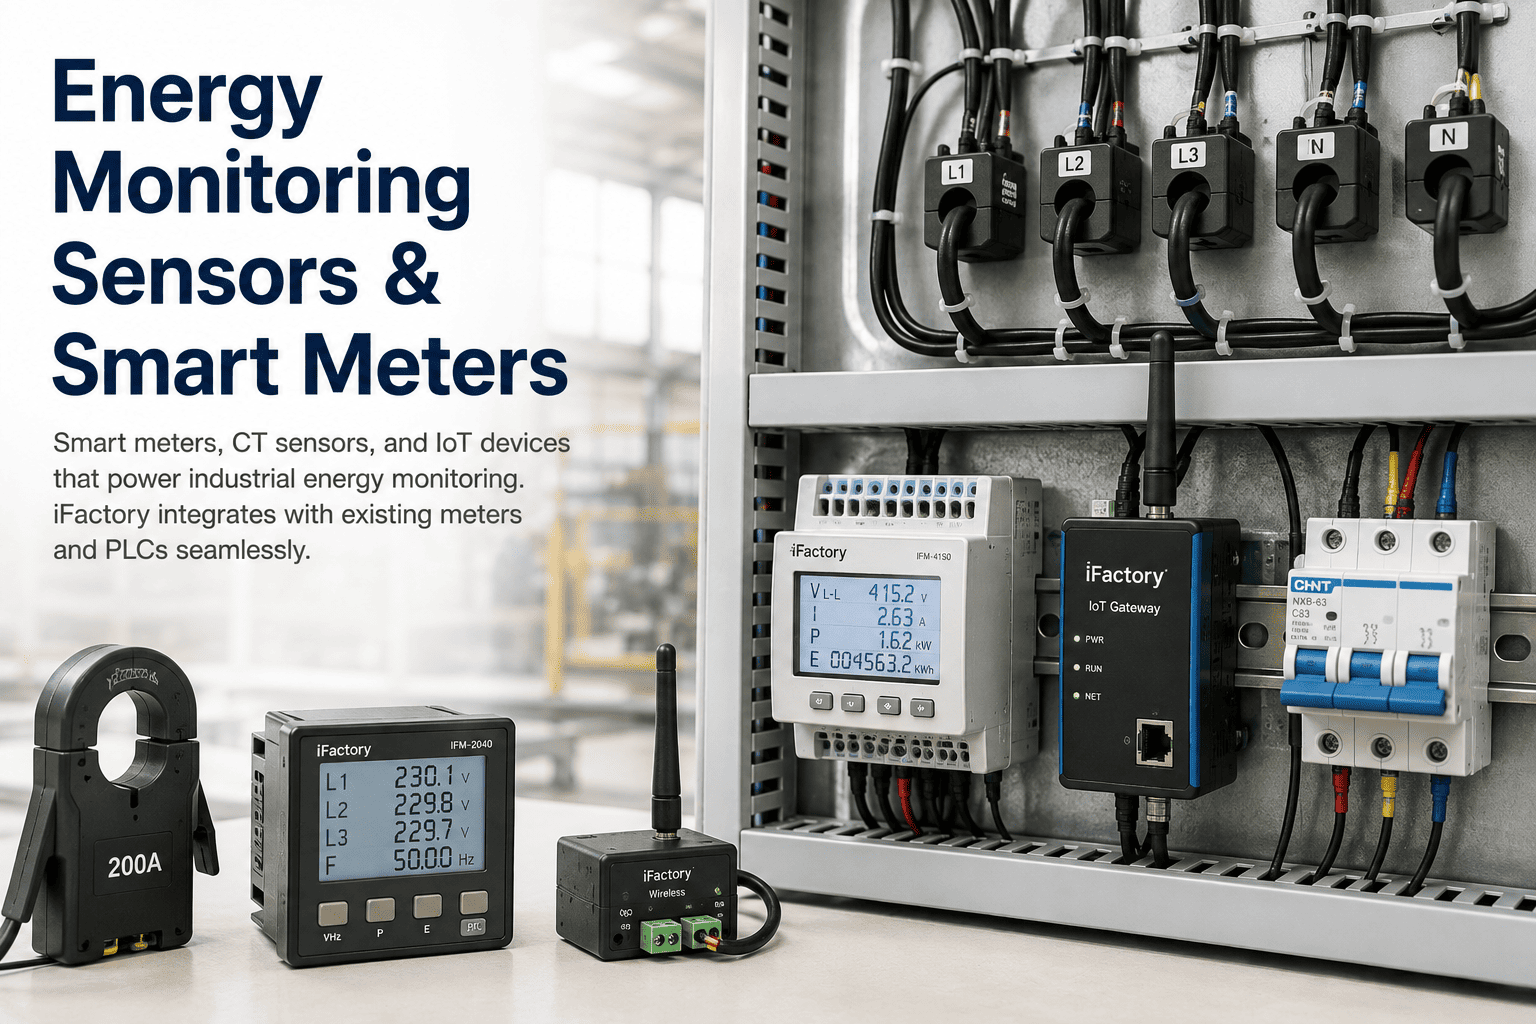
Real-time energy monitoring shouldn't require re-wiring the factory. The platform captures data from the meters, sensors, and building systems already in place, adding coverage only where a gap exists — so visibility goes live quickly without a system replacement.
1
Integrate Existing Meters and BMS
The platform integrates energy meters, IoT sensors, sub-meters, and building management systems, capturing real-time consumption from all electrical loads without replacing the infrastructure — aggregating through standard protocols like OPC-UA so existing instrumentation feeds one unified view.
2
Add Sub-Meters Where Coverage Is Thin
Where a critical system or line lacks measurement, sub-meters and power meters on motors, drives, and compressed-air and HVAC systems are added to reach machine-level resolution — filling the gaps that matter rather than instrumenting everything at once.
3
Import History, Model the Baselines
Historical consumption is imported and cleansed, and the AI models each asset's baseline and calibrates anomaly thresholds, so the system starts flagging meaningful deviations quickly rather than needing months to learn from scratch.
4
Train the Team, Go Live
Staff are trained on the dashboards and alerts so operators, planners, and managers can act on what the system surfaces from day one — turning the monitoring layer into a working part of the plant's routine rather than another screen nobody owns.
What Changes for the Plant
Real-time energy monitoring changes energy from an opaque overhead into a managed, attributable, continuously optimized variable — with effects across cost, reliability, and sustainability at once.
01
Waste Becomes Visible and Attributable
Machine-level, real-time data turns an undiagnosable total into specific, named losses — this compressor, this shift, this phantom load — so the plant acts on the actual sources instead of guessing at an aggregate. The largest controllable cost finally gets managed at the resolution it occurs.
02
10–30% Off the Energy Bill
Catching phantom loads, efficiency drift, compressed-air leaks, and demand spikes early adds up to double-digit percentage savings, with real deployments reporting cost cuts around a third and significant peak-demand-charge reductions. The savings are measured against baseline, not assumed.
03
Energy Alerts Double as Failure Warnings
Because a consumption anomaly often signals a degrading machine, the same alerts that save energy catch failing equipment early — so monitoring cuts unplanned downtime and maintenance cost alongside the energy bill. One system protects two budgets.
04
ESG Reporting Runs Itself
Real-time carbon tracking and auto-generated ISO 50001 reporting turn sustainability compliance from a manual scramble into a byproduct of monitoring, with role-based dashboards keeping operators through C-suite aligned on the same live numbers.
Frequently Asked Questions
The questions plant and energy managers ask most often when evaluating real-time energy monitoring.
We already get an energy bill and do audits. Why do we need real-time monitoring?
Because a bill and an audit both tell you about waste after it's happened, at a resolution too coarse to act on. A monthly invoice is a single total that can't say which of your hundreds of machines caused a rise, and a periodic audit is a snapshot that finds losses which have often been running for months. In between, phantom loads, leaks, drifting setpoints, and degrading equipment bleed continuously and invisibly. Real-time, machine-level monitoring closes that gap: it shows consumption as it happens, attributes it to specific assets, and flags an anomaly in seconds so you fix the loss while it's still small. Given that an estimated 15 to 30 percent of energy is lost to malfunction and poor operating practice, the difference between finding that waste continuously and finding it at the next audit is a large, recurring number. To see the machine-level view on your plant,
book a demo.
Do we have to replace our meters or install a whole new system?
No — the platform is built to capture real-time data from the meters, sensors, and building management systems you already have, without replacing the infrastructure. It integrates energy meters, sub-meters, and IoT sensors and aggregates them through standard industrial protocols like OPC-UA into one unified dashboard. Where a critical system or line lacks measurement, sub-meters and power meters are added on motors, drives, compressed air, and HVAC to reach machine-level resolution — but that's filling specific gaps, not a wholesale install. Deployment also imports and cleanses your historical consumption so the AI can model each asset's baseline and calibrate anomaly thresholds quickly, rather than needing months to learn. The result is that visibility goes live fast, layered onto your existing plant, with new hardware added only where it's genuinely needed for the coverage that matters.
What makes this different from a standard energy dashboard?
Most energy tools stop at showing you charts — they report consumption and leave operators to view it passively, with no attribution and no path to a fix. This platform connects energy waste directly to the equipment causing it and turns the finding into action: when it detects an inefficiency, it attributes it to the specific asset, auto-generates a maintenance work order, schedules the repair, and can order the parts, then tracks the energy savings after the fix against the pre-repair baseline. Because energy and maintenance live on one platform, rising consumption becomes a maintenance trigger and every fix carries both its cause and its verified saving in a single record. That's the core difference — an infrastructure is only as valuable as the decisions it triggers, so instead of a dashboard that describes the loss, you get a loop that resolves it and proves the saving. It's monitoring that reduces cost rather than just displaying it.
How does linking energy to production actually help?
It converts raw consumption into a true efficiency metric. Total energy rises and falls with how much you're producing, so a total alone can't tell you whether the plant is getting more or less efficient — a busy month costs more even when every machine runs perfectly. Normalizing energy to units produced gives you energy per unit, a measure that's comparable across shifts, products, and time and reveals real improvement or degradation that a raw total masks. More importantly, with consumption tied to production the system exposes which specific machine, shift, or product run carries the highest energy cost per unit — the loss points manual audits miss. That's the resolution at which you can target action where it pays. It also reframes energy and output as compatible goals: real deployments have cut energy use by around a fifth while holding or increasing throughput, because the waste removed wasn't producing anything to begin with.
Can it handle multiple sites and our ESG reporting?
Yes to both. A unified dashboard spans every facility, so an energy team managing multiple plants sees them side by side on the same metrics and benchmarks one against another, which surfaces which site leads and lets the best performer's practices spread across the estate. On sustainability, the same real-time data that drives cost savings also carries reporting: consumption converts to real-time carbon emissions at asset, process, and facility level for a live carbon footprint, and the platform auto-generates the documentation that supports ISO 50001 compliance — some plants have certified early because the evidence trail assembled itself. You can set reduction targets with AI-recommended paths and benchmark against industry peers, and role-based dashboards plus scheduled PDF and Excel exports deliver audit-ready reports to operators, managers, and the C-suite without anyone building them by hand. ESG becomes a byproduct of monitoring rather than a separate quarterly project. Contact
iFactory support to scope a multi-site rollout.
SEE IT · ATTRIBUTE IT · FIX IT · PROVE THE SAVING
Turn Your Energy Bill From a Mystery Total Into a Managed, Machine-Level Number.
Live kWh from every meter and machine on one dashboard, AI that learns each asset's baseline and flags spikes and phantom loads in seconds, consumption tied to production for true energy-per-unit efficiency, and waste connected straight to a work order with the savings tracked after the fix. Real-time carbon and ISO 50001 reporting included — and manufacturers cut energy costs 10 to 30 percent.