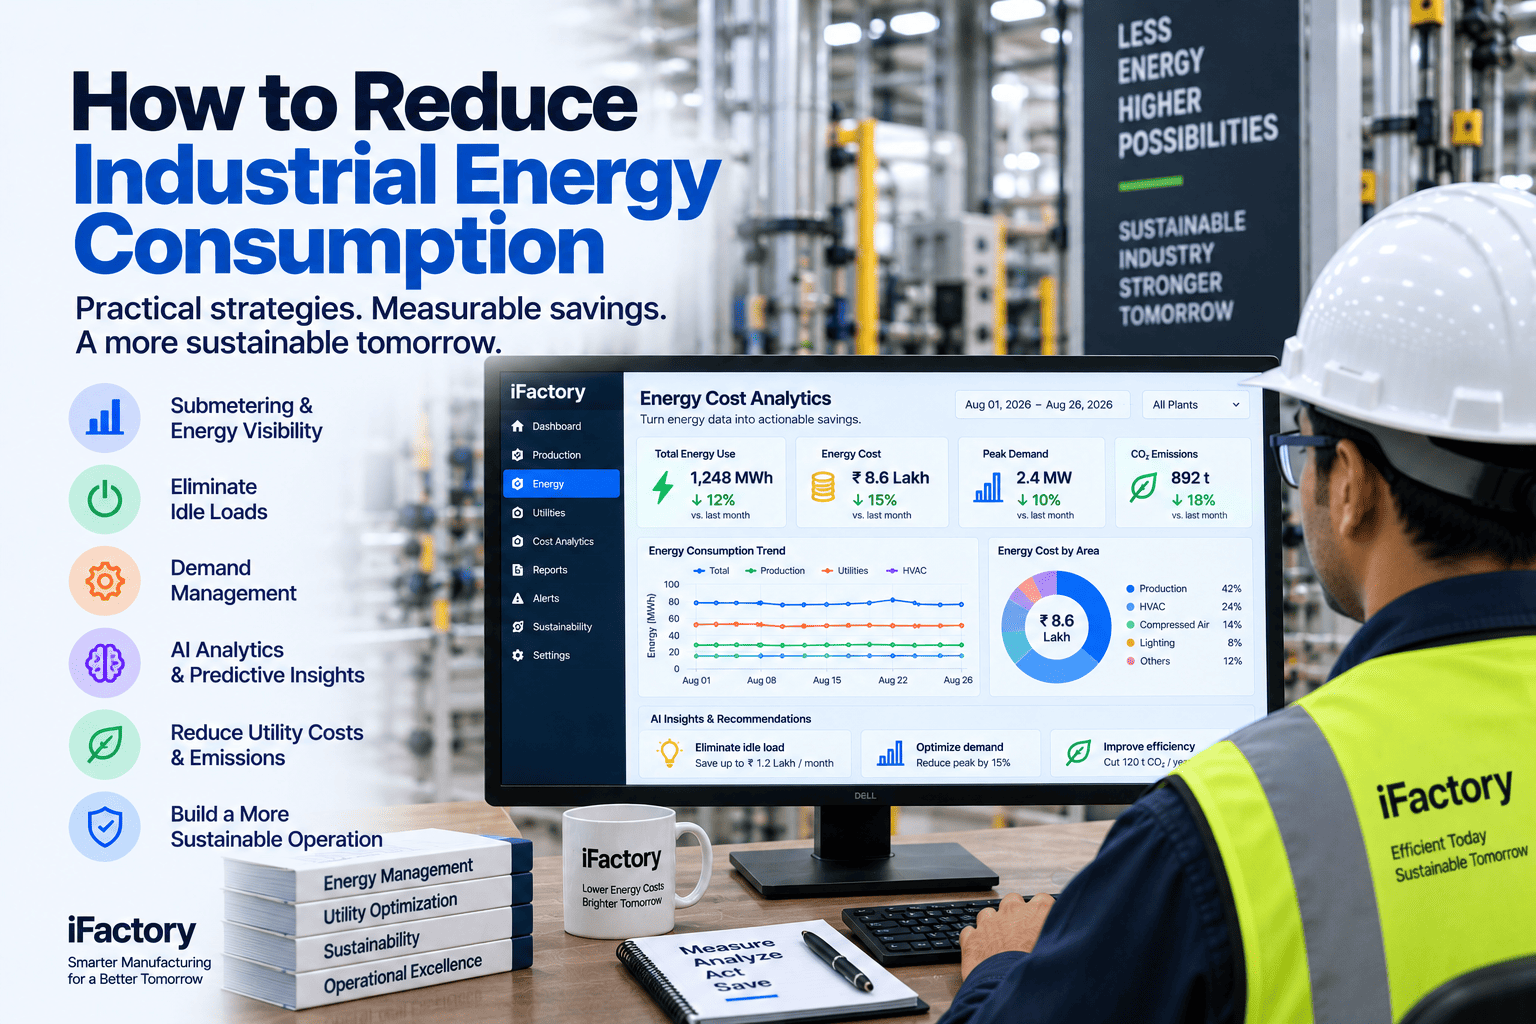
Reducing industrial energy consumption isn't one big capital project — it's a sequence of strategies, and the order matters more than most energy managers expect. You can't reduce what you can't see, so it starts with submetering. The fastest wins cost nothing, so idle-load elimination comes next. Then the surprise: for most sites the single largest lever isn't how much energy you use at all — it's the peak demand charge, which can be 30 to 50 percent of the bill and is often set by one 15-minute spike you never noticed. And AI analytics turns the whole effort from a one-time audit that decays into continuous, compounding savings. Run these four in order and a 10 to 20 percent reduction is realistic without touching production. This guide walks through each. You can book a demo to see the analytics behind it.
Four Strategies, Run in Order — Because You Can't Cut What You Can't See
Submetering, idle-load elimination, demand management, and AI analytics — the practical sequence that cuts industrial energy 10 to 20 percent without touching production, starting with the peak-demand lever most managers overlook.
Most Managers Optimize Consumption and Ignore Demand
Before any strategy, understand what you're actually paying for, because industrial electricity has two distinct charges and most energy programs only attack one. Consumption charges bill you per kilowatt-hour used — the number everyone thinks of as the electricity bill. Demand charges bill you per kilowatt of peak power drawn in any short interval, and they can be 30 to 50 percent of the total. Cutting kilowatt-hours without touching the demand peak leaves the larger, easier lever untouched.
The cost of the total energy you use over the month. It's what most efficiency work targets — better motors, LED lighting, less waste — and it matters, but it's only half the bill, and often the smaller half to move quickly.
The cost of your highest power draw in any 15-minute window, often 30 to 50 percent of the bill — and a single spike, like every machine starting at shift change, can set it for the entire month. This is the lever hiding in plain sight.
Because a demand charge is set by one brief peak, you can cut it without using any less energy overall — just by not drawing it all at once. Staggering equipment startups so motors and compressors come online minutes apart instead of simultaneously can flatten the morning peak by 20 to 35 percent with zero capital investment. In one common scenario, a plant bringing 600 kW online at once versus staggering to a 400 kW peak saves on the order of $2,200 a month at typical demand rates. That's a bill reduction with no efficiency project at all — which is why demand management belongs near the front of the sequence, not the back.
You Can't Reduce What You Can't See
Every reduction strategy depends on knowing where the energy actually goes, and a single utility meter can't tell you — it blends every line, machine, and system into one number. Submetering breaks that number apart, measuring consumption at the production-line and major-equipment level, which is the foundation everything else builds on. Without it, you're optimizing blind. Here's what it unlocks.
Line- and equipment-level metering identifies which processes and machines actually drive consumption, so improvement effort goes to the loads that matter instead of being spread evenly across everything.
Submetering surfaces equipment drawing more than it should — a motor degrading, a compressor working too hard — as a consumption signature that stands out against its own normal, invisible in the aggregate bill.
Utilities measure demand every 15 minutes, but most facilities check the meter monthly at best — so peaks are discovered 30 to 45 days late, already paid for. Submetering with live visibility catches the spike while you can still act on it.
You can't prove a saving without a before. Submetered data is the baseline that lets you measure whether idle-load elimination, demand management, or any other change actually worked — and by how much.
Start Where Every Strategy Starts: Visibility
iFactory submeters your lines and major equipment and shows consumption and demand live — so you find the peak-consumption loads, catch demand spikes as they form, and have the baseline the rest of the plan depends on.
The Cheapest Energy Is the Energy You Stop Wasting on Nothing
Once you can see consumption, the fastest returns come from cutting the energy spent producing nothing at all. Idle and standby waste is enormous and almost entirely free to fix — no capital, just visibility and a schedule change. These are the idle-load pools submetering makes actionable.
Equipment left running between production runs and during breaks consumes 20 to 40 percent of its operating energy while producing nothing. Seeing which machines idle, and for how long, turns that into a shutdown or auto-standby policy.
Compressed air is among the most expensive utilities, and a single 3mm leak wastes roughly $2,500 a year. A leak-detection program with ultrasonic surveys is one of the fastest-payback projects in any plant — days to weeks.
Areas lit and conditioned 24/7 when production runs 16 hours or less, or the whole facility heated when only part is occupied, waste continuously. Tying lighting and HVAC to occupancy and schedule is a pure, safe saving.
Motors, pumps, and compressors sized for peak but running at 40 to 60 percent most of the time are inefficient at partial load. Identifying them points to variable-speed drives that match output to actual demand.
Cut the Peak, Not Just the Total
This is the strategy most energy programs miss, and often the highest-return one, because it attacks the demand half of the bill directly. Demand management is about not drawing all your power at once — spreading and shaving the peak so the charge that's set by a single spike comes down, frequently with no reduction in total energy at all. These are the levers.
When motors, compressors, and lines all start together at shift change or after an outage, inrush current creates a peak 3 to 5 times steady-state. Sequencing startups over 15 to 30 minutes flattens that morning peak by 20 to 35 percent with zero capital — the simplest, highest-impact move there is.
An energy management system can automatically drop non-critical loads — comfort HVAC, non-urgent equipment — for the brief windows when demand approaches a new monthly high, then restore them, so a peak never locks in. The load is deferred, not lost.
Where a process can run at any time, moving it to off-peak or lower-rate periods cuts both the demand peak and, under time-of-use pricing, the energy cost of running it — the same work done when power is cheapest.
Where operational changes aren't enough, a battery system charges off-peak and discharges to cap the demand peak. It's capital, but the demand-charge savings can pay it back in a few years — the option when the peak can't be scheduled away.
What Turns a One-Time Audit Into Continuous Savings
The first three strategies deliver a step change — but energy efficiency decays. Setpoints drift, new equipment adds load, habits slip, and a plant audited last year is wasting again this year. AI analytics is what makes reduction continuous instead of a project you repeat every few years, watching the submetered data constantly and closing the loop the moment waste reappears. This is the layer that compounds the savings.
Predictive analytics forecasts when demand is heading toward a new peak and prompts a shed or a stagger before the spike locks in — acting in the 15-minute window that decides the month, which manual monitoring always misses.
When a motor starts drawing more than its baseline or a process creeps up in consumption, the analytics flags the trend early — so degradation and drift are caught while small, not discovered in next year's audit.
Beyond alerting, an advanced system can automatically sequence equipment, shed loads, and shift consumption in response to real-time price and demand signals — running the plant at optimal cost without a person watching the meter.
Continuous data quantifies what each change actually saved and rolls into the energy-intensity and sustainability reporting a modern energy program has to produce — turning the effort into evidence, not estimates.
Each Strategy Makes the Next One Work
The four strategies aren't a menu to pick from — they're a sequence, because each one depends on the one before it. Skipping ahead is why energy programs stall. Run in order, they compound into the 10 to 20 percent reduction that's realistic for most industrial sites without touching production.
Without visibility you're guessing. Submetering gives you the where and the baseline that make every later strategy targetable and measurable — attempt anything else first and you can't tell if it worked.
With visibility in hand, the zero-capital idle and leak fixes come next — the fastest payback, banking savings that build momentum and often fund the rest.
Now attack the demand half of the bill with staggering and shedding — a large reduction that, again, mostly needs coordination rather than capital, informed by the submetered peak data.
Finally, layer analytics on top to keep all three working continuously — catching drift, anticipating peaks, and automating the response so the savings don't erode back to where you started.
The Whole Sequence on One Analytics Platform
iFactory runs the full reduction sequence on one platform: it submeters for visibility, surfaces idle and leak waste, manages the demand peak, and applies analytics that keep the savings compounding — so an energy manager works a plan rather than chasing a one-time audit.
What Energy Managers Ask About Reducing Industrial Energy
Run the Whole Sequence, Not Another One-Time Audit
iFactory submeters for visibility, surfaces the free idle and leak wins, manages the demand peak that's 30 to 50 percent of your bill, and applies analytics that keep the savings compounding — a 10-to-20-percent reduction worked as a plan, not chased as a project.