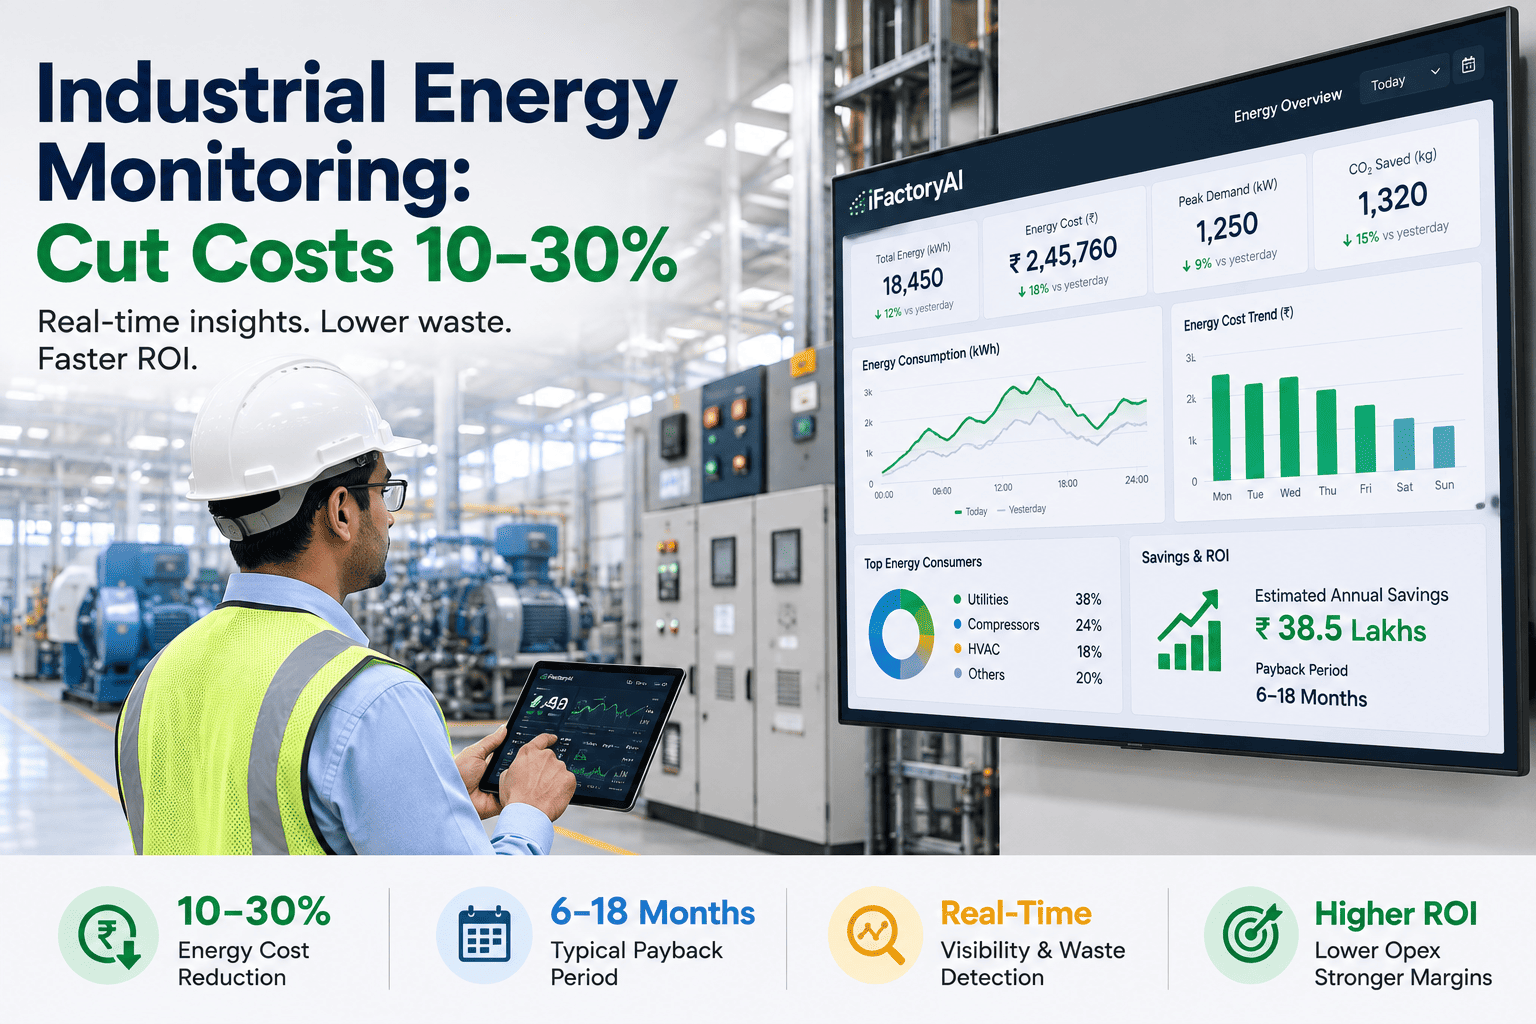
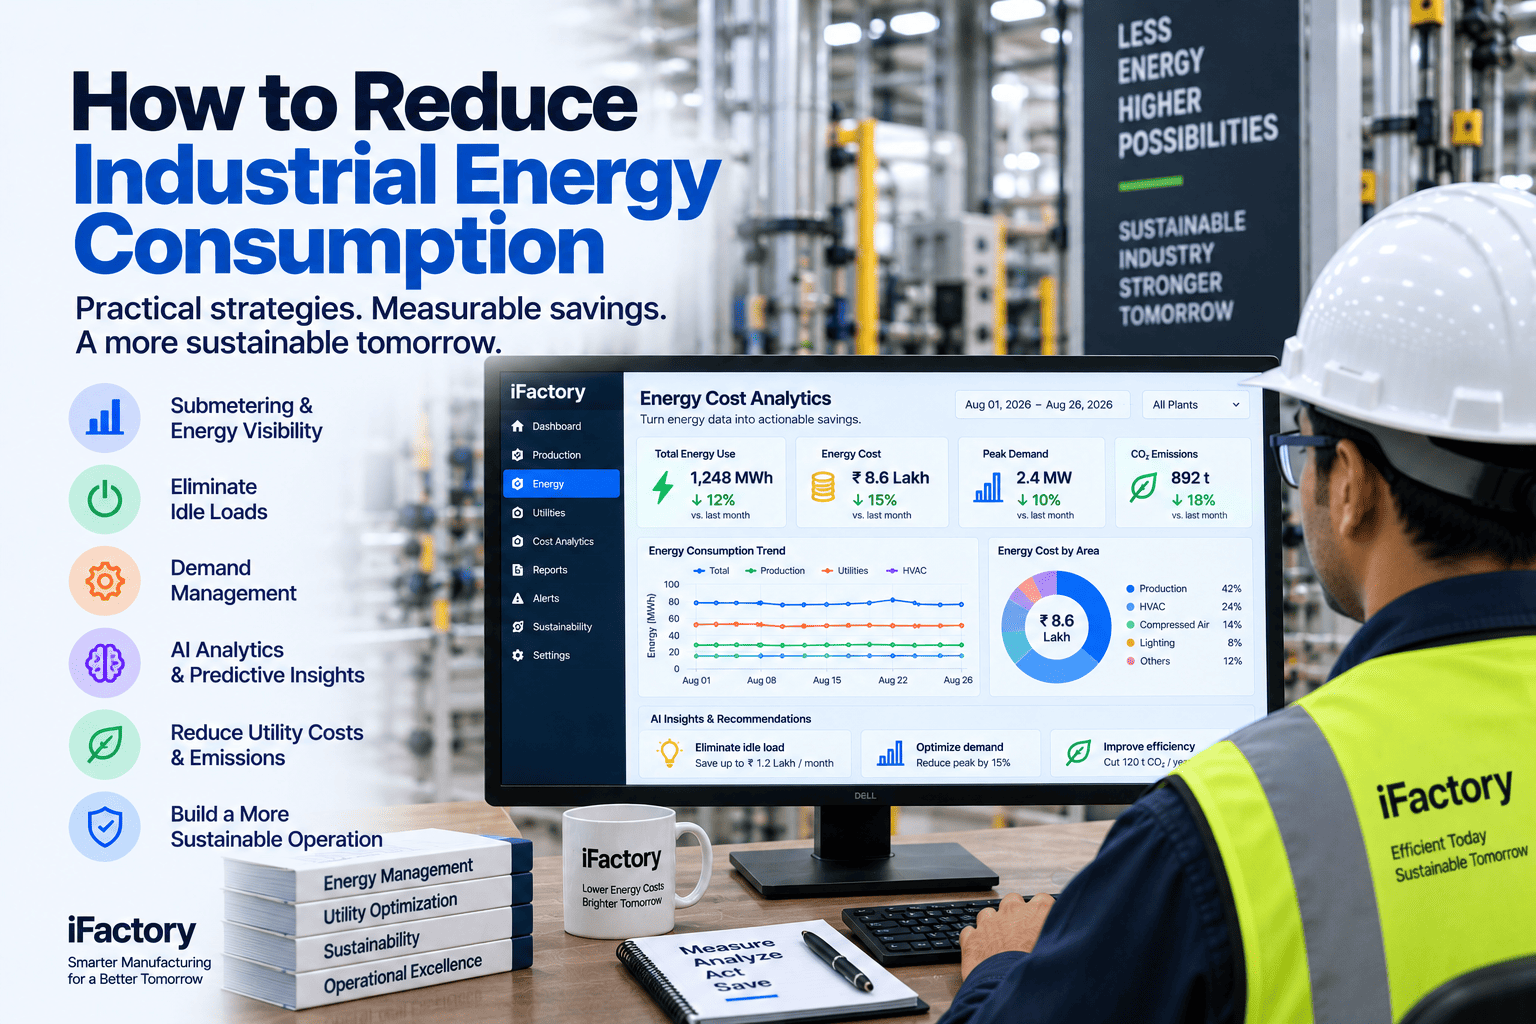
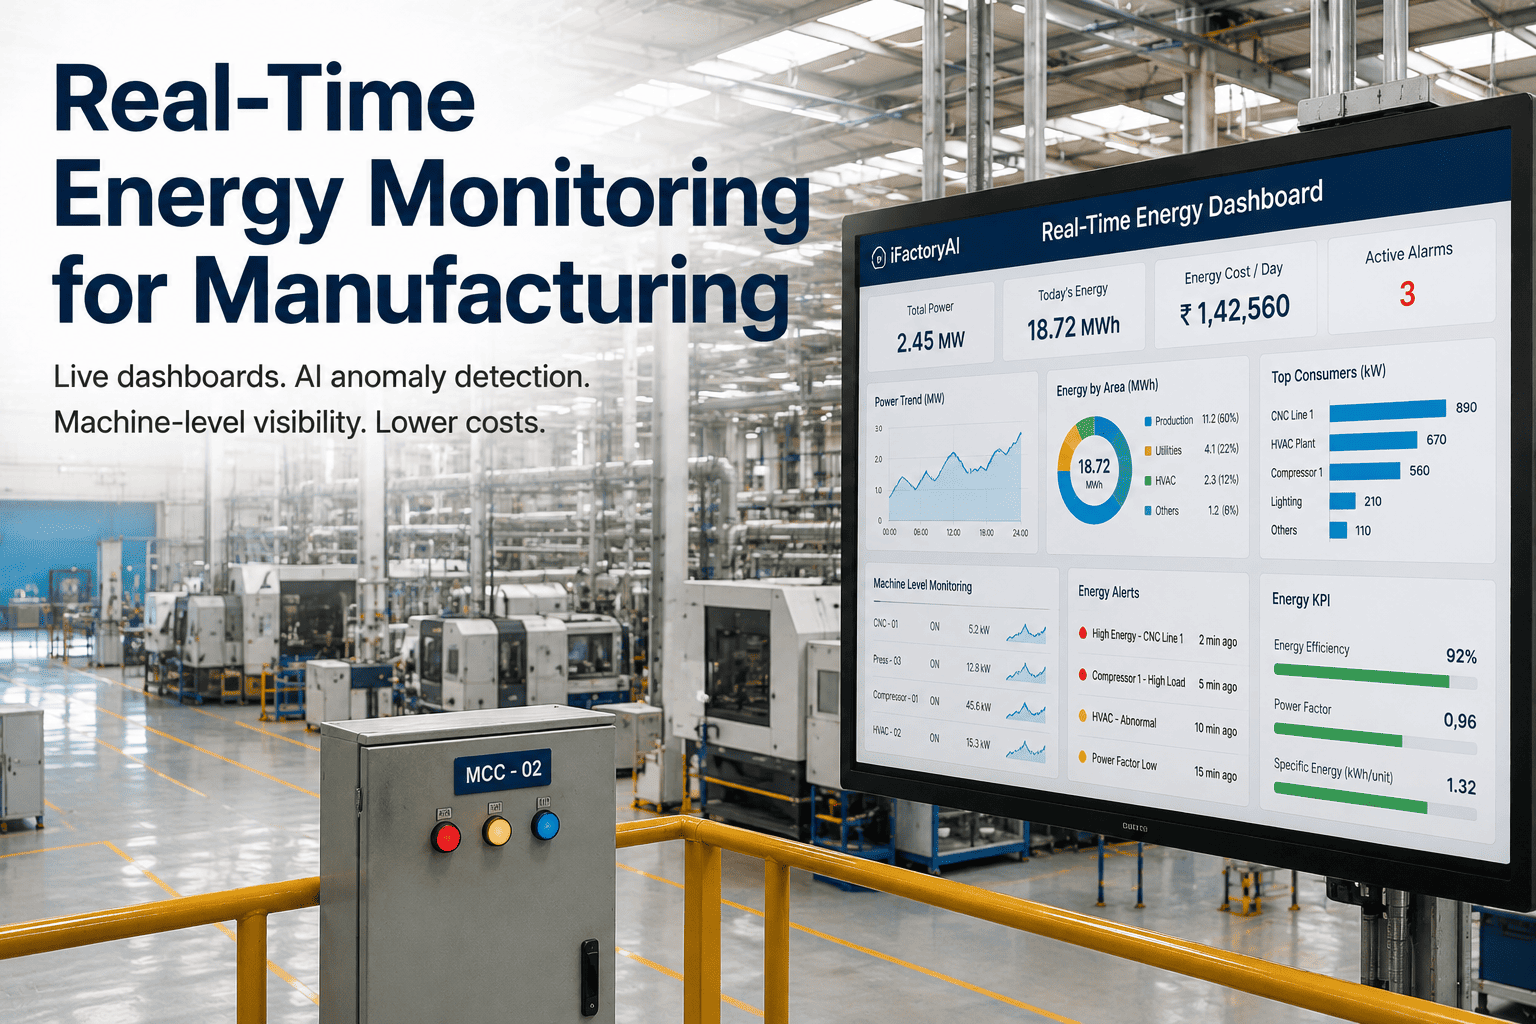
The average manufacturing facility spends 15 to 25 percent of its total operating cost on energy, and for a plant drawing 5 to 10 megawatts that's $200,000 to $800,000 or more a year — one of the largest controllable line items on the P&L, and one of the least understood. The reason it stays uncontrolled is structural: most facilities manage energy from a monthly utility bill, and a monthly bill is the wrong instrument entirely for finding waste. It answers exactly one question — how much did the plant consume in total this period — while the questions that actually save money go unanswered. Which machine, which shift, which process? What set the demand peak that inflated the whole month? Is the power factor triggering a penalty? Meanwhile compressed air leaks a third of its output, phantom loads draw around the clock, and the bill climbs with an industrial electricity price that keeps rising. Industrial energy monitoring closes that gap and turns the biggest hidden cost into a managed one — and the financial case is unusually strong: 10 to 30 percent cost reduction, with payback typically in 6 to 18 months. To model the ROI for your plant, book a demo.
MANUFACTURING · ENERGY COST REDUCTION & ROI
Cut Energy Costs 10–30% — With Payback You Can Take to the CFO.
Energy is 15–25% of manufacturing operating cost, and a monthly bill can't tell you where it leaks. iFactory's energy cost analytics turns real-time, machine-level data into attributed savings — kWh waste, demand charges, and power-factor penalties — with a payback typically inside 6 to 18 months and a five-year ROI that clears the hurdle rate by a wide margin.
10–30%
Energy cost reduction manufacturers capture
6–18 mo
Typical payback on a well-deployed system
30–50%
Share of the bill demand charges reach in some markets
20–30%
Of energy wasted through leaks, phantom loads, inefficiency
The Monthly Bill Is the Wrong Instrument
The fundamental problem with traditional energy management in manufacturing isn't a lack of effort — it's a structural data gap. The monthly utility bill is the only instrument most facilities have, and it's the wrong instrument for identifying waste at the source, because it answers a single question: how much did the plant consume in total this period. Everything that would let you reduce that number — which asset, which shift, which behavior, which peak — is invisible in the total. And an annual energy audit doesn't fix it: a consultant walks through once, analyzes last quarter's bills, and hands over a report whose recommendations are outdated before they're implemented, while the compressed-air leak keeps running for months.
Managing From the Monthly Bill
A single lagging number can't reveal which line, machine, or shift drives consumption, so waste persists unseen for years. The bill confirms the plant spent more without offering a single clue about what to fix — the one habit that quietly inflates industrial energy cost more than any other.
Chasing Total kWh, Not kWh Per Unit
A plant can cut total consumption simply by producing less while getting worse per unit — a false win that hides real inefficiency behind a lower headline number. Without normalizing energy to units produced, a quieter month looks like progress even as the plant grows less efficient at making each part.
Energy and Production Kept Separate
Idle draw, minor stops, and rework are simultaneously a throughput problem and an energy problem, but treated as separate issues they get solved as neither. Addressing them once solves both — yet a plant that manages energy in a different silo from production never sees the shared root cause.
Audits That Arrive Too Late
A retrospective annual audit is a snapshot of a plant that has already changed, and its insights are stale by the time budget allows action. Meanwhile a leaking compressed-air system, an HVAC unit fighting an open dock, and motors at inefficient loads keep bleeding money the audit won't catch until next year.
The competitive stakes are rising, not static. Industrial electricity prices ticked up again into 2026 with further increases projected, so the gap between facilities that can see and manage their energy and those that can't widens every quarter. Monitored plants absorb the price increases through efficiency; unmonitored ones simply pay them.
Where the Savings Actually Come From
Energy monitoring doesn't save money through a single mechanism — it opens several distinct savings streams, and the strongest business cases stack them. Understanding each is how a plant sizes the real opportunity rather than counting only the obvious kWh reduction.
STREAM 1
Direct Consumption Waste
Manufacturing facilities waste an estimated 20 to 30 percent of energy through compressed-air leaks, phantom loads from idle equipment, and machines running at inefficient loads. Real-time machine-level data exposes each source the moment it appears, so a leak that a bill would hide for months is fixed while it's small. This is the foundational stream — the everyday operational waste that continuous visibility converts directly into recovered kilowatts.
STREAM 2
Demand Charge Reduction
In demand-heavy tariff territories the demand component can be 30 to 50 percent of the total bill, billed on the single highest short interval in the month — so one uncoordinated startup or simultaneous load event can set the charge for the entire period. Real-time demand visibility lets facilities cut peak demand charges by 15 to 25 percent through improved operational awareness alone, and this savings stream is often missed entirely by simple kWh calculations, making it the single fastest ROI lever in the right tariff.
STREAM 3
Power Factor Penalties
Inductive loads like motors and VFD-driven equipment drag down power factor, and most utilities penalize a facility whose power factor falls below about 0.95 — a charge that can run into tens of thousands a year and often appears suddenly when new equipment shifts the load. Monitoring surfaces the power-factor problem and its cost, so correction is targeted where it pays; a capacitor bank addressing it can return its investment in a matter of months while also reducing the kVA that inflates demand.
STREAM 4
Demand-Response Rebates
Many utilities and grid operators run demand-response and efficiency programs that pay manufacturers to shift or shed load at peak times, and real-time visibility is the prerequisite to participating intelligently — curtailing non-critical load on signal without disrupting production. Knowing your load shape is what lets you monetize it, turning a cost center into a source of rebates that improve the payback on the monitoring investment itself.
Model the ROI on Your Own Utility Bills
Bring a recent utility bill — including the demand and any power-factor lines. iFactory engineers will identify your top waste sources, estimate the savings across each stream, and show the payback period for your specific consumption, tariff, and equipment mix. Real numbers, your factory.
The ROI Math: Payback in Months, Not Years
The financial case for energy monitoring is unusually clean because the savings are large, recurring, and measurable, while the cost is modest and the deployment low-risk. Here's how the return actually builds — the numbers a CFO will want before approving the spend.
01
A Large, Recurring Base to Save Against
With energy at 15 to 25 percent of operating cost — hundreds of thousands to millions a year for a mid-to-large plant — even a 10 to 30 percent reduction is a substantial recurring saving. The savings compound as electricity prices rise, so the same efficiency is worth more each year, and the investment effectively appreciates over its life.
02
Payback Inside the Fiscal Year
Most facilities recover the full investment within 6 to 18 months, and many within the same fiscal year, because the savings start within weeks of going live rather than after a long build. Properly implemented monitoring simply doesn't carry the multi-year payback of a heavy capital project.
03
Five-Year ROI in the Hundreds of Percent
Accounting for both energy savings and the maintenance-cost reductions that come with equipment-health visibility, documented five-year ROI consistently runs several hundred percent. The return isn't a single year's saving but a compounding stream across the system's life, which is what makes the five-year view so favorable.
04
Low Risk, Fast Start
Because the platform is hardware-agnostic and integrates existing infrastructure with no costly equipment replacement, there's no construction and minimal disruption — data starts flowing quickly and savings begin within weeks. The low implementation risk is itself part of the business case, removing the usual reasons a capital project stalls.
The competitive framing matters as much as the raw return: monitored facilities gain a measurable operational cost advantage over unmonitored competitors, and that gap widens as energy prices climb. The only plants that shouldn't invest in energy monitoring are those already running at peak efficiency — and without monitoring data, no plant can actually know whether it is.
Demand Charges and Power Factor: The Hidden Bill
The two savings streams most often left on the table are the two least visible on a simple kWh reading — demand charges and power-factor penalties. Both are driven by how and when load is drawn rather than how much total energy is used, and both are exactly what real-time monitoring is built to expose.
DEMAND CHARGES
One Peak Sets the Whole Month
Demand is billed on the highest short interval — often a single 15-minute window — so a simultaneous startup or an uncoordinated load event can set the billing tier for the entire month, and a ratchet clause can carry that peak forward for months more. Without visibility into which equipment combinations drive peaks and when they occur, a plant can't manage what it can't see. Real-time demand data reveals the pattern and enables peak shaving and staggered startups that cut the demand component 15 to 25 percent — a stream a kWh-only calculation misses entirely.
POWER FACTOR
Reactive Power, Real Penalties
Motors, transformers, and VFD-driven equipment consume reactive power that drags power factor down, and utilities penalize customers below roughly 0.95 — a charge that can appear abruptly when new inductive load shifts the profile and can cost tens of thousands a year. Low power factor also inflates the kVA that demand is billed on, so it hits twice. Monitoring identifies the penalty and its source, so a correction such as a capacitor bank is sized and placed where it pays, often returning its cost in months while relieving demand at the same time.
These are the streams that make the difference between a good ROI and an outstanding one. A plant that only counts kWh reduction undercounts its own opportunity — the demand and power-factor components, invisible on the surface of the bill, are frequently where the fastest and largest returns actually live.
The Compounding Return: Energy Plus Maintenance
The energy savings are only half the financial story. Because a consumption anomaly is often the earliest sign of a degrading machine, the same monitoring that cuts the energy bill also drives down maintenance cost — and stacking the two is what pushes the multi-year ROI so high.
1
Energy Anomalies Warn of Failure Early
A machine drawing above its energy baseline is frequently degrading, so an efficiency alert doubles as an early failure warning — often weeks of advance notice. Catching the fault early is the trigger that converts an emergency into planned work, before the energy waste or the breakdown compounds.
2
Condition-Based Maintenance Cuts Cost 20–40%
Shifting from calendar to condition-based maintenance on the back of this visibility typically reduces total maintenance cost by 20 to 40 percent while extending equipment life by 15 to 25 percent. The plant services machines when the data says to, not on a schedule that over- or under-maintains them.
3
Emergency Repairs Fall Away
Emergency repairs run two to three times the cost of planned maintenance once overtime, expedited parts, and secondary damage are counted, and they decline sharply when energy-signature anomalies give weeks of warning. Removing the emergency multiplier is a large, direct saving on top of the energy reduction.
4
Two Budgets, One Platform
Because energy and maintenance run on one platform, a single anomaly can trigger both an energy saving and a maintenance work order, and both are tracked to a verified result. The five-year ROI that clears several hundred percent reflects this stacking — the energy and maintenance returns compounding on the same investment.
This is why the strongest business cases account for both streams. Counting only energy savings understates the return; the full five-year ROI, accounting for energy and maintenance together, consistently exceeds several hundred percent across documented industrial deployments — one investment protecting two of the plant's largest controllable costs.
Deployment Built Around ROI
A cost-reduction program should prove its return before it scales, and the deployment is structured to do exactly that — start where the savings are largest, integrate what's already there, and expand from a proven base rather than a leap of faith.
1
Analyze the Bills, Target the Waste
Deployment starts with your actual utility bills — total consumption, the demand component, any power-factor charges — to identify the biggest waste sources and size the opportunity per stream. This grounds the business case in your real tariff and consumption before a single sensor goes in.
2
Integrate Existing Infrastructure
The hardware-agnostic platform connects to existing meters, sub-meters, IoT sensors, and building systems through standard protocols, adding sub-meters only where coverage is thin — so there's no costly equipment replacement and data starts flowing quickly.
3
Capture the Fast-Payback Streams First
Early effort targets the streams with the quickest return — demand-charge peak management, power-factor correction, and the largest consumption leaks — so savings start within weeks and the system begins paying for itself inside the first fiscal cycle.
4
Track Verified Savings, Then Scale
Savings from each fix are measured against baseline so the ROI is proven, not assumed, building the documented case to expand coverage across more assets and sites — scaling from a demonstrated return rather than a projection.
What Changes for the Bottom Line
Industrial energy monitoring turns the plant's largest hidden cost into a managed, attributable, continuously optimized line item — with a return that shows up across the P&L, not just the utility bill.
01
10–30% Off a Major OpEx Line
Attacking consumption waste, demand charges, and power-factor penalties together takes double-digit percentages off one of the largest controllable operating costs — a recurring saving that grows in value as energy prices climb rather than a one-time cut.
02
A Payback the CFO Approves
With payback typically inside 6 to 18 months, savings starting within weeks, and no costly equipment replacement, the investment clears the hurdle rate comfortably and de-risks the decision — the fast, low-risk return that gets a project funded.
03
Maintenance Savings Stacked On Top
Energy anomalies that double as failure warnings cut maintenance cost 20 to 40 percent and remove the emergency-repair multiplier, so the five-year ROI reflects two compounding streams on one investment — energy and reliability improving together.
04
A Widening Competitive Edge
Monitored plants absorb rising electricity prices through efficiency while unmonitored competitors simply pay them, turning energy visibility into a durable cost advantage that compounds every quarter the price gap widens.
Frequently Asked Questions
The questions plant leaders and finance teams ask most often when building the business case for energy monitoring.
What payback period should we realistically expect?
For a properly implemented system, 6 to 18 months is typical, and many manufacturing facilities recover the full investment within the same fiscal year. The reason it's so fast is that savings begin within weeks of going live rather than after a long capital build, and they're drawn from a large recurring base — energy is 15 to 25 percent of operating cost, so even a 10 to 30 percent reduction is substantial in absolute terms. The exact payback depends on your current consumption, facility size, equipment mix, existing efficiency, and local utility rates, especially your demand and power-factor charges. Facilities in demand-heavy tariff territories often see the quickest returns because the demand-charge stream is large and fast to capture. The most reliable way to pin down your number is to analyze your actual utility bills, which is exactly what a scoping session does. To model your payback,
book a demo.
Why can't our annual energy audit find these savings?
Because an audit is a retrospective snapshot, and the waste it's looking for is continuous and changing. A consultant walks through once, analyzes last quarter's bills, and produces a report whose recommendations are already outdated by the time budget allows action — meanwhile a compressed-air system can leak a third of its output for months, HVAC runs against open docks, and motors draw power at inefficient loads that nobody sees. The structural problem is the same one that makes the monthly bill inadequate: both are lagging, aggregate instruments, and waste happens at the machine and the minute. Real-time monitoring is continuous rather than periodic, machine-level rather than plant-level, and it flags an anomaly in seconds so it's fixed while it's still small. An audit tells you roughly where you were last year; monitoring tells you exactly what's happening now and what to do about it, which is why it captures savings the audit consistently misses.
We already try to cut kWh. What are we missing?
Most likely the two streams that don't show up on a simple kWh reading: demand charges and power-factor penalties. Demand is billed on your single highest short interval — often one 15-minute window — and in some markets that demand component is 30 to 50 percent of the total bill, so a single uncoordinated startup can set the charge for the whole month, and a ratchet clause can carry it forward. Real-time demand visibility enables peak shaving that cuts that component 15 to 25 percent, a saving pure kWh reduction never captures. Power factor is the other: inductive loads like motors and VFDs drag power factor below the ~0.95 threshold most utilities penalize, a charge that can run into tens of thousands a year and also inflates the kVA your demand is billed on. Monitoring surfaces both, so you can shave peaks and correct power factor where it pays. If you're only chasing total kilowatt-hours, these fast, large returns are exactly what you're leaving on the table.
How does this improve the ROI beyond just energy savings?
Through maintenance. A machine drawing above its energy baseline is frequently a machine that's degrading, so the same anomaly detection that cuts your energy bill also gives weeks of advance warning on developing equipment faults. That enables a shift from calendar to condition-based maintenance, which typically reduces total maintenance cost by 20 to 40 percent and extends equipment life by 15 to 25 percent, and it removes the emergency-repair multiplier — unplanned repairs run two to three times the cost of planned work once overtime, expedited parts, and secondary damage are counted. Because energy and maintenance run on one platform, a single investment protects two of the plant's largest controllable costs at once. This is why the strongest business cases account for both streams: counting only energy savings understates the return, while the full five-year ROI accounting for energy and maintenance together consistently exceeds several hundred percent across documented industrial deployments. The two returns compound on the same spend.
Do we need to replace equipment or make a big capital investment?
No — the platform is hardware-agnostic and integrates with your existing infrastructure, so there's no costly equipment replacement, no construction, and minimal disruption. It connects to the meters, sub-meters, IoT sensors, and building systems you already have through standard protocols, and sub-meters are added only where coverage is genuinely thin to reach machine-level resolution on the assets that matter. Data starts flowing quickly and savings begin within weeks rather than after a long build, which is a large part of why the payback is so fast and the risk so low. This low-disruption, integrate-what-you-have approach is deliberate: a working plant can't be re-instrumented from scratch, and the business case shouldn't depend on a heavy upfront capital project. You start on the highest-return streams, prove the savings against baseline, and scale from a demonstrated return. Contact
iFactory support to scope a deployment for your facility.
SEE THE WASTE · SIZE THE SAVING · PROVE THE PAYBACK
Turn Your Biggest Hidden Cost Into Your Fastest-Payback Investment.
Attack consumption waste, demand charges, and power-factor penalties with real-time, machine-level energy cost analytics — 10 to 30 percent off a major OpEx line, payback typically inside 6 to 18 months, and maintenance savings stacked on top for a five-year ROI in the hundreds of percent. Hardware-agnostic, low-risk, and proven against baseline before you scale.