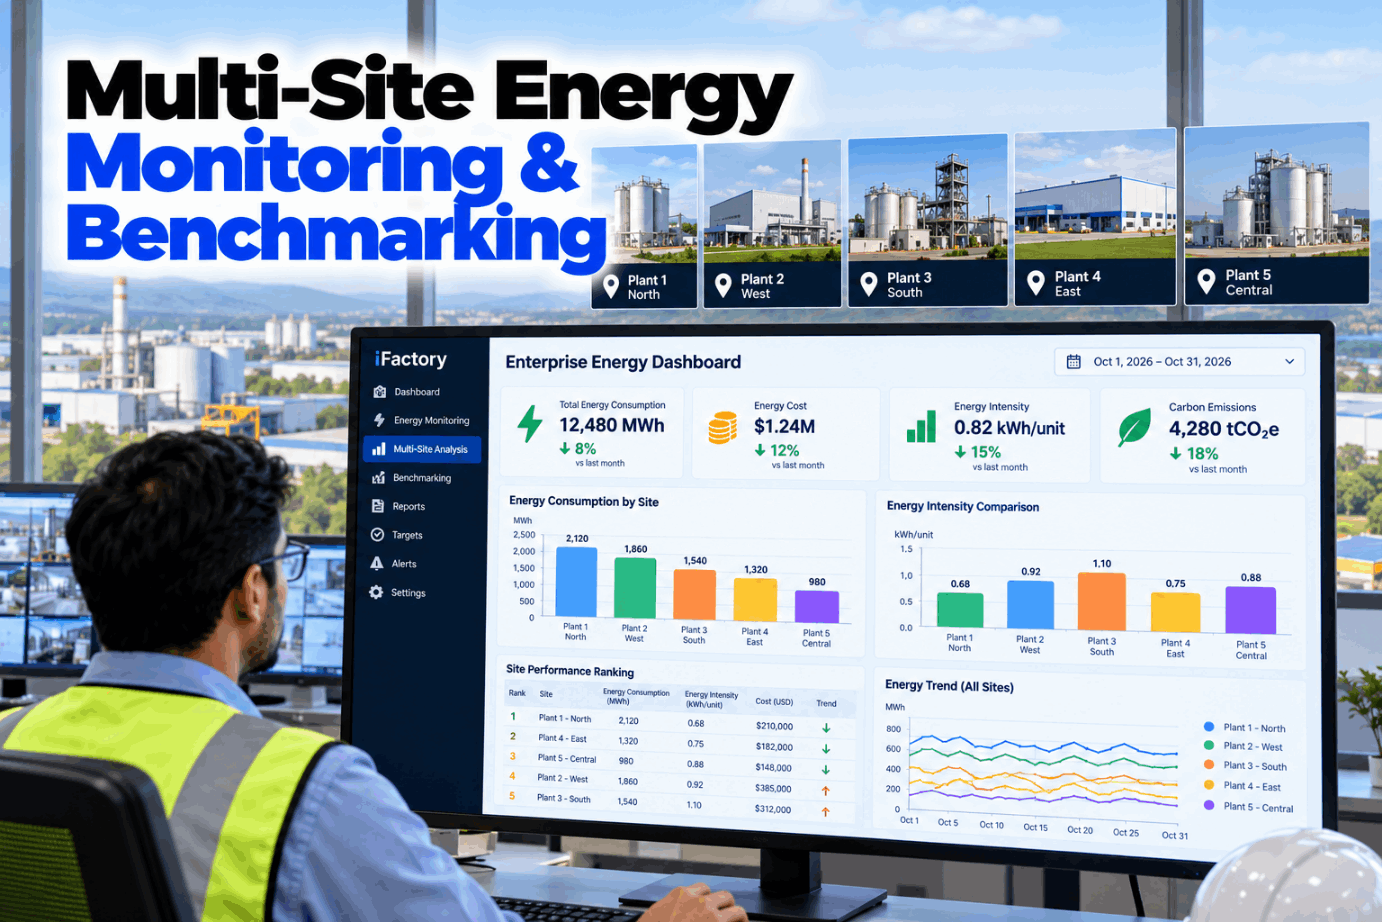
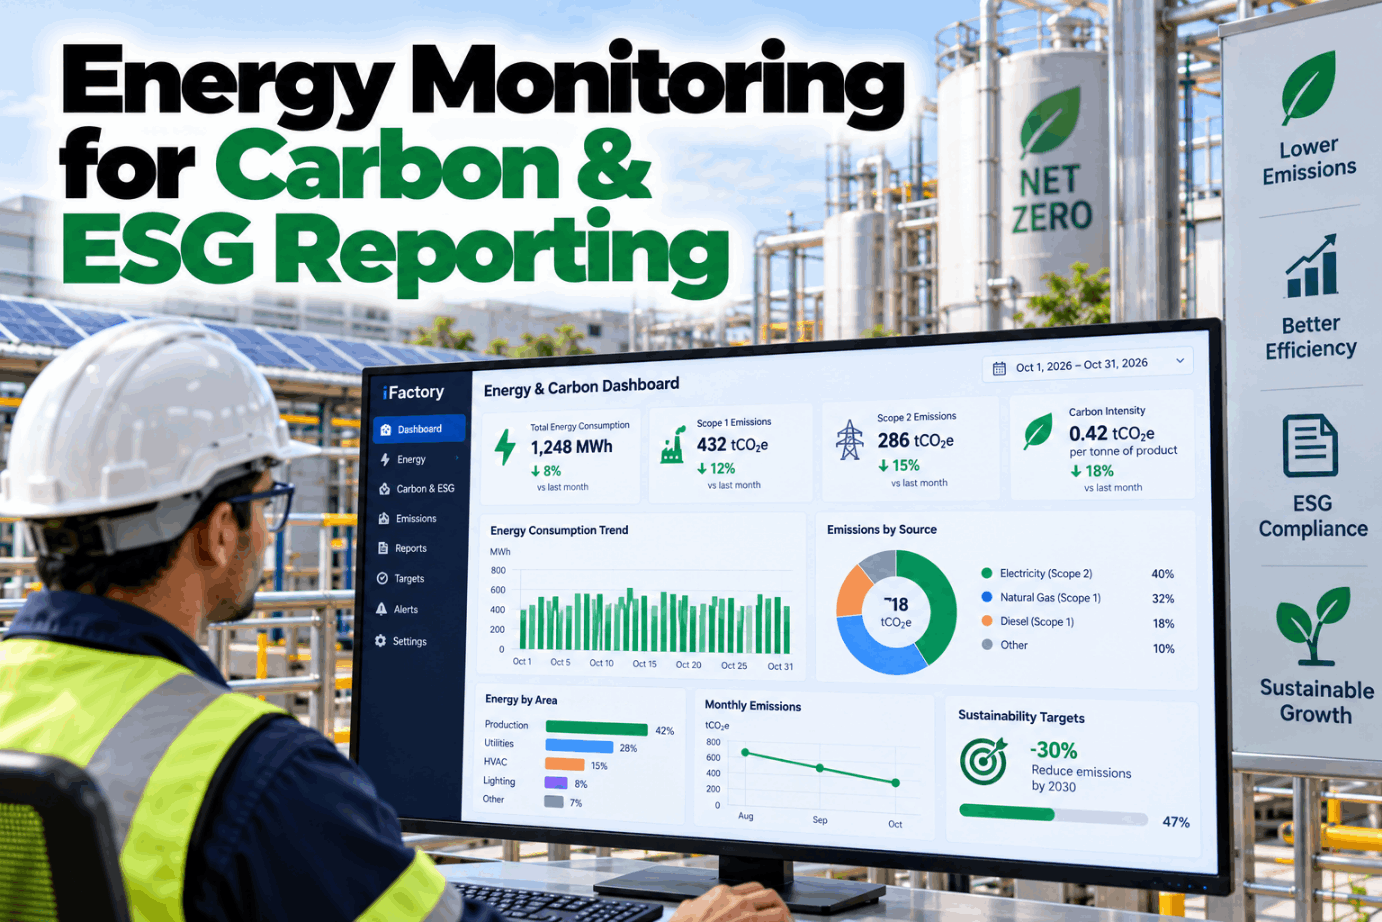
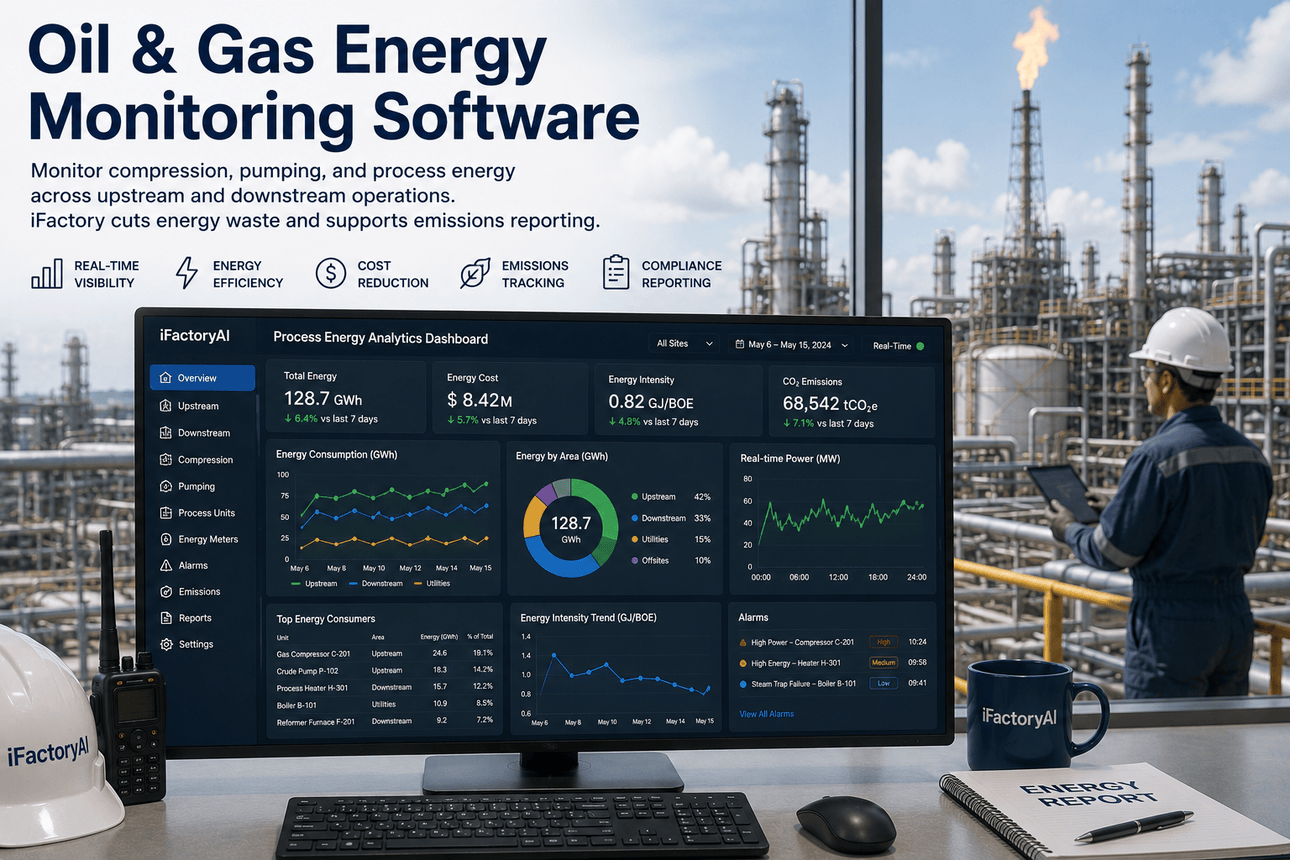
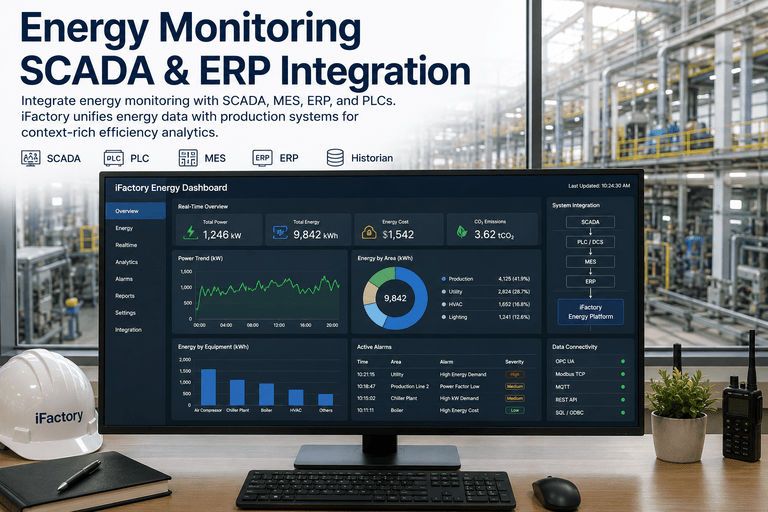
When an energy director asks which plant is the most efficient, the first answer usually comes from a ranking of total kWh. That ranking almost always points at the smallest site, not the best one. Multi-site energy monitoring is only useful when every plant reports on the same units, the same boundaries and the same normalised KPIs, so sites can be compared fairly. See an enterprise view across your own plants in a short multi-site energy demo.
ENTERPRISE ENERGY DASHBOARD · MULTI-SITE
Rank Every Plant on Energy Intensity, Not Raw kWh
iFactory's Enterprise Energy Dashboard brings meter, utility and production data from every site into one view. It converts units, aligns time zones, normalises for output, mix and weather, and ranks plants on KPIs everyone has agreed.
Site ranking · Q3 · 4 plantsPer tonne
Illustrative values · kWh per tonne of output
1Plant C · Ohio250 kWh/t
2Plant A · Texas300 kWh/t
3Plant B · Alberta400 kWh/t
4Plant D · California500 kWh/t
4 time zones alignedkWh, GJ, therms unified1 site late
WHY RAW KWH RANKINGS MISLEAD
Six Reasons the Biggest Number Is Not the Worst Plant
Total energy use mostly measures how big a site is and how busy it was. A large plant running three shifts will always use more than a small one running two, even if it uses far less per unit. Comparing totals rewards the smallest site and hides the real gaps. Talk through your own site list with our support team.
01
VolumeMore output means more energy, whatever the efficiency02
Product mixA plant making heavier or more processed goods needs more energy per tonne03
WeatherHeating in a cold climate and cooling in a hot one change the base load04
BoundaryOne site includes its warehouse or wastewater plant, another does not05
Fuel mixGas-fired and all-electric sites look different in kWh unless every carrier is converted06
HoursShift patterns and shutdown weeks change the total
ENERGY INTENSITY BENCHMARKING
Same Four Plants, Opposite Rankings
The illustration below uses four plants making the same type of product. Ranked on total energy, the smallest plant looks best. Divide by output and the order reverses: the smallest plant is the least efficient and the largest is second best. All numbers are assumed for illustration. Run the same test on your sites in a benchmarking session.
Ranked by total energyMWh per year, lower first
Plant D · 12,000 t6,000
Plant B · 22,500 t9,000
Plant C · 48,000 t12,000
Plant A · 60,000 t18,000
Ranked by intensitykWh per tonne, lower first
Plant C · 12,000,000 ÷ 48,000250
Plant A · 18,000,000 ÷ 60,000300
Plant B · 9,000,000 ÷ 22,500400
Plant D · 6,000,000 ÷ 12,000500
The fair question to ask
Plant D uses a third of Plant A's energy but twice as much as Plant C per tonne (500 against 250). That gap, not the total, is where the improvement work starts.
ENERGY PERFORMANCE BENCHMARKING
Normalisation Methods and When Each One Fits
Dividing by output is the first step, not the last. Plants with a large fixed base load, a weather-driven HVAC load or a changing product mix need more than a simple ratio. Pick the simplest method that explains most of the variation at each site, and use the same method for sites you compare. Choose methods for each site with our energy engineers.
MULTI-PLANT ENERGY
Adjusting for Product Mix, Worked Through
Plant B ranked third on simple intensity, but it makes a heavier product mix than the others. A mix index compares its actual energy with what the company's reference intensities would predict for that mix. The reference values are assumed for this illustration. Model your own product families in a mix modelling session.
Product X15,000 t × 350 kWh/t reference = 5,250 MWh expected
Product Y7,500 t × 600 kWh/t reference = 4,500 MWh expected
Expected for Plant B's mix5,250 + 4,500 = 9,750 MWh
Actual energy9,000 MWh
Mix index9,000 ÷ 9,750 = 0.92, about 8% better than reference
An index below 1.0 means the plant used less energy than expected for what it made. Indexes compare fairly across plants with different mixes.
One Enterprise Energy Dashboard, One Set of Rules
iFactory applies the same KPI definitions, units and normalisation to every site, so a ranking means the same thing in every plant review. Site teams see where they stand and why.
Group energy manager and iFactory
Energy managerPlant B is third on kWh per tonne. Is it really that far behind?
iFactoryNo. It makes a heavier product mix. Its mix index is 0.92, so it used about 8% less energy than expected for what it made.
Energy managerThen which site needs attention first?
iFactoryPlant D. It is last on both measures, and its compressed air use per tonne is the highest in the group. A leak survey is worth planning.
ISO 50006 BASELINES AND ENPIS
Baselines That Survive Change
ISO 50006 explains how to build energy performance indicators (EnPIs) and energy baselines (EnBs) that support ISO 50001. It separates relevant variables, which change routinely and drive energy use, from static factors, which rarely change but matter when they do. Getting this split right is what makes year-on-year comparisons hold up. Review your baselines with our ISO 50001 team.
EnPI
Four types of indicatorA measured energy value, a ratio of measured values, a statistical model or an engineering model
EnB
The reference periodA representative period, often 12 months, against which EnPI values are compared
RV
Relevant variablesOutput, product mix, degree days, operating hours. Used for routine normalisation
SF
Static factorsFloor area, a new line, outsourced production. A major change can trigger a baseline revision under ISO 50001
PORTFOLIO ENERGY MONITORING
External Benchmarks Worth Knowing
Internal rankings show the best plant in your group. External programmes show how that plant compares with the wider industry. In the US, three programmes cover most cases, and each one fits a different kind of site. Find which ones fit your portfolio in an enterprise review.
Buildings
ENERGY STAR Portfolio ManagerEPA's free tool for buildings. It tracks energy use intensity and gives a 1 to 100 score for eligible types, such as offices and warehouses. It is not built for production processes.Plants
ENERGY STAR plant EPIsEnergy Performance Indicators score a plant from 1 to 100 against similar US plants. 50 is the median, and 75 or more may qualify for certification.Programmes
DOE Better PlantsPartners pledge a long-term goal, typically to cut energy intensity by 25% over 10 years across US operations, and track progress with DOE.
Sectors with an ENERGY STAR plant EPI (21 plant types)
Aluminium, iron and integrated steel plants. Automobile assembly, engine and transmission plants. Cement, asphalt paving, container glass and flat glass. Bread and roll, cookie and cracker bakeries, fluid milk, juice, frozen fried potato, wet corn milling and distilled spirits. Pharmaceuticals, nitrogenous fertiliser, pulp, and integrated paper and paperboard.
ENERGY DATA AGGREGATION
Five Problems to Solve Before Any Ranking
Most multi-site energy projects stall here, not on the analytics. Each plant was set up by different people, with different meters, systems and habits. A ranking built on mixed units or mismatched periods is worse than none, because people act on it. Agree the rules below first, then automate them. Plan your data rules with our integration team.
Different metersModbus, BACnet, OPC UA, pulse outputs and monthly invoicesRule: one connector per source, with the data source tagged on every reading
Different unitskWh, MWh, GJ, therms, MMBtu, m³ of gas, pounds of steamRule: convert all carriers to one energy unit with stated conversion factors
Time zonesSites in four zones, with different daylight saving datesRule: store in UTC, report in each site's local day
Tariffs and billsBills that run 28 to 33 days and rarely match calendar monthsRule: use interval meter data for months, invoices to reconcile
Gaps and estimatesMeters offline, late invoices, estimated readsRule: flag every estimate and show data completeness next to each KPI
ENERGY KPI STANDARDIZATION
A KPI Dictionary Every Site Signs Up To
A KPI is only standard when it is written down and owned. Each entry below should be agreed once, approved at group level and versioned, so any change is visible in later reports. Get a blank dictionary in a KPI setup session.
KPI nameSite energy intensity
FormulaAll carriers in kWh ÷ good output
UnitkWh per tonne
BoundaryProduction halls and utilities, no offices
Normalised forMix index and degree days
Data sourceInterval meters, ERP output
OwnerSite energy lead
Versionv2.1, approved by energy council
KPI GOVERNANCE
Who Decides, Who Reviews, What Changes
Governance keeps a dashboard trusted after the launch excitement fades. The cycle below is a common pattern for a group energy council. Shape it to your own structure with our support team.
Define
Group energy lead drafts KPIs and boundariesApprove
Energy council signs off each versionPublish
Monthly rankings with data completeness shownReview
Quarterly look at outliers and site feedbackRevise
Baseline reset only for agreed triggers, logged
SITE ENERGY RANKING EXAMPLES
How Normalisation Changes the Picture in Four Sectors
These are illustrations of common patterns, not case studies or measured results. Walk through your own sector in a sector session.
Food and beverage
Cold climate, cold storesA northern plant looks worse on raw kWh in winter. Degree days show its refrigeration is in fact efficient.Automotive
Paint shop boundaryOne assembly plant paints bodies, another buys them painted. Without a shared boundary, the ranking is meaningless.Pharma
Low volume, high base loadA launch site with few batches has high intensity driven by cleanroom HVAC, not waste.Steel and metals
Route and mixAn EAF mill and a rolling-only site cannot share one kWh per tonne without splitting by process.
COST AND ROI
Sizing the Value of Closing a Gap
The value of benchmarking comes from acting on the gaps it exposes. You can size one gap with your own figures. The worksheet uses assumed inputs only, and the savings depend on the projects you carry out. Build your own case with our energy analysts.
Plant D output12,000 t per year, assumed
Current intensity500 kWh per t, assumed
Target after projects400 kWh per t, assumed
Energy price$0.10 per kWh, assumed
Annual value if target is met12,000 × 100 kWh = 1,200,000 kWh × $0.10 = $120,000
TURNKEY AI DEPLOYMENT
Site Connectors, Enterprise Dashboard and AI Server in One Package
iFactory delivers the Enterprise Energy Dashboard as a turnkey bundle. A pre-configured NVIDIA AI server ships racked and ready, with meter, historian and ERP connectors and the normalisation models pre-loaded. You rack it, plug in power and Ethernet, and the AI is live. To scope it for your sites, request a turnkey quote.
What's Included
- Pre-configured NVIDIA AI server, racked and ready
- Connectors for meters, BMS, historians and ERP output
- Unit conversion and UTC time alignment for every site
- Normalisation by output, mix, degree days and hours
- Versioned KPI dictionary and approval workflow
- Site rankings with data completeness scores
- 24×7 remote monitoring of data feeds and hardware
Live in 6–12 weeks
Wk 1–4
Agree and Connect
KPI dictionary drafted, boundaries agreed, first sites connected.
Wk 5–8
Normalise and Test
Baselines built, models checked against 12 months of history.
Wk 9–12
Rank and Review
Rankings published, energy council running, site teams trained.
HOW iFACTORY FITS
Energy Benchmarking Software Built for Many Plants
The Enterprise Energy Dashboard is built for groups that want fair, trusted comparisons across sites. Our support team can plan a pilot.
1
Aggregates every site. Meters, invoices and output data from each plant in one place.
2
Normalises fairly. Output, product mix, weather and hours applied the same way everywhere.
3
Ranks on agreed KPIs. Versioned definitions, owners and approvals for each indicator.
4
Points to the gap. Drill from group ranking to site, line and meter.
1000+
Industrial clients running iFactory
99.9%
Platform uptime across connected sites
6-12 wks
From racked server to live site rankings
FREQUENTLY ASKED QUESTIONS
What Energy and Plant Leaders Ask About Multi-Site Benchmarking
Why not just compare total kWh across plants?
Totals mainly reflect size and activity. A large, busy plant will always use more than a small one. Dividing by output, then adjusting for mix and weather, shows which sites actually use energy well.
What is the right energy intensity metric?
Use the output measure that best drives energy at each site type: kWh per tonne, per case, per vehicle or per batch for production, and kWh per m² for warehouses and offices. Compare only sites that share the same metric and boundary.
Can ENERGY STAR Portfolio Manager benchmark our factories?
Portfolio Manager is designed for buildings, so it suits offices, warehouses and distribution centres. For production plants, ENERGY STAR offers plant Energy Performance Indicators in 21 plant types, from automobile assembly to fluid milk processing.
How does ISO 50006 help with multi-site comparisons?
It gives a shared method for building EnPIs and baselines, including how to handle relevant variables and static factors. Using it at every site means indicators are built the same way, which makes comparisons and trends credible.
How do you handle sites in different time zones and on different tariffs?
Data is stored in UTC and reported by each site's local day. Monthly figures come from interval meters, and invoices are used to reconcile, because billing periods rarely match calendar months.
How do we start?
Pick three or four comparable plants, agree one KPI and boundary, connect their meters and output data and build a 12-month baseline. Add sites once the first ranking is trusted. Our
support team can plan that first step with you.
Fair Energy Rankings Across Every Plant
Bring all your sites into one dashboard, normalise them the same way and rank them on KPIs everyone has agreed. The system is delivered turnkey and goes live in 6 to 12 weeks.
Example quarterly review · 4 plants
Sites connected4 of 4, 1 late feed flagged
Primary KPIkWh per tonne, mix-adjusted
Best and worstPlant C and Plant D
Next actionAir survey at Plant D
Every ranking traceable to its data