A standalone energy meter tells you a machine drew 40 kWh. It cannot tell you whether that was a good number or a terrible one — because it has no idea how many units the machine made, what it was running, or whether it was sitting idle the whole time. That missing context is the whole problem. Most plants already have the metering hardware; what they lack is the integration that ties energy data to SCADA, MES, ERP, and the PLCs on the floor. Close that gap and kWh becomes kWh-per-unit, cost-per-batch, and idle-waste-during-downtime. iFactory's energy monitoring integration unifies energy with your production systems so a Real-Time Energy Dashboard finally reads in the context that makes it actionable.
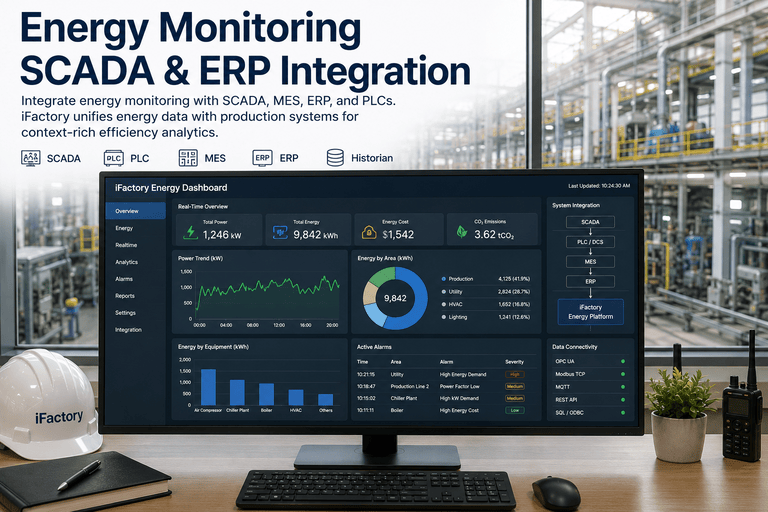
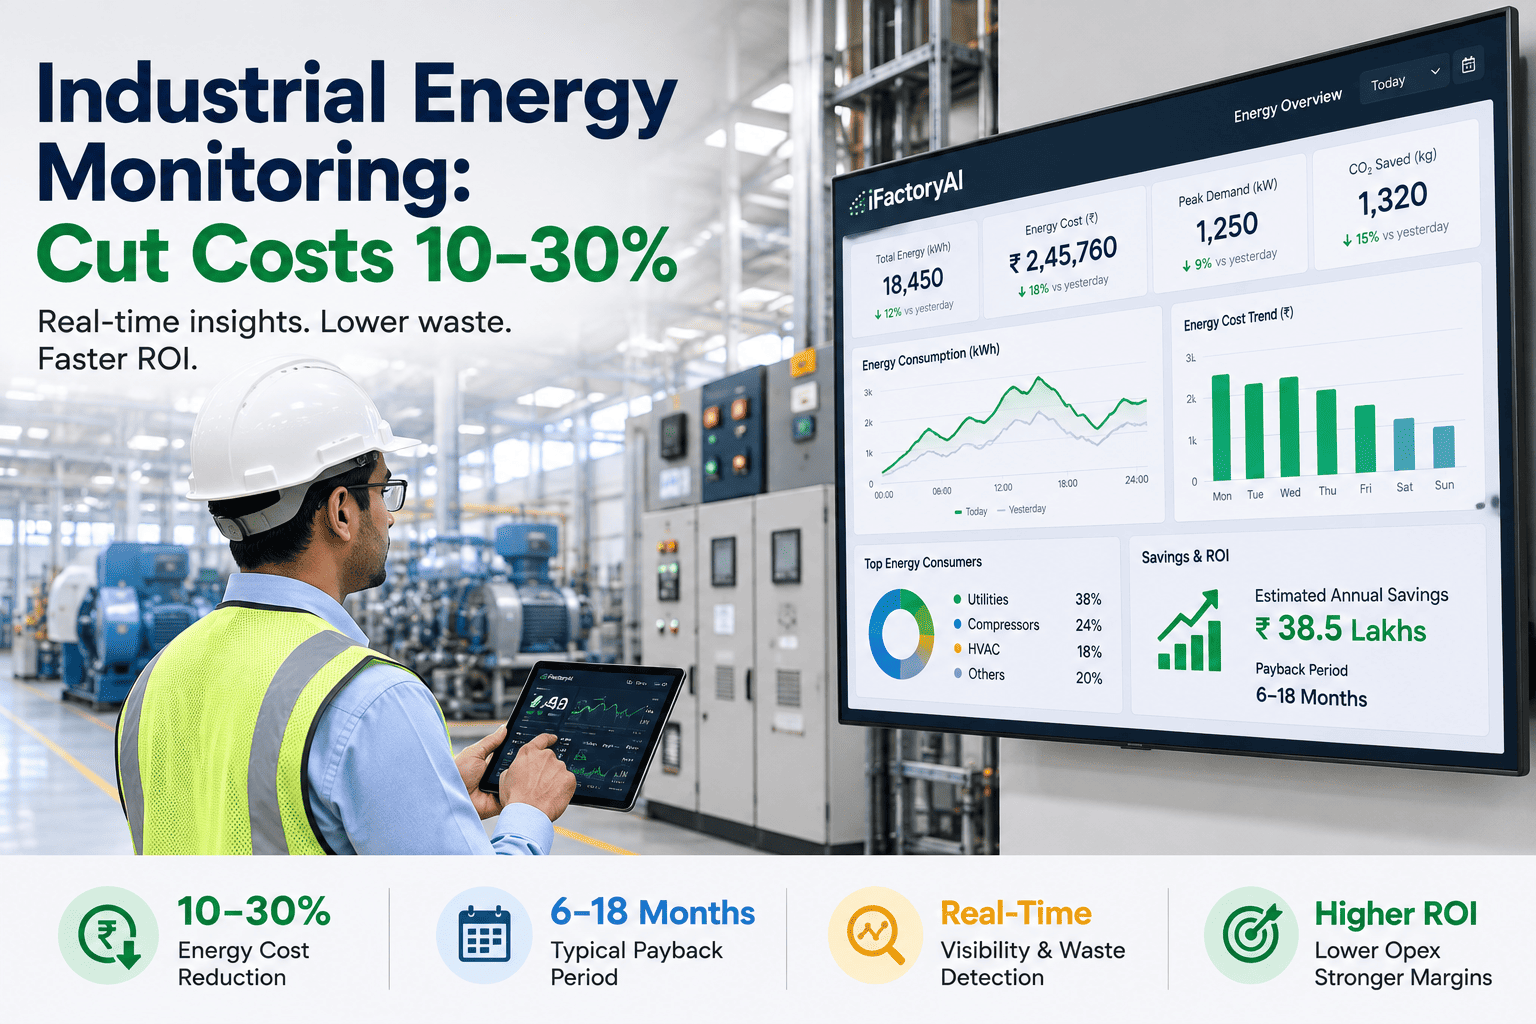
iFactory Real-Time Energy Dashboard
Energy Monitoring, Integrated With SCADA & ERP
Connect energy data to SCADA, MES, ERP and PLCs over OPC UA, Modbus and MQTT — so energy reads in production context and efficiency analytics finally make sense.
kWh/unit
energy intensity, live
OPC UA
Modbus & MQTT ready
Energy Data Without Context Is Just a Number
kWh on its own is a measurement, not an insight. To know whether energy is well spent you have to set it against what the plant was producing at that moment — and that means joining energy to the systems that already hold production reality. Without that join, every energy report is a guess.
Siloed Meters
Metering hardware exists but sits disconnected, so consumption data never meets the production data that explains it.
No Cost Per Unit
Without production counts alongside energy, you can't compute energy per unit or cost per batch — the numbers that matter.
Invisible Idle Waste
Energy burned while a line sits idle looks identical to productive energy until downtime data is layered on top.
Unattributable Cost
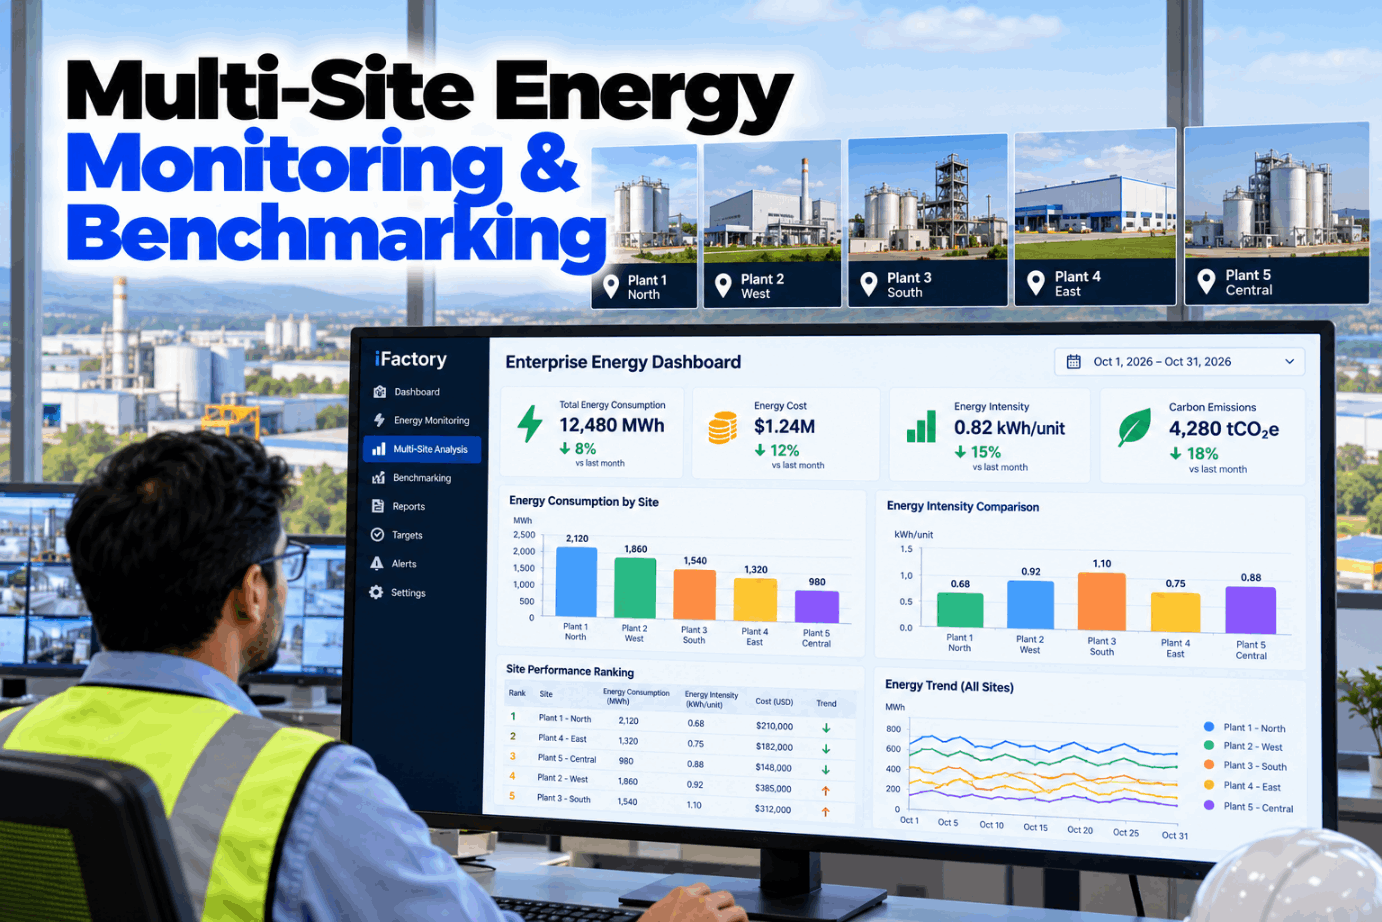
A plant-level utility bill can't be split by line or machine, so no one knows which asset actually drives the spend.
Four Layers, One Energy Picture
The value comes from joining the whole stack — from the PLCs measuring the process to the ERP that books the cost. iFactory connects across all four layers so a single energy view carries the context each one holds.
PLCs & Meters
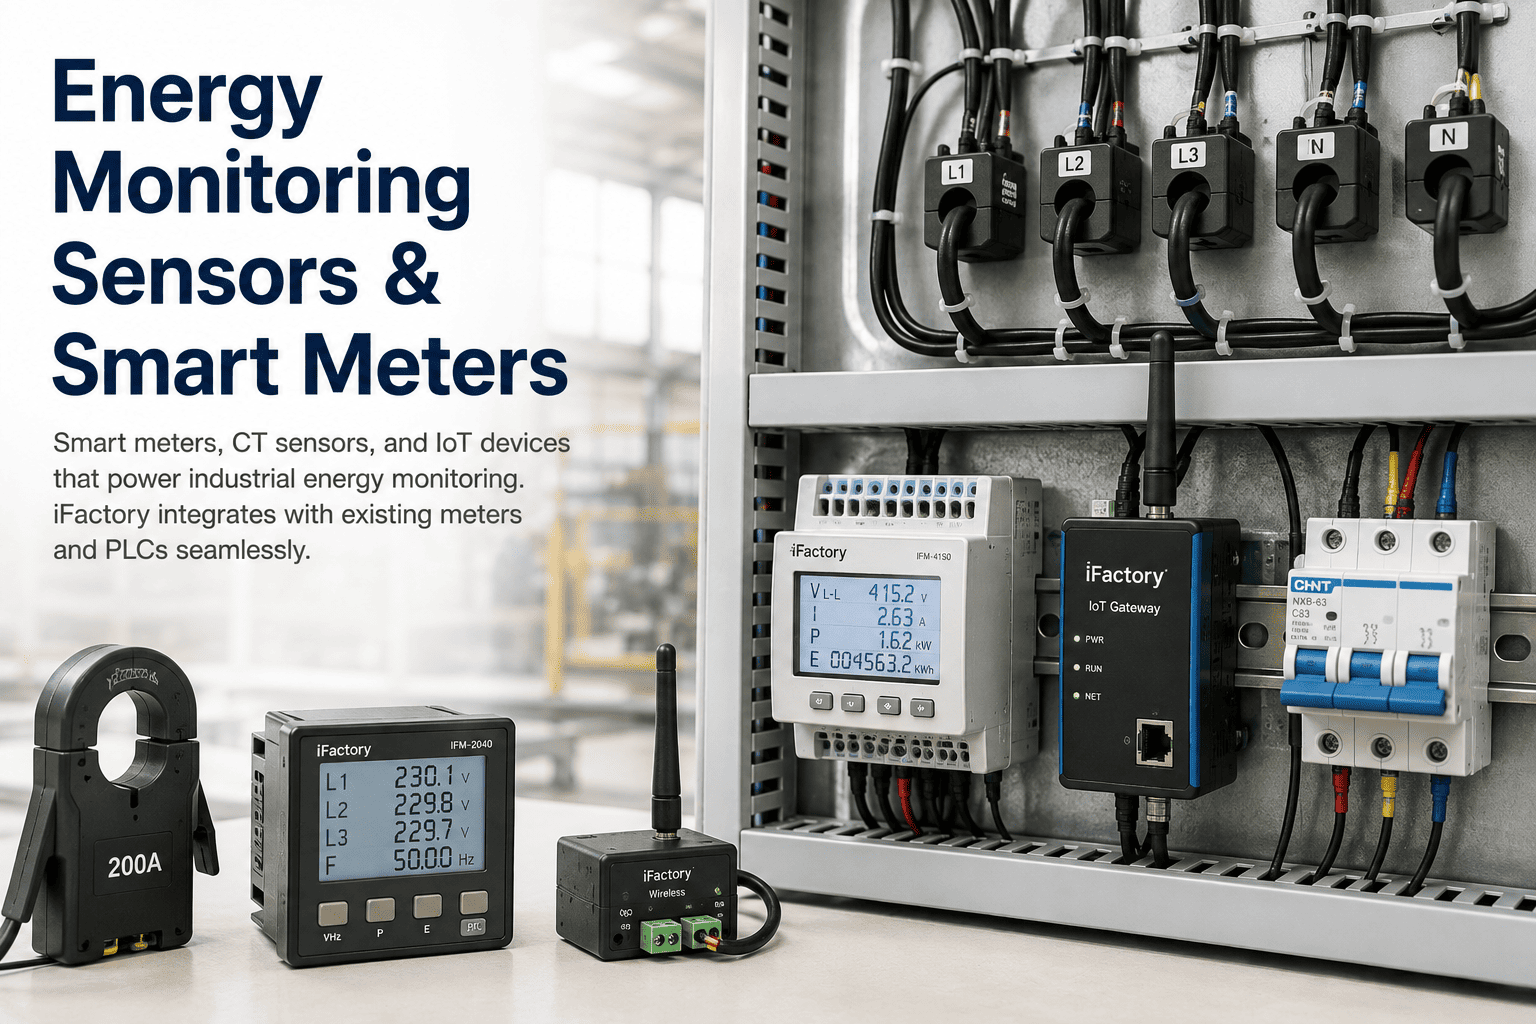
Power meters, relays, and VSDs feed calibrated consumption; PLCs supply machine state, runtime, and process signals.
SCADA
Supervisory data adds real-time operating context — what was running, at what setpoint, when the energy was drawn.
MES
Production counts, batches, and order data turn raw kWh into energy per unit and cost per batch.
ERP
Cost, tariff, and order context let energy be booked against products and rolled into true unit economics.
Want to see your own systems mapped into one energy view? Book a demo and we'll sketch the integration across your stack.
Speaks the Protocols Your Floor Already Speaks
No rip-and-replace. iFactory connects through the open industrial protocols your equipment already uses, and where legacy devices speak only Modbus, a gateway bridges them into a modern, structured data model. The plant keeps its hardware; the data simply starts flowing where it is useful.
OPC UA
The secure, platform-independent backbone that lets PLCs, SCADA, and analytics understand each other without custom one-off links.
Modbus TCP & RTU
The workhorse for power meters and intelligent devices, bridged into the unified model through protocol conversion where needed.
MQTT
Lightweight publish-subscribe messaging for IoT sensors and edge devices feeding consumption data efficiently.
Historians & APIs
Time-series historians and REST APIs connect existing data stores, so logged energy and production history come along too.
How the Energy Data Comes Together
Integration is a flow: capture accurate consumption, normalize the protocols, align it in time with production, and surface it as context-rich analytics. Each step is what turns scattered signals into a number you can act on.
1
Capture at the Source
Dedicated power meters and VSDs provide calibrated, accurate consumption — the foundation analytics depend on.
2
Normalize Protocols
Modbus, OPC UA, and MQTT feeds are mapped into one structured model, with gateways bridging legacy devices.
3
Align in Time
Timestamps are synced across energy, SCADA, and MES so consumption lines up exactly with what production was doing.
4
Surface in Context
The dashboard shows energy per unit, cost per batch, and idle waste — kWh finally read against production.
Curious how clean your timestamp alignment is today? Talk to our integration team and we'll review your data flow.
From kWh to Cost Per Unit
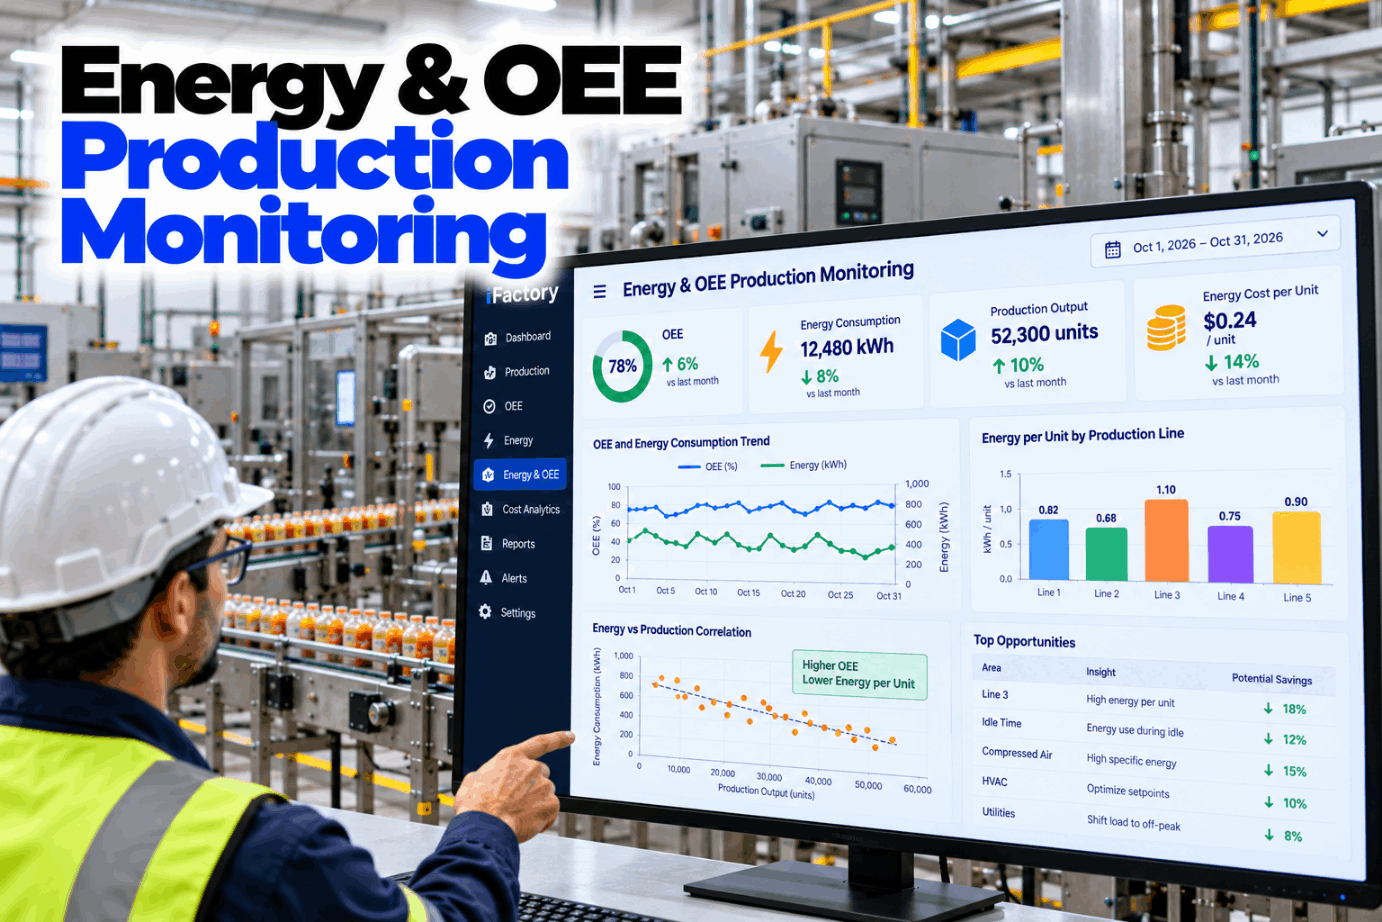
Once energy and production share one view, the metrics that drive decisions appear. You stop looking at total consumption and start seeing energy intensity by line, the cost behind every batch, and the quiet drain of equipment running while nothing is being made.
Energy Intensity
kWh normalized against production units, so efficiency is measured per unit made rather than as a raw plant total.
Cost Per Batch
Energy booked against orders and tariffs reveals the true energy cost of each batch and product.
Idle Energy Waste
Downtime data exposes consumption when nothing is being produced — often the fastest savings to capture.
Cost Allocation
Consumption attributed to the specific line or machine driving it, so accountability and targeting become possible.
One Platform, More Than Energy
Because the same integration layer feeds the broader iFactory platform, energy data does not sit in its own corner. An energy spike can trigger a maintenance work order; consumption joins OEE and quality on the same production timeline — making energy one more lens on the same operational truth.
Links to Maintenance
An abnormal energy draw can flag a degrading motor and raise a work order, turning a spike into a prevented failure.
Joins OEE & Quality
Energy sits on the same production timeline as output and quality, so trade-offs are visible in one place.
One Data Model
The structured model that unifies energy is the same one carrying production context, avoiding yet another silo.
Runs On-Prem
The integration runs on a pre-configured edge server inside your firewall, with read-only links and no external egress.
Want energy on the same timeline as your OEE and maintenance? Book a demo and see the unified view.
What Integrated Energy Monitoring Delivers
Tying energy to your production systems converts directly into visibility you can act on, savings you can target, and context no standalone meter provides. These reflect outcomes manufacturers report after integrating energy monitoring with SCADA, MES, and ERP.
Per-unit
Energy visibility
kWh measured against output, not as a raw plant total
Targeted
Cost reduction
savings aimed at the line or machine actually driving spend
Idle
Waste exposed
consumption during downtime made visible and recoverable
One
Unified view
energy, production, and quality on a single timeline
Curious how much your idle energy alone is costing? Talk to our energy team and benchmark it against an integrated view.
Frequently Asked Questions
Why integrate energy data with SCADA, MES, and ERP at all?
Because energy without production context is just a number. A meter reports kWh, but only by joining it to SCADA operating state, MES production counts, and ERP cost data can you compute energy per unit, cost per batch, and idle waste. Most plants already have metering hardware and simply lack the integration — closing that gap is what turns consumption data into actionable efficiency insight.
Which protocols and systems does it support?
The open industrial protocols your floor already uses: OPC UA as the secure backbone, Modbus TCP and RTU for power meters and devices, and MQTT for IoT and edge sensors, plus time-series historians and REST APIs for existing data stores. It connects to PLCs from major vendors through SCADA, and where legacy devices speak only Modbus, a gateway bridges them into a unified, structured data model.
Do we need to replace our existing systems or meters?
No rip-and-replace. The plant keeps its hardware; integration uses the protocols already in place, with protocol-conversion gateways added only where needed to bridge older devices. For accurate measurement you do want dedicated power meters rather than relying on PLC direct measurement, since metering provides calibrated, documented accuracy — but most facilities already have that hardware in place.
How do you make sure energy and production data actually line up?
Time alignment. Timestamps are synchronized across energy, SCADA, and MES so a consumption reading matches exactly what production was doing at that instant. Without that sync, you can't reliably correlate energy with output — which is why aligning the clocks across systems is a core part of the integration, not an afterthought.
Does our data leave the plant?
No. The integration runs on a pre-configured edge server on-premise, inside your firewall, with read-only links to your systems and no external egress required to operate. Energy and production data stay local. The fastest way to see fit is a demo where we map your specific stack — book a slot and bring a list of your PLCs, SCADA, and metering.
Give Your Energy Data Context.
See Energy Unified With Your Production Systems
Bring a list of your PLCs, SCADA, MES, ERP and metering. We'll map the integration across OPC UA, Modbus and MQTT, show energy per unit and cost per batch on a Real-Time Energy Dashboard, and surface the idle waste you can't see today — all on an on-prem edge server inside your firewall.
On-prem
inside your firewall