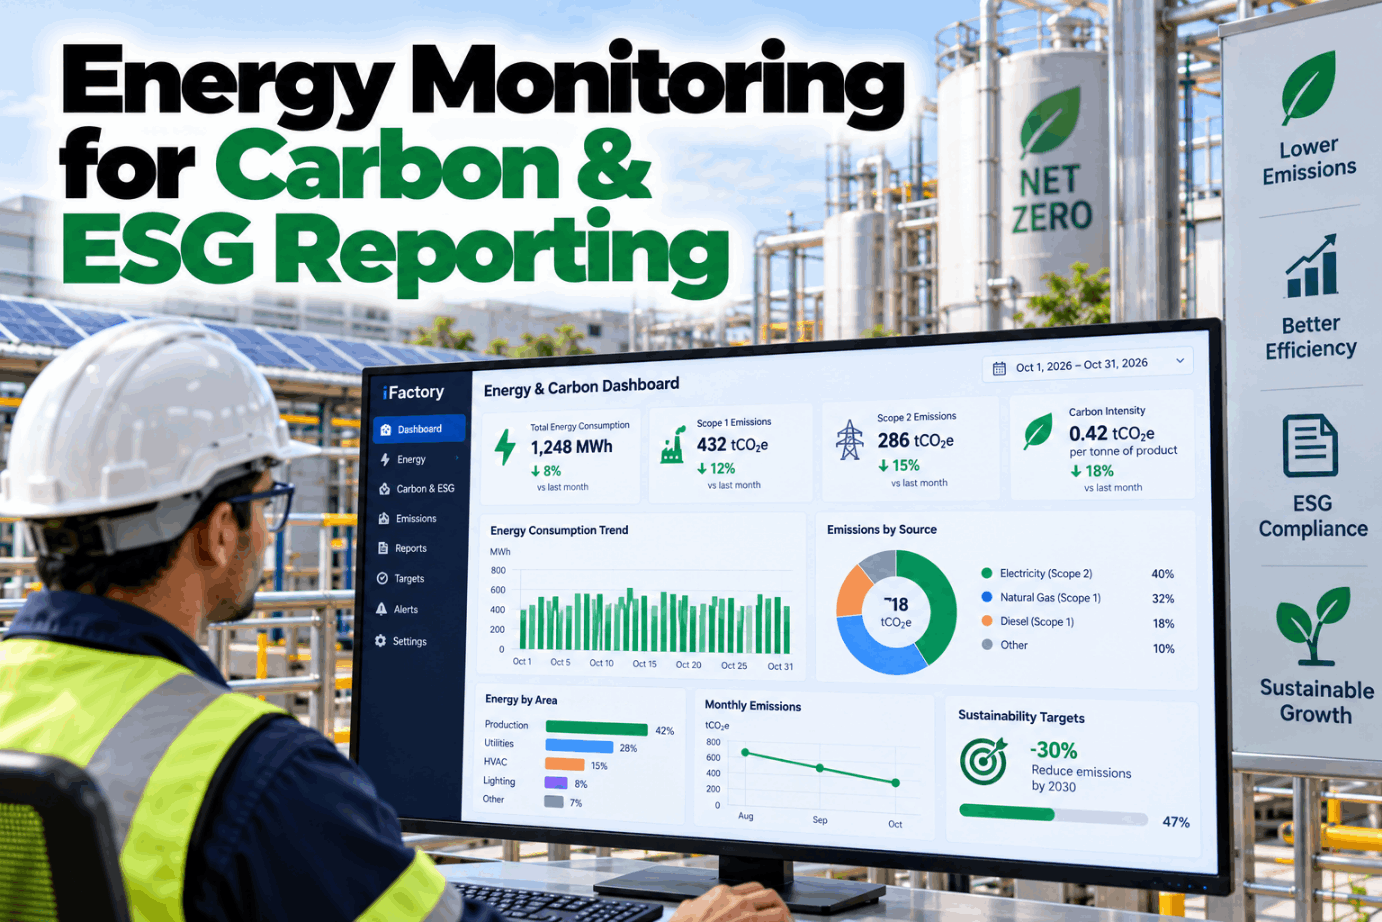
Energy Monitoring for Carbon & ESG Reporting

By Josh Brook on October 24, 2026

energy-monitoring-carbon-esg-tracking

Most plants already measure the energy that drives their carbon footprint, but turning it into a Scope 1 and 2 number an auditor will accept still means rebuilding the same workbook every quarter from meters, invoices and factor spreadsheets. Energy monitoring for carbon and ESG reporting closes that gap by calculating emissions from live consumption, with every factor and every reading traceable. See how it works on your own sites in a short carbon dashboard demo.

CARBON & ESG DASHBOARD · SCOPE 1 AND 2

Turn Every Meter Reading Into Audit-Ready Scope 1 and 2 Emissions

iFactory's Carbon & ESG Dashboard links real-time electricity, gas and fuel data to versioned emission factors. It reports location-based and market-based Scope 2 side by side, tracks carbon intensity per unit and keeps the evidence trail an assurance provider will ask for.

Plant 3 · October to dateLive
Illustrative values · factors logged with source and version
Scope 1 · gas boilers and ovens212.4 t CO2e
Scope 2 · location-based301.8 t CO2e
Scope 2 · market-based188.6 t CO2e
Carbon intensity78.2 kg CO2e per t
eGRID2023EPA Hub fuels2 meter gaps flagged
Month locks for review on day 5 · sign-off by site energy lead
ENERGY CARBON ACCOUNTING

Where Plant Energy Lands in Scope 1 and Scope 2

The GHG Protocol Corporate Standard splits emissions by who controls the source. Fuel burned on site is Scope 1. Electricity, steam, heat and cooling bought from someone else is Scope 2. The upstream emissions from producing and delivering those fuels sit in Scope 3, which is outside this page. For most manufacturers, energy makes up the bulk of Scope 1 and 2, so good energy data is most of the work. Map your own energy sources with our support team.

Scope 1
Fuel you burn on siteNatural gas in boilers, ovens, dryers and furnaces. Diesel in generators, LPG in forklifts, fuel oil in back-up burners.
Scope 2
Energy you buyGrid electricity, plus purchased steam, hot water or chilled water from a utility, a neighbour or an energy park.
Scope 3, category 3
Upstream of the meterExtraction and transport of fuels, and grid losses. Linked to the same energy data, but reported separately.
One meter, two scopes

A gas-fired boiler is Scope 1. Swap it for an electric heat pump and those emissions move to Scope 2, at a level set by your grid. Tracking both scopes from the same energy data shows the real effect of electrification.

SCOPE 2 EMISSIONS TRACKING

Location-Based and Market-Based, Side by Side

The 2015 GHG Protocol Scope 2 Guidance asks companies to report two Scope 2 figures. The location-based method uses the average emission rate of the grid where you consume power. The market-based method uses the contracts you choose, such as supplier rates, renewable certificates and PPAs. Where you have no contract, a residual mix factor applies. Plan dual reporting in a Scope 2 review.

LOCATION-BASED
  • Average grid emission rate for the region, such as an eGRID subregion in the US
  • Same answer for every user on that grid
  • Falls as the grid gets cleaner, even if the plant does nothing
  • Good for comparing sites and tracking real efficiency
MARKET-BASED
  • Supplier-specific rates, certificates and PPAs you hold
  • Residual mix factor for power not covered by a contract
  • Reflects your purchasing choices
  • Must meet quality criteria for each instrument
A revision is in progress

The GHG Protocol consulted on a stricter market-based method from October 2025 to January 2026, including hourly matching and deliverability. In 2026 its board moved towards two market-based methods, with a further consultation slated for Q2 2027. Until a final version is published, the 2015 guidance applies. Storing hourly consumption now keeps both options open.

EMISSION FACTORS

Choosing, Recording and Versioning Your Factors

An emissions figure is only as good as the factor behind it. Factor sets are published on their own cycles, and a new edition can move your total even when consumption stays flat. The UK 2026 conversion factors, for example, cut the grid electricity factor by around 26%. Record which set and version each month used, and recalculate only by decision. Talk factor policy through with our ESG team.

Source
What it covers
Typical use
Points to watch
EPA eGRID
US grid emission rates by subregion and state
Scope 2 location-based, US
Latest edition holds 2023 data. Rates are in lb/MWh, so convert to kg/kWh
EPA GHG Emission Factors Hub
Fuels, mobile sources and default grid factors
Scope 1 fuel combustion
Natural gas is about 53 kg CO2 per MMBtu before CH4 and N2O
DESNZ conversion factors
UK fuels, electricity, transmission losses
UK Scope 1 and 2
Released each year, often in June. Use the set for the reporting year
IEA emission factors
Country-level grid factors worldwide
Sites outside US and UK
Licensed data. Check the terms before publishing figures
Supplier rates and residual mix
Contract-specific emission rates
Scope 2 market-based
Keep the certificate or contract evidence with the number
CARBON FOOTPRINT TRACKING

kWh × Factor = kg CO2e, Worked Through

The core arithmetic is simple. The hard part is doing it the same way every month, for every meter and every site. The example below uses illustrative inputs for one plant over one month. The grid factor of 0.35 kg CO2e per kWh is close to the US national average in eGRID2023, which is about 771 lb per MWh. Check your own numbers with our carbon accounting team.

Electricity, location-based1,200,000 kWh × 0.35 kg = 420,000 kg = 420 t
Electricity, market-based40% covered by certificates at 0 kg. 720,000 kWh × 0.45 kg residual mix = 324 t
Natural gas, Scope 160,000 therms × 5.3 kg = 318,000 kg = 318 t
Scope 1 + 2, location-based318 + 420 = 738 t CO2e
Scope 1 + 2, market-based318 + 324 = 642 t CO2e
Intensity at 9,000 t output738,000 ÷ 9,000 = 82 kg CO2e per t (location-based)

Unit check: 771 lb per MWh ÷ 2.2046 lb per kg ÷ 1,000 kWh per MWh ≈ 0.35 kg per kWh. All inputs are assumed and for illustration only.

Ask Why the Number Moved, and Get a Straight Answer

The Carbon & ESG Dashboard explains every change in emissions by its cause: more energy, more output, a different factor set or a new contract. Sustainability and operations teams look at the same figures.

Sustainability lead and iFactory
Sustainability leadPlant 3 Scope 2 is up 3% on September. Did efficiency slip?
iFactoryNo. Electricity rose 3% because output rose 5%. Intensity per tonne fell about 2%, and the factor set is unchanged.
Sustainability leadGood. Flag it in the monthly note.
iFactoryDone. Note added with the output data attached.
ESG COMPLIANCE ENERGY

Reporting Regimes and Where They Stand, October 2026

Several regimes ask for the same Scope 1 and 2 data, but their scope and timing have shifted a lot since 2025. The summary below reflects public sources as of October 2026. Thresholds and dates can change, so confirm your own obligations with legal advisers. Review which regimes apply to your group with our support team.

Regime
Who it reaches
Status
Energy and GHG ask
CSRD and ESRS E1
EU companies with over 1,000 employees and over €450m turnover, after the Omnibus I directive of February 2026
Wave 2 starts with financial year 2027. Revised ESRS adopted July 2026, mandatory from 2027
Energy use and mix, gross Scope 1, 2 and 3. Limited assurance only
California SB 253
US entities with over $1bn revenue doing business in California
First report due 10 Nov 2026
Scope 1 and 2 now, Scope 3 from 2027. No assurance required for 2026 data
California SB 261
US entities with over $500m revenue doing business in California
Enjoined by Ninth Circuit
Climate risk report. CARB is not enforcing while the appeal runs
SEC climate rule
US-listed companies
Stayed, never in effect
SEC stopped defending it in March 2025 and proposed rescission in May 2026
ISSB IFRS S2
Wherever a jurisdiction adopts it
In force since 2024. Targeted amendments apply from 2027
Scope 1, 2 and 3, with location-based Scope 2
CDP
Companies asked by investors or customers
Voluntary yearly cycle, aligned with IFRS S2
Energy use, Scope 1 and 2, targets and intensity
CARBON INTENSITY TRACKING

Intensity per Unit Shows Progress That Totals Hide

A plant that grows output will often see its total emissions rise even while every unit gets cleaner. Intensity metrics divide emissions by a unit that matters to the business, so progress shows up. Pick one intensity per site that matches what it makes, and report totals next to it. Choose the right intensity for each site in a metrics session.

Food and beveragekg CO2e per tonne of finished product, or per 1,000 cases
Steel and metalst CO2e per tonne of liquid steel or shipped product, split by route
Automotivekg CO2e per vehicle built or per body painted
Pharmakg CO2e per batch or per 1,000 units packed
Packaging and paperkg CO2e per tonne or per 1,000 m² produced
Group levelt CO2e per million in revenue, as used in ESRS E1
DATA QUALITY AND AUDITABILITY

Built for Limited Assurance From Day One

Limited assurance is a lighter review than a financial audit, but the assurer still needs to trace a reported figure back to its source. That means meter or invoice data, a stated factor, a calculation method and evidence that someone checked it. Gaps, estimates and manual corrections are fine if they are flagged and explained. Prepare for your first assurance with our ESG specialists.

1CollectMeters, sub-meters and utility invoices for each site
2CheckGaps, spikes and meter versus invoice differences flagged
3Apply factorsSet, version and source stored with each figure
4CalculateScope 1 and both Scope 2 methods, plus intensity
5Lock and signMonth closed, reviewer named, later changes logged
ISO 50001 AND ISO 14064-1

Two ISO Standards Behind Credible Numbers

Neither standard is required by the regimes above, but both give structure that assurers recognise. ISO 50001 manages the energy that drives emissions. ISO 14064-1 sets out how an organisation quantifies and reports its GHG inventory, and ISO 14064-3 covers verification. Learn how the dashboard supports both in a standards walkthrough.

50001
ISO 50001:2018Energy management system with energy reviews, EnPIs and baselines. A 2024 amendment adds climate change considerations
14064
ISO 14064-1:2018Organisation-level GHG inventory, with direct emissions and indirect emissions from imported energy as separate categories
ESG DASHBOARD ENERGY TEMPLATE

Fields Every Monthly Emissions Record Should Hold

Whether you use software or a spreadsheet, each site-month should carry the same fields. That consistency is what lets a group roll up 20 sites without rework. Ask our support team for a blank version.

Site and periodPlant 3, October 2026
Energy by carrierkWh, therms, litres, steam
Data sourceMeter, invoice or estimate
Factor setName, edition, region
Scope 1t CO2e by fuel
Scope 2Location and market-based
IntensityPer tonne, unit or batch
ReviewChecked by, date, notes
SUSTAINABILITY ENERGY MONITORING EXAMPLES

How the Same Method Plays Out in Four Sectors

These are illustrations of typical patterns, not case studies or measured results. Talk through your own sector with our industry team.

Food processing
Steam drives Scope 1Gas boilers for cooking and cleaning dominate. Linking boiler gas to cases produced shows when CIP cycles, not output, push emissions up.
Steel
Electricity drives Scope 2An electric arc furnace shop is highly sensitive to the grid factor. Location and market-based results can differ widely.
Automotive
Paint shop in focusOvens and air handling in the paint shop often lead a site's energy use. Per-body intensity separates line speed from waste.
Pharma
HVAC runs around the clockCleanroom air changes use energy even on idle days. Per-batch intensity rises when output falls, which is worth explaining.
TURNKEY AI DEPLOYMENT

Meter Connectors, ESG Dashboard and AI Server in One Package

iFactory delivers the Carbon & ESG Dashboard as a turnkey bundle. A pre-configured NVIDIA AI server ships racked and ready, with connectors for meters, historians and utility data and factor libraries pre-loaded, so plant data stays on site. You rack it, plug in power and Ethernet, and the AI is live. To scope it for your sites, request a turnkey quote.

What's Included
  • Pre-configured NVIDIA AI server, racked and ready
  • Connectors for meters, SCADA, historians and invoices
  • Emission factor library with version history
  • Scope 1 and dual Scope 2 calculations
  • Carbon intensity per unit for each site
  • Monthly lock, review and sign-off workflow
  • Export packs for CSRD, CDP and SB 253 data requests
Live in 6–12 weeks
Wk 1–4
Map and Connect

Energy sources mapped to scopes, meters and invoices connected, factor sets agreed.

Wk 5–8
Reconcile and Test

Past months recalculated and checked against your current workbook.

Wk 9–12
Go-Live and Sign-Off

Dashboard live, review workflow running, teams trained.

HOW iFACTORY FITS

Decarbonization Software That Starts at the Meter

The Carbon & ESG Dashboard is built for teams who need emissions figures they can defend, not just a chart. Our support team can plan a pilot.

1
Calculates from live energy. Scope 1 and 2 refresh as meters report, not once a quarter.
2
Reports both Scope 2 methods. Location-based and market-based, each with its own evidence.
3
Keeps the audit trail. Factor versions, data flags and sign-offs stay with every number.
4
Tracks intensity per unit. Net zero progress shows even while output grows.
1000+
Industrial clients running iFactory
99.9%
Platform uptime for continuous data capture
6-12 wks
From racked server to live emissions dashboard
FREQUENTLY ASKED QUESTIONS

What Plant and ESG Leaders Ask About Carbon Emissions Monitoring

What is the difference between Scope 1 and Scope 2 emissions?
Scope 1 covers emissions from sources you own or control, such as gas burned in boilers, ovens and furnaces, or diesel in generators. Scope 2 covers emissions from producing the electricity, steam, heat or cooling you buy. Under the GHG Protocol both are reported by every company that follows the Corporate Standard.
Do we have to report both location-based and market-based Scope 2?
Under the 2015 Scope 2 Guidance, companies with operations in markets that offer contractual instruments should report both. ESRS E1 has also required both. The GHG Protocol is revising the market-based method, but until a final version is published, the 2015 rules apply.
Which emission factors should a US plant use?
For location-based Scope 2, most US companies use the eGRID subregion rate for each site. For fuels in Scope 1, the EPA GHG Emission Factors Hub is the usual source. For market-based Scope 2, use supplier-specific rates or certificates, and a residual mix where no contract applies.
Is the SEC climate rule still something to prepare for?
The SEC rule was stayed in 2024 and never took effect. The SEC stopped defending it in March 2025 and proposed rescinding it in May 2026. Many US companies still face Scope 1 and 2 requests from California SB 253, CSRD, CDP or customers, so the underlying data work remains.
What does limited assurance mean for our energy data?
A limited assurance provider reviews your process and samples figures back to their sources. They will ask for meter or invoice data, the factor used, the calculation and evidence of review. Clear flags on estimates and gaps make that review faster.
How do we get started?
Start with one or two sites. List every energy source, map it to a scope, agree factor sets and connect meters and invoices. Then recalculate a past year and compare it with your current figures. Our support team can plan that first step with you.

Emissions Figures You Can Defend, Every Month

Connect your meters, apply versioned factors and report Scope 1 and both Scope 2 methods with a full evidence trail. The system is delivered turnkey and goes live in 6 to 12 weeks.
Example monthly close · Plant 3
Energy carriersElectricity, gas, diesel
Scope 2 methodsLocation and market-based
Factor setsLogged with edition
Data flagsExplained before lock
Every figure traceable to its source

Share This Story, Choose Your Platform!