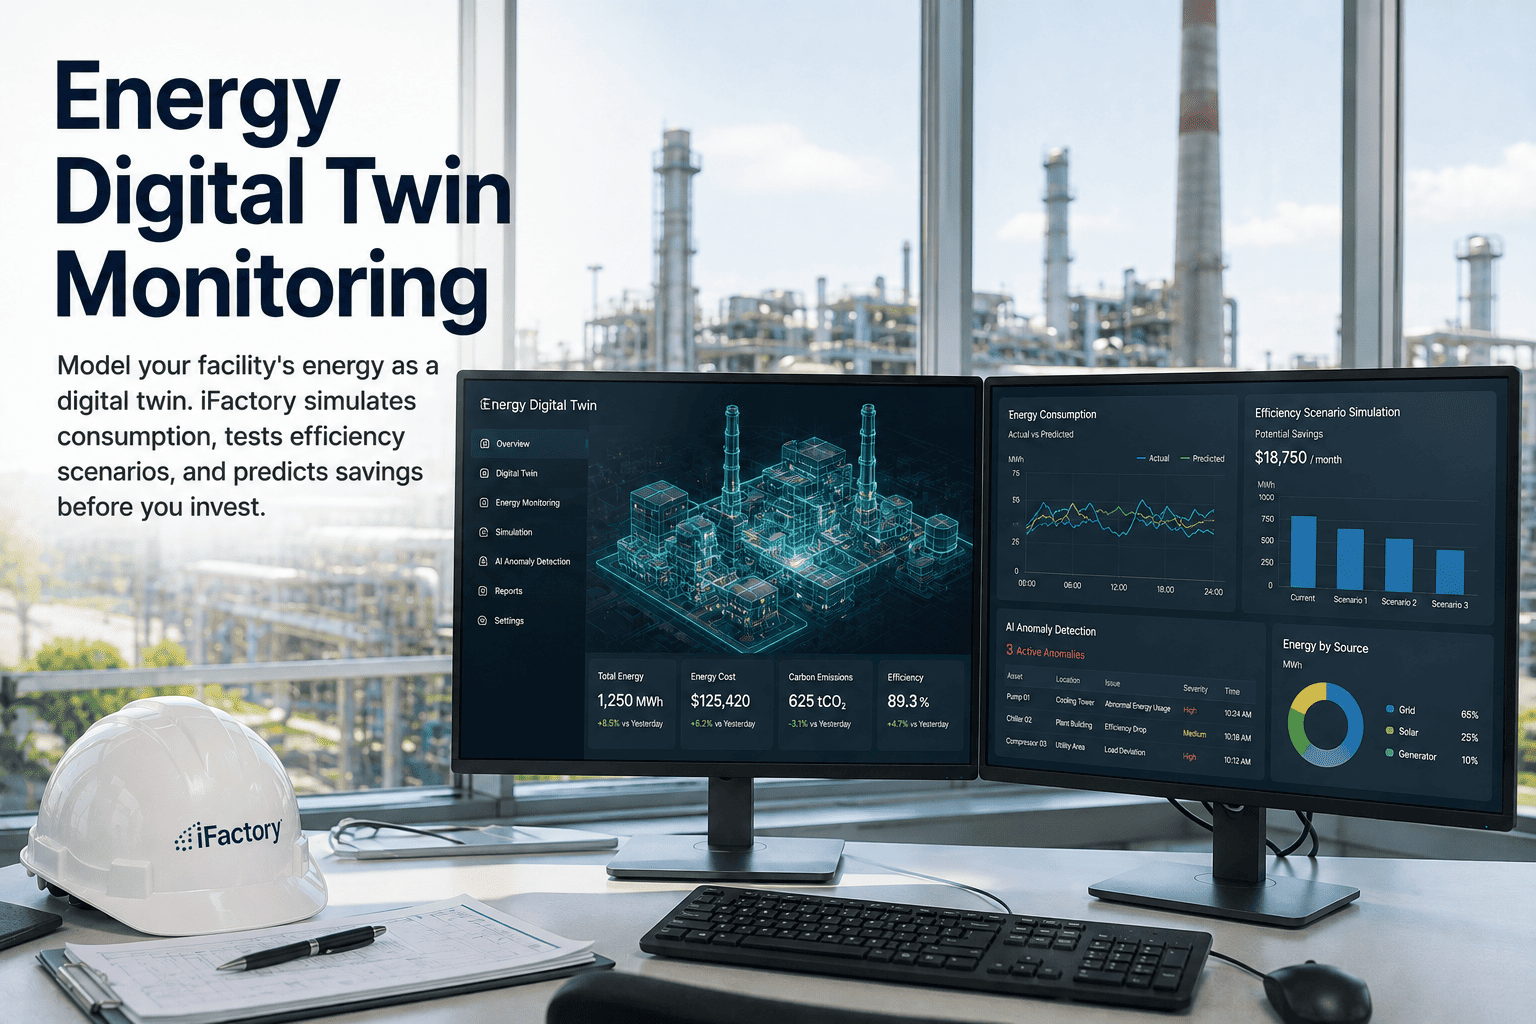
Every efficiency decision a plant makes is really a bet: retune this chiller, reschedule that shift to off-peak, replace this compressor, and you're wagering capital on a saving you can't verify until after you've spent the money. An energy digital twin removes the guesswork by letting you test the bet first. A digital twin is a dynamic, living virtual replica of your facility's energy systems, continuously updated with real-time data from the physical plant through IoT sensors — not a static model you build once, but a model that stays synchronized with reality. Because it mirrors how your plant actually consumes energy, you can run "what-if" scenarios against it: simulate a new operating schedule, a retrofit, or a production change, and see the energy and cost impact before touching the floor. And because the twin continuously predicts what consumption should be, the gap between its prediction and the live meter becomes a precise anomaly signal — flagging an asset drifting off its efficiency curve the moment it happens. That's the shift the twin represents: from reacting to last month's bill to predicting savings before you invest. To see an energy digital twin built on your plant, book a demo.
CROSS-INDUSTRY · INDUSTRY 4.0 · ENERGY DIGITAL TWIN
Model Your Facility's Energy — Then Test Every Efficiency Move Before You Spend.
An energy digital twin is a living virtual replica of your plant's energy systems, synced to real-time IoT data. iFactory lets you simulate consumption, test efficiency scenarios, and predict savings before you invest — and because the twin continuously predicts expected energy use, the divergence from actual consumption becomes a precise AI anomaly signal that catches waste as it emerges.
12–15%
Energy efficiency gains documented with twin models
predict
Test savings before you spend, not after
30 days
To first what-if simulation and anomaly detection
up to 50%
Carbon reduction reported with twin energy management
What an Energy Digital Twin Actually Is
The term gets used loosely, so it's worth being precise. An energy digital twin is not a dashboard, not a 3D picture, and not a one-off model — it is a set of adaptive models that emulate the behavior of your physical energy systems in a virtual environment, pulling real-time data to update themselves continuously across the plant's life. It mirrors how each asset, line, and utility system draws power under real operating conditions, and because it stays synchronized with the live plant, it can both predict expected behavior and be used to simulate changes that haven't happened yet. Manufacturing accounts for roughly 37 percent of global final energy consumption, and the twin is the tool that turns that consumption from an opaque cost into a modelable, testable system.
A Living Virtual Replica
The twin is a virtual model of your energy systems that continuously synchronizes with the physical plant through IoT sensors, so it reflects current reality rather than a design assumption. As equipment ages, load shifts, and processes change, the twin updates with them — staying an accurate mirror across the plant's operating life instead of drifting out of date.
Fed by Real-Time Data
Live consumption, production, and condition data flow into the twin continuously, which is exactly what keeps its simulations accurate. The continuous feed is the difference between a model that predicts your plant's behavior and a spreadsheet that predicted some plant's behavior once — the twin is grounded in what your assets are actually doing right now.
Physics Plus Machine Learning
Modern energy twins combine physics-based models of how equipment consumes energy with machine-learning models that learn each asset's real behavior from its data. This pairing lets the twin capture both the engineering fundamentals and the messy, site-specific reality, producing predictions accurate enough to trust for investment decisions.
A Testbed for Decisions
Because the twin behaves like the plant, you can run changes against it — a new schedule, a retrofit, a load shift — and see the outcome virtually before committing. It becomes a safe testbed where efficiency ideas are validated or rejected on simulated evidence, not on a gut feel that only gets checked against next quarter's bill.
The energy twin is a central component of Industry 4.0 across manufacturing sectors precisely because it unifies four capabilities that used to live in separate tools: real-time visibility, forward simulation, savings prediction, and anomaly detection — all from one continuously updated virtual model of how the facility uses energy.
Twin vs. Simulation: The Distinction That Matters
People often use "simulation" and "digital twin" interchangeably, but the difference is the whole point — and it's what makes a twin trustworthy for real decisions. Both let you model behavior, but only one stays connected to reality.
A SIMULATION
A Snapshot You Run Manually
A simulation is a model that uses historical or static data to predict system behavior under specific conditions — a snapshot in time that you set up and run by hand. It's genuinely useful for a one-off study, but it captures the plant as it was assumed to be at the moment the model was built, and it doesn't know when reality diverges from it. The moment your equipment degrades or your load pattern shifts, a static simulation quietly becomes wrong, and nothing tells you. It answers a question once; it doesn't keep answering it.
A Continuously Updated Living Replica
A DIGITAL TWIN
A digital twin is a dynamic, living virtual replica that is continuously updated with real-time data from the physical asset via IoT sensors. It doesn't just run once — it stays synchronized with the plant, so its predictions track reality as conditions change, and it can flag the instant actual behavior diverges from expected. That live connection is what makes the twin's what-if results credible for capital decisions and what turns it into an always-on anomaly detector, rather than a study that was accurate the day it was made and stale thereafter. It keeps answering, continuously.
This is why the twin can do something a simulation can't: serve as the baseline for anomaly detection. Because it continuously predicts what energy consumption should be given current conditions, any sustained gap between the twin's prediction and the live meter is a real, quantified anomaly — a capability that only exists when the model is continuously synchronized with the plant.
Test Your Next Efficiency Investment Virtually First
Bring an efficiency project you're weighing — a retrofit, a schedule change, a new asset. iFactory engineers will show how an energy twin models the change, predicts the savings and payback before you commit capital, and flags the anomalies the same model catches in live operation.
The Model–Simulate–Predict Loop
An energy twin delivers value through a continuous loop: it models the plant from live data, lets you simulate changes against that model, predicts the outcome, and then calibrates itself against what actually happens — getting more accurate with every cycle. This is the engine underneath every use case.
MODEL
Build from live data
The twin builds a virtual model of each asset and system's energy behavior from real-time and historical data, learning how consumption responds to load, ambient conditions, product mix, and schedule. This grounded model — physics plus learned behavior — is the foundation, and because it's fed continuously it represents the plant as it is now, not as it was specified years ago.
Against that model you run what-if scenarios — a different operating schedule, a retrofit, a load shift to off-peak, a production change — and the twin computes the resulting energy draw and cost without anything happening on the floor. Alternative operating strategies are evaluated on simulated evidence, so bad ideas are caught before they cost anything and good ones are quantified before they're funded.
PREDICT
See savings and payback
The twin predicts the savings, cost impact, and payback of each scenario, turning "we think this will help" into a modeled number with a range. That prediction is what lets a team compare options and rank investments by expected return before committing capital — choosing the efficiency move most likely to pay, rather than the one that seemed plausible.
CALIBRATE
Learn from reality
After a change is implemented, the twin compares its prediction against actual measured consumption and calibrates itself, tightening its accuracy for the next cycle. This closed loop is what separates a twin from a one-time study — it learns from every decision, so its predictions and its anomaly baseline both keep improving as the plant and the model stay in sync.
What-If Scenarios You Can Test
The practical power of an energy twin is the range of decisions it lets you de-risk before spending. These are the scenarios manufacturers run most often — each one a bet the twin lets you place virtually first.
01
Operating Schedule and Tariff Shifts
Model energy draw per unit of output under different schedules and test moving energy-intensive work off peak-tariff periods. The twin shows the cost impact of running a process at night versus midday, or staggering startups to shave demand — quantifying the saving from a scheduling change that costs nothing but coordination.
02
Retrofits and Equipment Upgrades
Before buying a more efficient compressor, motor, or chiller, simulate its effect on the plant's energy profile and payback against the incumbent. The twin predicts whether the upgrade earns its cost and how fast, so capital goes to the retrofit with the best modeled return instead of the one with the best sales pitch.
03
Production and Throughput Changes
Test how a new product mix, a higher throughput target, or a line reconfiguration changes energy per unit before committing to it. Production configurations and shift schedules are stress-tested virtually, surfacing the energy and cost consequences of an operational change in simulation rather than on the floor.
04
New Asset Integration
Before a new asset is physically installed, its twin validates the integration — simulating its energy draw and interaction with adjacent systems and identifying issues in advance. Commissioning time and startup waste both fall because problems that would surface in physical startup are found and resolved in simulation first.
The common thread is capital discipline. Every one of these scenarios is a decision that would otherwise be made on judgment and validated only by the bill months later — the twin moves the validation to before the spend, so the plant invests in changes it has already seen work in the model.
Predicted vs. Actual: The Anomaly Signal
Here the twin's forward-looking power turns into a live safeguard. Because the twin continuously predicts what each asset should be consuming under current conditions, the difference between that prediction and the actual meter reading is one of the most precise anomaly signals available — AI anomaly detection grounded in a model of correct behavior, not just a static threshold.
1
The Twin Predicts Expected Consumption
For every asset and system, the twin continuously computes what energy draw should be given the current load, conditions, and schedule — a live, context-aware expectation rather than a fixed limit. This is a far smarter baseline than a static threshold, because it already accounts for the legitimate reasons consumption varies, so only genuine anomalies stand out.
2
Divergence Flags the Anomaly
When actual consumption diverges from the twin's prediction and stays there, that gap is the anomaly — a quantified signal that an asset is behaving abnormally relative to how it should behave right now. Because the expectation is model-based and dynamic, the divergence catches subtle inefficiencies a blanket threshold would miss entirely.
3
It Pinpoints the Inefficient Asset
The divergence points to the specific asset operating at an inefficient point on its performance curve — running hotter than necessary, drawing more current than its actual workload demands, or scheduled into an expensive period. The twin doesn't just say consumption is high; it names the asset and the way in which it's underperforming its own model.
4
The Anomaly Becomes an Action
A flagged divergence feeds the platform's work-order loop, so an energy anomaly that also signals equipment degradation becomes a maintenance action, not just a chart. The same model that predicted the saving now protects it, closing the gap between detecting abnormal energy behavior and actually correcting it.
Predict Savings Before You Invest
The headline benefit is capital confidence. An energy twin lets a plant predict the savings of an efficiency investment before committing to it, replacing a leap of faith with a modeled forecast — which changes how energy and sustainability projects get funded and prioritized.
Rank Investments by Modeled Return
With every candidate project simulated, a plant can rank retrofits, schedule changes, and upgrades by their predicted savings and payback, and fund the ones with the strongest modeled return first. Capital allocation stops being a contest of proposals and becomes a comparison of forecasts — a defensible, evidence-based way to spend a limited efficiency budget.
Avoid the Investments That Don't Pay
Just as valuable as finding the winners is catching the projects that look good but don't model out — the upgrade whose payback is too long, the schedule change whose saving evaporates against demand charges. Rejecting a poor investment on simulated evidence saves the capital that would have been sunk into it, which is a return in itself.
Build the Case for the Board
A modeled prediction with a payback range is exactly the evidence a capital-approval process wants, turning an energy or sustainability proposal from an aspiration into a business case. The twin gives the team the numbers to defend the spend and the credibility that comes from having tested it before asking for the money.
Hit Efficiency and Carbon Targets Faster
Because the twin surfaces the highest-return moves and validates them first, plants reach efficiency and decarbonization goals faster and more cheaply — documented deployments report double-digit efficiency gains and, in buildings and plants, up to half the carbon. Targets become a modeled trajectory with known steps, not a hope.
Start Small, Scale to the Whole Plant
An energy twin doesn't require a full infrastructure overhaul on day one — it scales with where the plant is today, starting from a single high-value asset and expanding as the value proves out. This staged path is what makes it practical for facilities of any size.
1
Asset Twin — Prove It in a Quarter
Begin with one critical asset or a bottleneck process: connect its data, let the AI learn its normal energy baseline, and reach first anomaly detection and what-if simulation within about 30 days. Starting focused proves the ROI on a single asset in a quarter before any wider commitment, grounding the rollout in demonstrated return.
2
Process Twin — Model the Line
Expand to a full line or process area, integrating production and energy data so consumption is modeled per unit of output and scenarios can be run across connected assets. The continuous data feed keeps the growing model accurate, and the ROI from phase one funds and justifies the expansion.
3
Facility Twin — Whole-Plant What-If
Connect every asset, line, and utility into a facility-wide energy twin that runs whole-plant what-if scenarios for energy optimization, CapEx planning, and load management. This is where the compounding value lands — the entire facility's energy modeled as one system you can simulate against.
4
Continuous Optimization
With the facility twin live, it runs continuously — predicting, detecting anomalies, and surfacing AI-recommended optimizations as conditions change, so efficiency becomes an ongoing process rather than a project. The twin keeps finding and validating the next saving indefinitely.
What Changes for the Plant
An energy digital twin changes how a facility makes energy decisions — from reacting to lagging bills to predicting, testing, and validating every move against a living model of itself.
01
Decisions Tested Before They're Made
Every efficiency move — a schedule, a retrofit, a new asset — is simulated and its savings predicted before capital is committed, so the plant invests in changes it has already seen work in the model rather than betting on the bill to confirm them later.
02
A Smarter Anomaly Baseline
Because the twin predicts expected consumption in context, the divergence from actual becomes a dynamic anomaly signal far sharper than any static threshold — catching assets drifting off their efficiency curve that a fixed limit would never flag.
03
Capital Goes to What Pays
Ranking investments by modeled return and rejecting the ones that don't model out directs a limited efficiency budget to its highest-return use — and gives the team the forecast to defend the spend to a capital-approval process.
04
Targets Become a Trajectory
With the highest-return moves surfaced and validated first, efficiency and decarbonization goals turn from aspirations into a modeled path with known steps — the route to double-digit efficiency gains and major carbon cuts made visible in advance.
Frequently Asked Questions
The questions plant leaders and digital-transformation teams ask most often about energy digital twins.
How is an energy digital twin different from an energy simulation?
The difference is the live connection, and it's fundamental. A simulation is a model that uses historical or static data to predict behavior under specific conditions — a snapshot in time that you set up and run manually. It's useful for a one-off study, but it captures the plant as it was assumed to be when the model was built, and it has no way of knowing when reality diverges from it; as equipment degrades or load shifts, a static simulation quietly becomes inaccurate. A digital twin is a dynamic, living virtual replica that is continuously updated with real-time data from the physical plant via IoT sensors, so it stays synchronized with actual conditions and its predictions track reality as things change. That live connection is what makes the twin's what-if results credible for capital decisions and what enables anomaly detection — the twin can flag the instant actual consumption diverges from what it predicts, which a static model simply cannot do. In short, a simulation answers a question once; a twin keeps answering it as the plant evolves. To see the difference on your plant,
book a demo.
How does the twin actually predict savings before we invest?
It runs the investment as a what-if scenario against a model that already reflects how your plant really consumes energy. Because the twin is built from real-time and historical data — combining physics-based models of how equipment uses energy with machine-learning models of each asset's actual behavior — it can compute the energy and cost impact of a proposed change without anything happening on the floor. You model the retrofit, the schedule shift, or the new asset, and the twin predicts the resulting consumption, the savings against the current baseline, and the payback period, typically with a range. That lets you compare candidate projects on modeled return and rank them, funding the strongest first and rejecting the ones whose payback is too long or whose saving evaporates against demand charges. After you implement a change, the twin compares its prediction against actual measured consumption and calibrates itself, so its forecasts get more accurate over time. The net effect is that capital decisions move from judgment validated months later by the bill to forecasts validated before the spend — which is exactly what a capital-approval process wants to see.
How does a digital twin power anomaly detection?
By giving anomaly detection a model of correct behavior instead of a static threshold. The twin continuously predicts what each asset and system should be consuming given the current load, ambient conditions, product mix, and schedule — a live, context-aware expectation. When actual consumption diverges from that prediction and stays diverged, the gap is a real, quantified anomaly. This is far sharper than a fixed limit because the twin's expectation already accounts for the legitimate reasons energy use varies, so a machine that's drawing more than it should for its current workload stands out even when its absolute consumption is within normal-looking bounds. The divergence points to the specific asset operating at an inefficient point on its performance curve — running hotter than necessary, drawing more current than its workload demands, or scheduled into a costly period. And because a consumption anomaly often signals equipment degradation as well as energy waste, the flag feeds the platform's work-order loop so it becomes a maintenance action rather than just a chart. The same model that predicts your savings is what protects them in live operation.
Do we need to model the whole plant before we get value?
No — an energy twin scales with where you are today, and the recommended path starts small deliberately. You begin with a single high-value asset or a bottleneck process: connect its data, let the AI learn its normal energy baseline, and you reach first what-if simulation and anomaly detection within about 30 days. That focused start proves the ROI on one asset in a quarter, before any wider commitment. From there you expand to a full line or process area, integrating production and energy data so consumption is modeled per unit of output, with phase-one returns funding the expansion. Eventually you connect every asset, line, and utility into a facility-wide twin that runs whole-plant what-if scenarios for energy optimization and CapEx planning — where the compounding value lands. This staged approach means you never need a full infrastructure overhaul to start, and each phase is justified by the demonstrated return of the last. Cloud-based, modular architecture makes it practical for facilities of any size, including smaller plants that start with one line and grow the twin over time.
Does this work across different industries?
Yes — the energy digital twin is a cross-industry concept and a central component of Industry 4.0 across manufacturing sectors, because the underlying approach doesn't depend on what you make. Any facility that consumes energy through assets and processes can be modeled: the twin learns how those specific assets draw power under real conditions, whether they're kilns and mills in cement, chillers and clean utilities in pharma, compressors and refrigeration in food and beverage, or machining centers in discrete manufacturing. The physics-based and machine-learning models are configured to the actual equipment and calibrated from its own data, so the twin fits the real plant rather than a generic template. That's why documented deployments span discrete manufacturing, process industries, and food and beverage, with reported energy efficiency gains in the double digits and, in buildings and plants using twin energy management, carbon reductions up to half. The methodology — model from live data, simulate what-if scenarios, predict savings, detect anomalies from predicted-versus-actual divergence — is the same everywhere; only the assets being modeled change. Contact
iFactory support to discuss your facility and sector.
MODEL · SIMULATE · PREDICT · DETECT
Stop Betting on Efficiency Moves — Test Them Against a Living Model of Your Plant First.
An energy digital twin models your facility's energy from real-time IoT data, simulates what-if scenarios, and predicts savings and payback before you invest — then uses the same model to catch anomalies from the divergence between predicted and actual consumption. Start with one asset, prove ROI in a quarter, and scale to a whole-facility twin that keeps finding the next saving. Double-digit efficiency gains, tested before you spend.