In a pharmaceutical plant, the cleanroom air handling system is both the single largest energy consumer and the one nobody dares touch. Benchmarking studies put HVAC at 36 to 67 percent of total facility energy, driven by air change rates that run around the clock at full load whether the room is packed for a batch or empty all weekend. Everyone knows there's waste in that. The reason it never gets addressed is simple: you can't safely reduce what you can't continuously see, and most plants have no live, unified view of air changes, pressure, and energy at once. Continuous monitoring is the prerequisite for every energy decision that follows. You can book a demo to see your own cleanrooms on one live view.
See Air Changes, Pressure, and Energy on One Live View — Before You Change a Single Setpoint
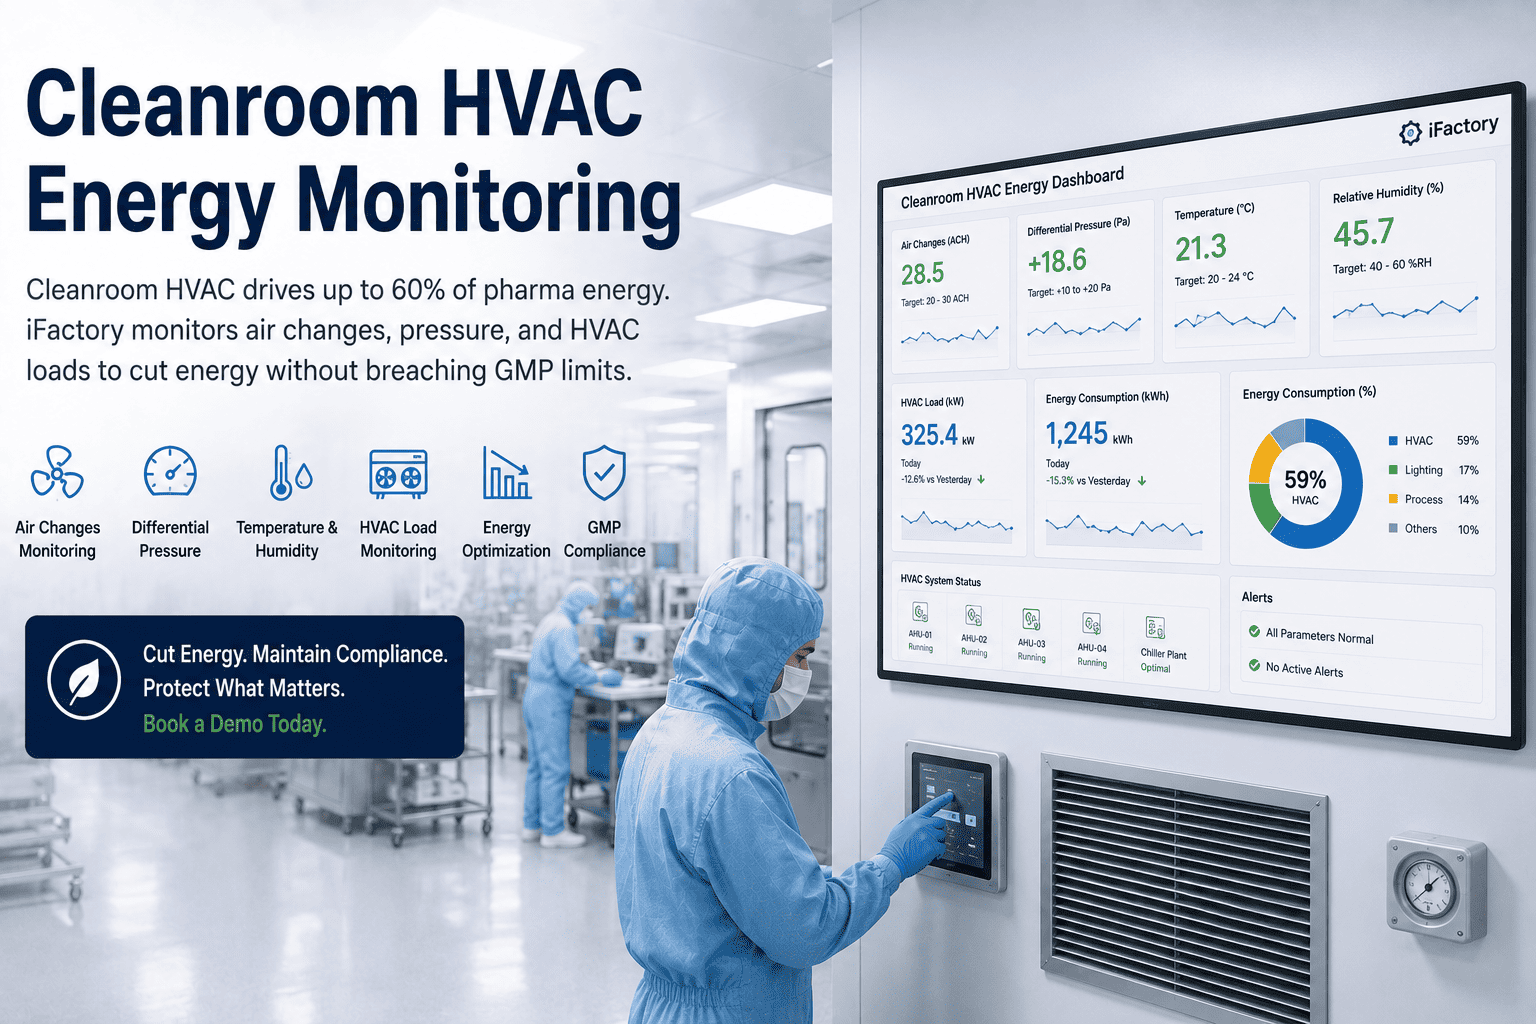
iFactory continuously monitors cleanroom air change rates, pressure cascade, and HVAC energy load together, with the compliance trail to prove GMP classification held — so energy waste becomes visible and every reduction becomes defensible.
The Energy Isn't Hidden — It's Just Never Been Watched Together
Every plant has the individual signals somewhere: the BMS knows fan speeds, the certification report knows air change rates, the utility meter knows consumption. What almost no plant has is those signals on one timeline, live, so that a rise in energy draw can be read against the air changes and pressure that justify it. Without that unified view, the waste is real but unprovable — and in a GMP environment, nobody reduces what they can't prove is safe to reduce. So the AHUs keep running at full design load, and the overspend continues by default.
What makes this so persistent is that the waste hides behind a legitimate fear. Contamination control genuinely is subordinate to nothing — product quality and patient safety come first, always — and that principle is correct. But over decades it hardened into a habit of "more air is always safer," applied without measurement, so rooms end up running far more air changes than their classification actually needs. The overspend isn't a failure of caution; it's caution without data. Give the same cautious engineer a continuous, defensible view of what the room is actually doing, and the excess margin becomes visible as excess rather than as safety.
Fan speed in the BMS, air changes in a six-month certification, energy on the utility bill — three systems that never meet, so no one can see the relationship between them.
Classification is proven at requalification — every six months for the tightest rooms — and assumed to hold in between. Between snapshots, drift is invisible, so margins are kept huge as insurance.
Decades of overdesign left rooms running far more air changes than their classification actually requires, because a fixed high rate feels safe and no live data challenges it.
The room sits empty overnight and all weekend at full air change rate — because without continuous particle, pressure, and recovery data, no one can demonstrate a setback wouldn't breach classification.
Air Changes, Pressure, Load, and the Compliance Envelope — On One Timeline
Cleanroom energy monitoring only works when the energy signal is read alongside the parameters that constrain it. Watch any one alone and you either miss the waste or miss the risk. iFactory brings the four together so each reading is interpreted in the context of the others.
The dominant energy driver. An ISO Class 7 room can run anywhere from 30 to 60 air changes per hour, and much of that is margin rather than requirement. Monitoring the actual rate against the classification limit shows where air — and the fan, cooling, and humidification energy behind it — is being moved for no contamination benefit.
The differential that keeps contaminants out — typically a positive 5 to 12.5 pascals relative to adjacent spaces. It's non-negotiable for GMP, and it's also where envelope leakage quietly drives up makeup air demand, since leakage rises with pressure. Watching the cascade live catches a drifting differential before it becomes either a compliance event or an energy leak.
The actual power draw of the AHUs, fans, chillers, and humidification — the number that turns air changes and pressure into a cost. Trended against the other parameters, it reveals when energy is climbing without a corresponding contamination-control reason, which is the definition of recoverable waste.
Particle counts, temperature, humidity, and cleanroom recovery time — the boundary conditions that any energy move has to respect. Monitoring them continuously is what converts an energy decision from a gamble into a documented, risk-based action with proof that classification never lapsed.
Put All Four Parameters on One Screen
iFactory connects to your existing AHUs, sensors, and BMS to show air changes, pressure, energy, and the compliance envelope together — the unified view that makes cleanroom energy waste visible and safe to act on.
You Can't Safely Reduce What You Can't Continuously See
The industry has established that reducing air change rate during unoccupied periods is the single biggest energy lever in a cleanroom, and that a validated setback can cut HVAC energy meaningfully without touching classification. But every credible version of that strategy starts the same way: with continuous data. Monitoring isn't a step toward the savings — it's the foundation the entire risk-based case is built on.
Even a plant that never changes a single setpoint gains from this. Continuous monitoring of air changes, pressure, and particle counts is live GMP assurance — proof, minute by minute rather than twice a year, that every room held its classification. That means a drifting pressure cascade or a failing filter shows up as a flagged trend the day it starts, not at the next requalification. The energy savings are the upside; the compliance confidence is the floor.
The Loads Behind the Air Change Rate
A high air change rate isn't one cost — it's four, because every volume of air the room turns over has to be moved, cooled, dried, and filtered. Monitoring each load against the air changes driving it shows which part of the overspend is recoverable.
Moving the air is the most direct cost of a high air change rate, and fan energy scales sharply with airflow — making airflow the highest-leverage number to watch.
Every air change brings a heat load that has to be removed. More air changes mean more conditioning, and in a warm climate this is often the largest single component.
Holding tight humidity bands against a constant flood of makeup air is energy-intensive, and leakage-driven makeup air quietly inflates it.
HEPA filters loading up raise the pressure the fans must overcome, so energy creeps upward between filter changes in a way only trending reveals.
Requalification Every Six Months vs. Knowing Every Minute
The regulatory baseline is periodic certification — every six months for the tightest rooms, annually for the rest. That proves classification at a point in time. It says nothing about the thousands of hours in between, which is exactly where both the energy waste and the undetected drift live.
Think about what that gap actually means in practice. A cleanroom certified in January and again in July is formally compliant, but the two certificates say nothing about a filter that began loading in March, a door seal that started leaking in April, or a differential that crept downward through May. Each of those is both a compliance risk and an energy cost — a failing filter raises fan energy while a drifting cascade increases makeup air — and all of them are invisible until the next scheduled test, or until something goes wrong. Continuous monitoring collapses that blind window to zero, which is why it delivers on both fronts at once rather than forcing a trade-off between compliance assurance and energy insight.
- Classification proven twice a year, assumed in between
- Pressure or filter drift found at the next requalification
- Air change margins kept huge as blind insurance
- Energy waste invisible with no live parameter view
- Setback impossible to justify without continuous proof
- A compliance excursion discovered after the fact
- Classification evidenced minute by minute, always
- Drift flagged as a trend the day it begins
- Margins sized to real, measured performance
- Energy waste quantified against the air it needs
- Setback backed by a documented data trail
- Excursions caught and contained as they emerge
An Intelligence Layer on the AHUs and Sensors You Already Run
This isn't a rip-and-replace of your air handling or your building management system. iFactory reads from the equipment and instrumentation already in place and turns their scattered signals into one live, GMP-aware picture.
What Pharma Facility and Quality Teams Ask
Make Cleanroom Energy Visible Without Risking a Single Classification
iFactory unifies air changes, pressure, energy, and compliance on one continuous view — so you can prove GMP held every minute and see exactly where the HVAC overspend is, before you ever change a setpoint.