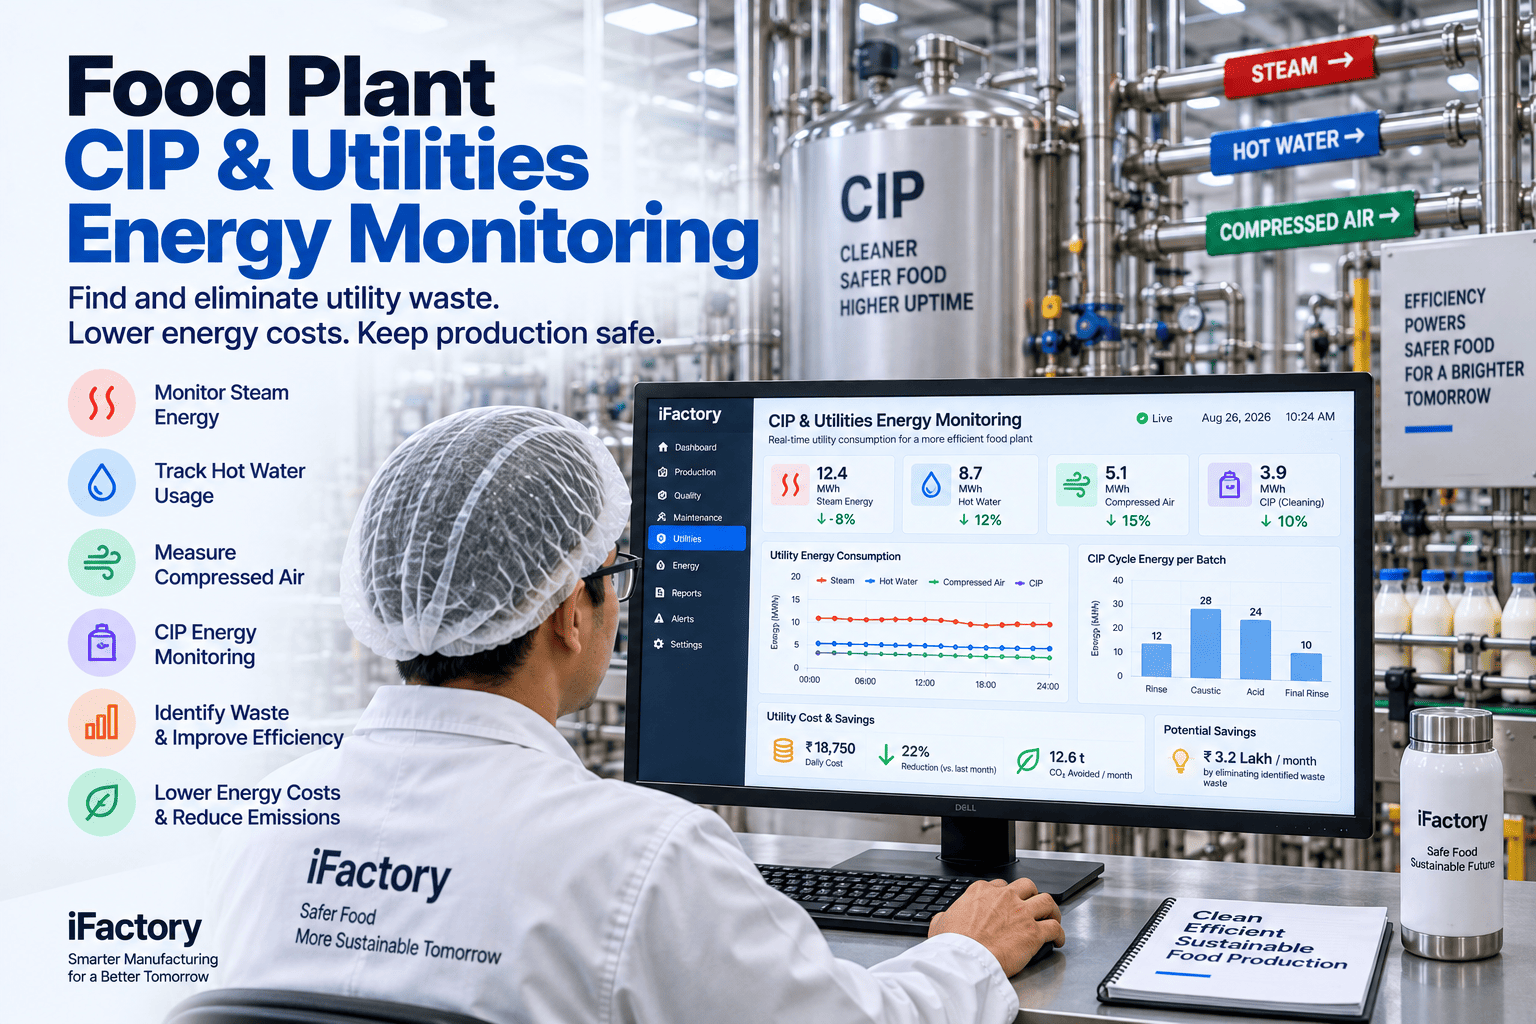
In a food plant, the machines everyone watches — the fillers, the packers, the conveyors — aren't where the energy money goes. It goes into the utilities feeding them: the steam that heats and sterilizes, the hot water, the compressed air, and above all the clean-in-place cycles that draw on all three at once. That's exactly where the waste hides, because utilities are almost never metered at the point of use. A failed steam trap hisses live steam behind insulation for months. A compressed-air leak is silent. A CIP cycle runs a few degrees too hot and a few minutes too long, every wash, and nobody sees the fuel it burns. The result is a utility bill 15 to 30 percent higher than it needs to be, spread invisibly across systems no one meters. Utility energy monitoring makes that waste visible and priced, per system and per CIP cycle. You can book a demo to see it on your utilities.
The Energy Isn't in the Machines — It's in the Steam, Air, and Water Feeding Them
Monitor steam, hot water, compressed air, and CIP energy across the food plant — pinpointing the utility waste that quietly drives up processing energy costs, because you can't cut what nobody is metering at the point of use.
You're Metered at the Boiler, Not at the Point of Use
Most food plants know their total gas and electricity bill to the penny, and almost nothing about where inside the plant it's actually consumed. The meter is at the boiler and the main, not at the steam header serving the cook kettle or the compressed-air drop at the blow-off station. That single gap — aggregate billing with no point-of-use visibility — is why utility waste persists for years: it never shows up as a specific, fixable line item. These are the forms it takes.
A failed-open steam trap dumps live steam straight into the condensate return, hissing quietly behind insulation or above a ceiling. Nobody hears it, and with 15 to 30 percent of traps failed in a typical plant, dozens are wasting fuel right now.
Compressed air is the most expensive utility per unit of energy, and 20 to 30 percent of it typically leaks away through aging fittings and worn seals — inaudibly, since the leaks are ultrasonic. A single quarter-inch leak runs about $2,500 a year.
A clean-in-place cycle heats water with steam, circulates it, and blows lines with compressed air — drawing all three utilities hard, every wash. A cycle running hotter or longer than needed wastes energy on every tank, unmetered and unnoticed.
Damaged or missing insulation on steam and hot-water lines bleeds heat continuously — an uninsulated hot line can lose a large share of the energy it carries. It's visible if you look, but nothing flags it, so it radiates money for years.
Steam, Hot Water, Compressed Air, and CIP — Each Watched Where It's Wasted
Utility monitoring works by instrumenting each system where its waste actually occurs and turning consumption into a visible, priced signal. Each of the four systems fails in its own characteristic way, so each is watched for its own waste signature. Here's what monitoring surfaces on each.
Continuous temperature and condensate monitoring on steam traps catches a failed-open trap within hours instead of the months a once-a-year manual survey allows — each trap cycling correctly has a signature, and a continuous rushing signature is live steam escaping. Distribution and insulation losses and boiler load show up as consumption that doesn't match the process heat actually delivered.
Monitoring flow against production reveals the baseline leak rate — the air the system consumes when nothing should be running is pure leakage — and flags a compressor pulling above its normal load from a fouled filter or dryer fault. Leak repair is consistently the fastest-payback energy project in a plant, often paying back in weeks.
Hot-water generation and consumption are tracked against need, surfacing over-heating, standing losses, and opportunities to recover heat from condensate or wastewater rather than making it fresh. In a plant that heats enormous volumes of water for process and sanitation, small percentage gains are large absolute numbers.
CIP is monitored as an energy event in its own right, because a single cycle draws steam, hot water, and compressed air together. Tracking energy per cycle exposes cycles running hotter or longer than the sanitation actually requires — the concentrated, repeated waste that a plant-level meter can never isolate.
Put a Meter Where the Waste Actually Is
iFactory monitors steam, hot water, compressed air, and CIP at the system and cycle level — turning aggregate utility spend into per-system, per-cycle waste you can see, price, and fix.
Why Clean-in-Place Is the Highest-Value Thing to Monitor
Of all the places utilities get consumed in a food plant, CIP is the one where monitoring pays off most — because it's the single point where steam, hot water, and compressed air all get drawn hard, repeatedly, on a schedule, and where the energy per cycle is almost never measured. A food plant runs CIP constantly across tanks, lines, and vessels, so a few percent of waste per cycle compounds into one of the plant's largest recoverable energy pools. This is what per-cycle monitoring reveals.
A CIP cycle held hotter than the sanitation chemistry and time actually require burns extra steam on every wash. Per-cycle energy monitoring shows which circuits run hot against their real requirement, so setpoints can come down without touching efficacy.
A cycle that runs longer than needed wastes heat, water, and air together for every extra minute. Tracking cycle energy against a validated baseline flags the circuits where time can be trimmed safely.
Because CIP is scheduled and expected, its energy disappears into the plant baseline as "just sanitation." Metering it separately splits necessary sanitation energy from the overrun hiding inside it — the distinction a total meter can't make.
CIP discharges large volumes of hot water and condensate. Monitoring the cycle's energy flows surfaces where that heat or water could be recovered and reused rather than sent to drain, turning a cost into a partial recovery.
From an Anomaly to a Work Order, Not Just a Dashboard
A utility dashboard that only displays consumption is a wall poster. The value comes when a consumption anomaly turns into a specific, assigned action with its energy cost attached — so the failed trap gets replaced and the leak gets sealed rather than admired on a chart. This is the loop that converts visibility into recovered money.
Each utility system and each CIP circuit gets a normal-consumption baseline, so waste is defined as deviation from what that system should draw — not a guess against a plant-wide average that hides the specific offender.
When consumption drifts above baseline — a trap fails, a leak opens, a CIP cycle creeps hot — the system flags it and quantifies the energy cost in real terms, so the finding is a dollar figure, not an abstract kilowatt curve.
The anomaly opens a maintenance action pointed at the specific asset — this trap, this compressor, this circuit — with the energy impact attached, so the financial value of the fix is visible and it gets prioritized against everything else competing for the crew.
After the repair, the same monitoring confirms consumption returned to baseline — closing the loop by proving the saving was real and catching the fix that didn't hold, so recovered energy stays recovered.
These Fixes Pay Back in Weeks, Once You Can See Them
The reason utility monitoring is such a strong investment is that the fixes it surfaces are among the cheapest and fastest-returning in the whole plant — no capital equipment, just the visibility to know where to point an existing crew. The barrier was never the fix; it was seeing the waste. These are the returns monitoring unlocks.
A systematic program of catching and replacing failed traps typically saves a meaningful share of total boiler fuel, with a payback often under six months — and continuous monitoring means failures are caught in hours, not at the next annual survey.
Systematic leak repair recovers a large share of compressor capacity and is consistently the single fastest-payback energy project in a plant — often measured in weeks, sometimes deferring a compressor purchase entirely.
Trimming over-heated and over-run cycles to their validated requirement cuts steam, water, and air together, repeated across every wash — a recurring saving that needs no hardware, only the per-cycle data to know which cycles to trim.
Repairing insulation and recovering condensate or CIP heat are low-cost fixes with outsized returns that go unbudgeted precisely because nothing flags them — monitoring puts them on the list with a number attached.
The Same Data Serves Reliability and Reporting
Utility monitoring earns its place beyond energy savings, because the consumption signals it captures double as early warnings and as the raw material for the sustainability reporting food companies increasingly have to produce. The meter you installed to cut cost quietly does two more jobs.
A compressor drawing above baseline isn't just wasting energy — it's often a fouled condenser or failing component announcing itself early, so the energy signal catches the mechanical problem before it becomes a breakdown.
Tying utility consumption to production output yields energy-per-unit and energy-per-CIP-cycle metrics, so efficiency is tracked as a real operational KPI rather than inferred from a monthly bill after the fact.
The same monitored data aggregates into the carbon-footprint, energy-intensity, and utility-consumption reports that ESG frameworks and certifications require — produced from operational data rather than assembled by hand in spreadsheets.
A retained consumption history proves which efficiency actions actually worked and by how much, giving an energy program the evidence to justify the next investment instead of relying on estimated savings.
Every Utility Metered Where It's Used, Every Anomaly Actioned
iFactory instruments the food plant's utility systems — steam, hot water, compressed air, and CIP — at the point of use, baselines each, prices every deviation, and drives it to a targeted work order, so aggregate utility spend becomes a set of specific, fixable, verified savings.
What Food Plant Teams Ask About Utility Energy Monitoring
Stop Paying for Steam, Air, and Water You Never See
iFactory meters steam, hot water, compressed air, and CIP at the point of use, prices every deviation, and drives it to a targeted fix — so the 15 to 30 percent of utility spend hiding as invisible waste becomes visible, actionable, and recovered.