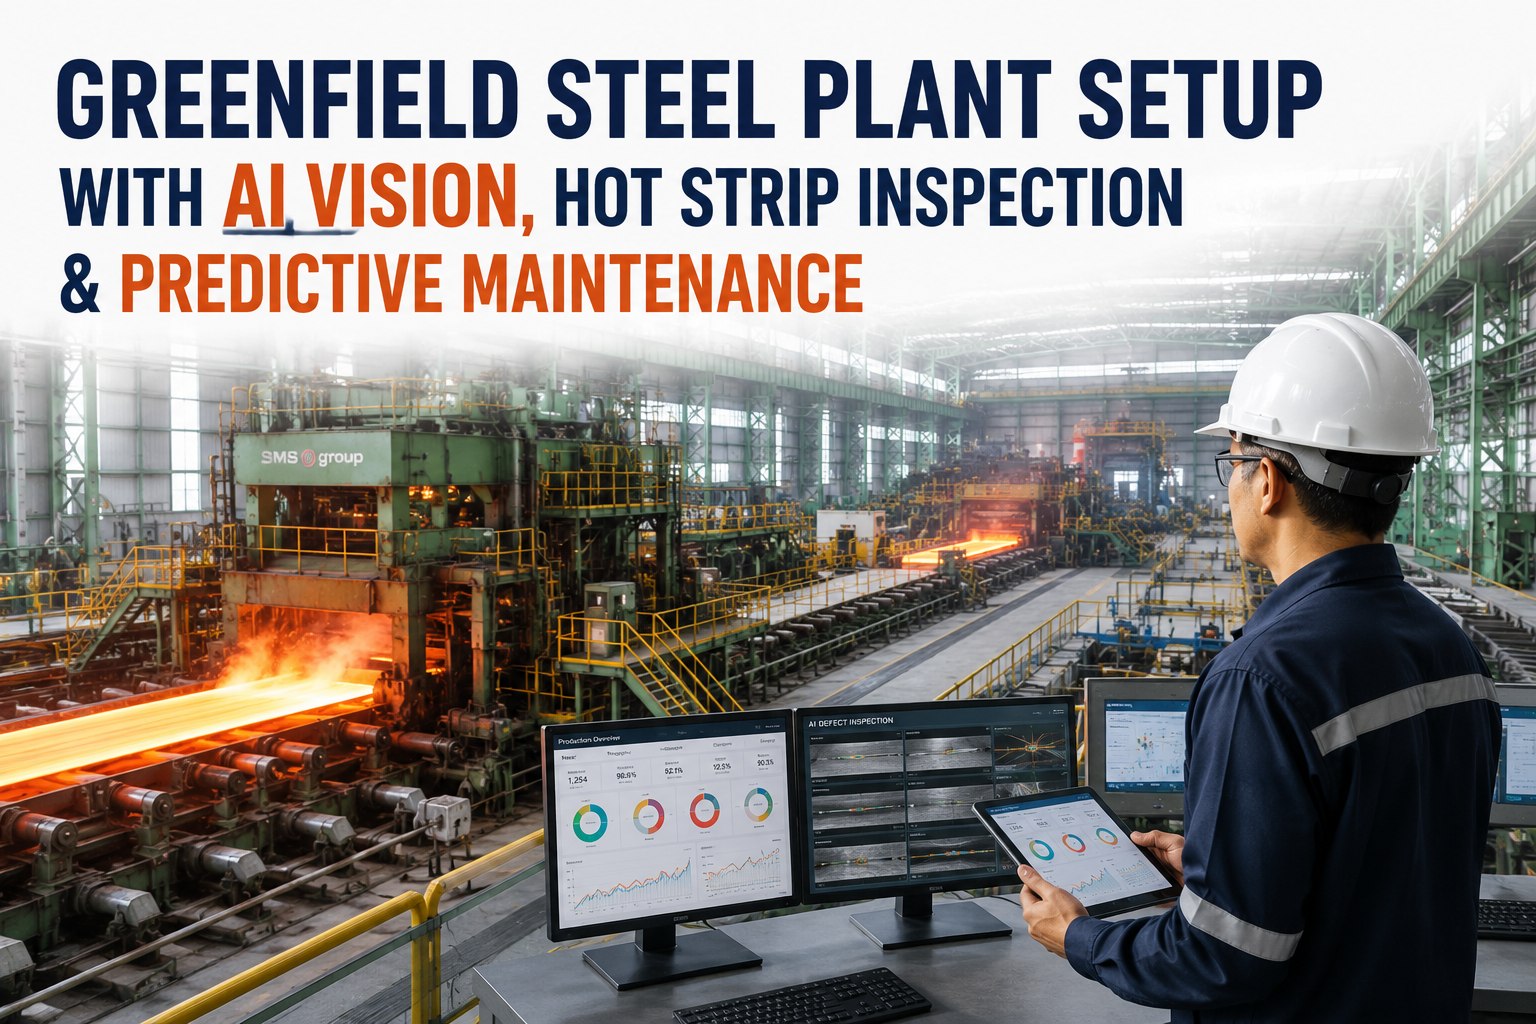
Unplanned downtime costs Fortune Global 500 companies $1.4 trillion annually — 11% of total revenues. Yet 40-60% of factories still operate at Level 1 maintenance maturity, fixing equipment after it breaks. The plants pulling ahead in 2026 layer three strategies into one coherent maintenance system: preventive for routine work, predictive for critical assets, and autonomous (TPM) for operator-led care. Done right, the hybrid model delivers 50-65% unplanned downtime reduction, 10:1 to 30:1 ROI on predictive investments, and 6-14 month payback. This template gives you the maturity model, the 3-strategy framework, the asset criticality matrix, the 7 KPIs, the 5-phase implementation roadmap, and the mistakes that derail strategy rollouts. Book a maintenance strategy review to apply this to your plant.
Level 1
Reactive
Fix on failure · firefighting · 60% unplanned
OEE ~ 40-55%
Level 2
Preventive
Calendar-based PMs · 88% of plants do this
OEE ~ 55-70%
Level 3
Condition-Based
IoT sensors · threshold alerts · CBM
OEE ~ 70-80%
Level 4
Predictive (AI/ML)
ML predicts failure 2-4 weeks early · 40% adoption
OEE ~ 80-88%
Level 5
Autonomous
AI agents close the loop · auto work orders + scheduling
OEE ~ 88-95%
Why Reactive Maintenance Bleeds 11% of Revenue
Reactive maintenance feels cheaper because you don't pay until something breaks. The actual math is the opposite — every reactive intervention costs 3-5x what proactive maintenance would have cost, plus production loss, plus emergency procurement premiums, plus safety risk. Five hidden costs that make Level 1 maintenance the most expensive strategy you can choose.
01
Production Loss Cascades
Unplanned downtime stops production immediately and cascades through downstream operations. Automotive plants lose $260K/minute. F&B and pharma run similar magnitudes during peak production.
02
Emergency Procurement Premiums
Parts ordered hot cost 20-50% more than planned procurement. Mid-size plants spend $180K+ annually on emergency parts premiums. Predictive maintenance eliminates 90% of this spend.
03
Collateral Equipment Damage
Failed bearings damage shafts. Failed seals damage pumps. Run-to-failure means small components take down expensive systems. Catastrophic failures cost 5-10x condition-based interventions.
04
Safety & Compliance Exposure
Unexpected failures trigger safety incidents, environmental releases, and regulatory findings. The OSHA/EPA cost of a single incident often exceeds an entire year of predictive maintenance budget.
05
Reputation & Customer Penalties
Missed deliveries trigger contract penalties, lost orders, and customer churn. In just-in-time supply chains, one breakdown can disrupt your tier-1 customer's production for weeks.
The 3 Maintenance Strategies in Your Mix
The 2026 winners don't pick one strategy — they layer three. Preventive handles routine work. Predictive monitors critical assets. Autonomous (TPM) puts operators back in the maintenance loop. The strategy template below shows what each does, when each wins, and how they combine.
Strategy A
Preventive Maintenance
Time-based · Calendar-driven · Hours-based
Scheduled PMs at fixed intervals — daily inspections, weekly lubrication, monthly calibrations, annual overhauls. Reliable, well-understood, easy to implement. 88% of factories use it as their foundation.
Best for
Standard equipment · predictable wear · mid-criticality assets
Watch out
30% of interventions unnecessary · replaces parts with remaining life
Strategy B
Predictive Maintenance
AI/ML · IoT sensors · Condition-driven
Real-time sensor data + ML models predict failures 2-4 weeks before they happen. Vibration, temperature, oil analysis, acoustic signatures. Maintenance happens exactly when needed — not too early, not too late.
Best for
Critical assets · high downtime cost · predictable failure modes
Watch out
Sensor + data infrastructure required · 4-8 weeks deployment
Strategy C
Autonomous Maintenance (TPM)
Operator-led · Routine care · Daily/shift-based
Operators handle basic maintenance — cleaning, inspection, lubrication, minor adjustments. Frees maintenance technicians for higher-value work. Builds operator ownership and catches issues before they escalate.
Best for
All equipment · routine care · early issue detection
Watch out
Requires operator training + workflow redesign · culture change
Build Your Hybrid Maintenance Strategy
iFactory's reliability team designs hybrid maintenance strategies — asset criticality assessment, preventive PM optimization, predictive maintenance deployment, autonomous maintenance program design, and the integrated CMMS/MES architecture to run them. Built for 50-65% unplanned downtime reduction in 12 months.
Asset Criticality Matrix · Strategy-to-Asset Match
Not every asset deserves predictive sensors. Not every asset needs preventive PMs. The criticality matrix below maps assets to strategies based on failure impact and failure frequency. Use it to allocate maintenance budget where it pays back — and to deliberately under-maintain low-criticality assets without guilt.
Failure Impact
Low Frequency
Medium Frequency
High Frequency
Critical (Production stops)
Predictive
Predictive
Predictive + Redundancy
High (Major slowdown)
Preventive
Predictive
Predictive
Medium (Minor impact)
Run to Failure
Preventive
Preventive
Low (No production impact)
Run to Failure
Run to Failure
Preventive (light)
Need help running asset criticality analysis for your plant? Book a criticality assessment workshop with our reliability team.
7 Maintenance KPIs for the 2026 Dashboard
Your maintenance strategy is only as good as the metrics that measure it. Seven KPIs split between leading indicators (predict the future) and lagging indicators (report the past) give you the full picture. Track all seven or you'll optimize the wrong things.
Lagging · Holy Grail
OEE
Overall Equipment Effectiveness
Availability × Performance × Quality
Target: 85%+ world-class · 60% industry avg
Lagging · Reliability
MTBF
Mean Time Between Failures
Total Uptime ÷ Number of Failures
Target: Increasing trend · benchmark by asset class
Lagging · Response
MTTR
Mean Time To Repair
Total Repair Time ÷ Number of Repairs
Target: Decreasing trend · benchmark by asset class
Leading · Discipline
PM Compliance
Preventive Maintenance Compliance Rate
PMs Completed On Time ÷ Total PMs Scheduled
Target: 90%+ · drops below = breakdowns rising
Leading · Maturity
Planned vs Unplanned
Planned Maintenance Ratio
Planned Hours ÷ Total Maintenance Hours
Target: 80% planned · reality 40% in most plants
Leading · Mix
Corrective:Preventive
Maintenance Work Type Ratio
Corrective Work ÷ Preventive Work
Target: 1:6 (mostly preventive) · 4:1 = firefighting
Lagging · Cost
Maintenance Cost %
Maintenance Cost as % of ERV
Annual Maint Cost ÷ Estimated Replacement Value
Target: 2-4% world-class · 6%+ = excessive
Want a configured KPI dashboard for your maintenance program? Connect with our reliability team for KPI framework + dashboard design.
5-Phase Implementation Roadmap
Most plants try to jump from Level 1 (reactive) to Level 4 (predictive) in one project — and fail. The phased roadmap below builds the foundation before adding sophistication. Total timeline: 12-18 months from Level 1 to Level 4. Skip phases and the implementation collapses.
Phase 1
Foundation · Asset Inventory & Criticality
Catalog every asset · assign criticality scores · build failure mode library · clean up the CMMS · standardize work orders
Months 1-2
→
Phase 2
Preventive Optimization
Right-size PM intervals · eliminate unnecessary PMs · build PM compliance discipline · target 90%+ compliance
Months 3-5
→
Phase 3
Autonomous Maintenance (TPM)
Train operators on basic maintenance · deploy shift inspection checklists · build operator-technician handoff workflows
Months 4-7
→
Phase 4
Condition-Based + Predictive
Deploy IoT sensors on critical assets · build threshold alerts · train ML models on historical data · 2-4 week failure prediction
Months 8-14
→
Phase 5
Autonomous Ops · AI Closes the Loop
Auto work orders from prediction · agentic scheduling · closed-loop optimization · KPI dashboards across all roles
Months 15-18
Need a 12-18 month implementation plan tailored to your plant? Book a phased roadmap session with our reliability team.
5 Common Strategy Mistakes
Most maintenance strategy projects fail for predictable reasons. Five mistakes that show up in nearly every stalled implementation — and how to avoid each at design time.
01
Skipping Asset Criticality Analysis
Applying the same strategy to every asset is the most common mistake. Critical assets get under-maintained, non-critical assets get over-maintained, budget gets wasted. Run criticality analysis first.
02
Jumping Straight to Predictive
Without disciplined preventive maintenance and a clean CMMS, predictive sensors produce data nobody acts on. Build the foundation (Phase 2) before deploying sensors (Phase 4).
03
Treating It as a Maintenance-Only Project
Strategy success depends on operators (autonomous maintenance), production (PM scheduling), and IT (CMMS/sensors). Cross-functional governance from day one.
04
Tracking Lagging KPIs Only
OEE and MTBF tell you what already happened. PM compliance and planned ratio predict next quarter. Track both — leading indicators give you time to react.
05
No CMMS-MES Integration
Maintenance strategy without integrated CMMS/MES data is half-blind. Auto work orders from downtime, PM windows in production schedule, sensor triggers to CMMS — all four handshakes or none.
Expert Perspective
The teams that succeed at maintenance transformation share one understanding: this isn't a technology project, it's a culture project with a technology layer. The sensors and AI are easy compared to the human workflow redesign. Operators have to take ownership of equipment they used to hand off to maintenance. Maintenance techs have to trust ML models more than gut instinct. CFOs have to fund predictive sensors before the ROI shows up. Plant managers have to track leading indicators that don't immediately move the financial scoreboard. The plants that get this right don't have better technology — they have leadership that built the culture first and let the technology serve it. Five years from now, the gap between Level 1 plants and Level 4 plants won't be technology budget. It'll be organizational maturity.
— Reliability Engineering Best Practice
88%
Plants using preventive maintenance
40%
Layering predictive on top
66%
Using hybrid (preventive + predictive)
50-65%
Unplanned downtime cut with hybrid
Bottom Line · The Hybrid Wins, Not the Pure Play
The maintenance strategy debate isn't about which approach is "best" — it's about which combination optimizes your specific asset mix, downtime costs, and capability maturity. The 2026 winners layer all three: preventive for routine, predictive for critical, autonomous (TPM) for operator-led care. They map strategy to asset criticality. They track leading and lagging KPIs in equal measure. They follow the 5-phase roadmap — foundation, preventive optimization, autonomous maintenance, predictive deployment, then autonomous AI ops. The plants stuck at Level 1 don't lack budget or technology — they lack a coherent strategy. Use this template to build yours. The first year of structured strategy delivers 50-65% unplanned downtime reduction and 10:1 to 30:1 ROI on the predictive layer. The compound effect over 5 years separates the leaders from the laggards.
Build a Hybrid Maintenance Strategy That Cuts Downtime 50-65%
iFactory's reliability team designs end-to-end maintenance strategies — asset criticality, hybrid preventive + predictive + autonomous, KPI dashboards, CMMS-MES integration, phased 12-18 month roadmap. Built for greenfield and brownfield manufacturing plants.
Frequently Asked Questions
What are the 5 levels of maintenance maturity?
Level 1 Reactive (fix on failure, ~40-55% OEE), Level 2 Preventive (calendar-based PMs, ~55-70% OEE, 88% adoption), Level 3 Condition-Based (IoT thresholds, ~70-80% OEE), Level 4 Predictive (AI/ML predicts 2-4 weeks early, ~80-88% OEE, 40% adoption), Level 5 Autonomous (AI closes the loop, ~88-95% OEE).
What's the difference between preventive, predictive, and autonomous maintenance?
Preventive = time-based scheduled PMs (calendar/hours). Predictive = condition-based + AI/ML predicting failures 2-4 weeks early from sensor data. Autonomous (TPM) = operator-led routine care (cleaning, lubrication, inspection). The 2026 winners layer all three: preventive for routine, predictive for critical, autonomous for operator-led care.
How do I match maintenance strategy to asset criticality?
Use a 2×2 matrix (Failure Impact × Failure Frequency). Critical assets (production stops) → Predictive, regardless of frequency. High impact + medium frequency → Predictive. Medium impact + low frequency → Run to Failure or Preventive. Low impact + low frequency → Run to Failure (deliberately). Don't over-maintain non-critical assets — that budget belongs on critical ones.
What KPIs should a maintenance dashboard track?
Seven KPIs split between leading and lagging: OEE (holy grail), MTBF, MTTR, PM Compliance (target 90%+), Planned vs Unplanned Ratio (target 80/20), Corrective:Preventive Ratio (target 1:6), Maintenance Cost as % of ERV (target 2-4%). Track both leading and lagging — leading indicators predict next quarter's failures.
How long does it take to implement a hybrid maintenance strategy?
12-18 months from Level 1 to Level 4 in 5 phases:
Phase 1 Foundation + Criticality (Months 1-2),
Phase 2 Preventive Optimization (Months 3-5),
Phase 3 Autonomous Maintenance/TPM (Months 4-7),
Phase 4 Condition-Based + Predictive (Months 8-14),
Phase 5 Autonomous Ops with AI (Months 15-18).
Book a phased roadmap session tailored to your plant.