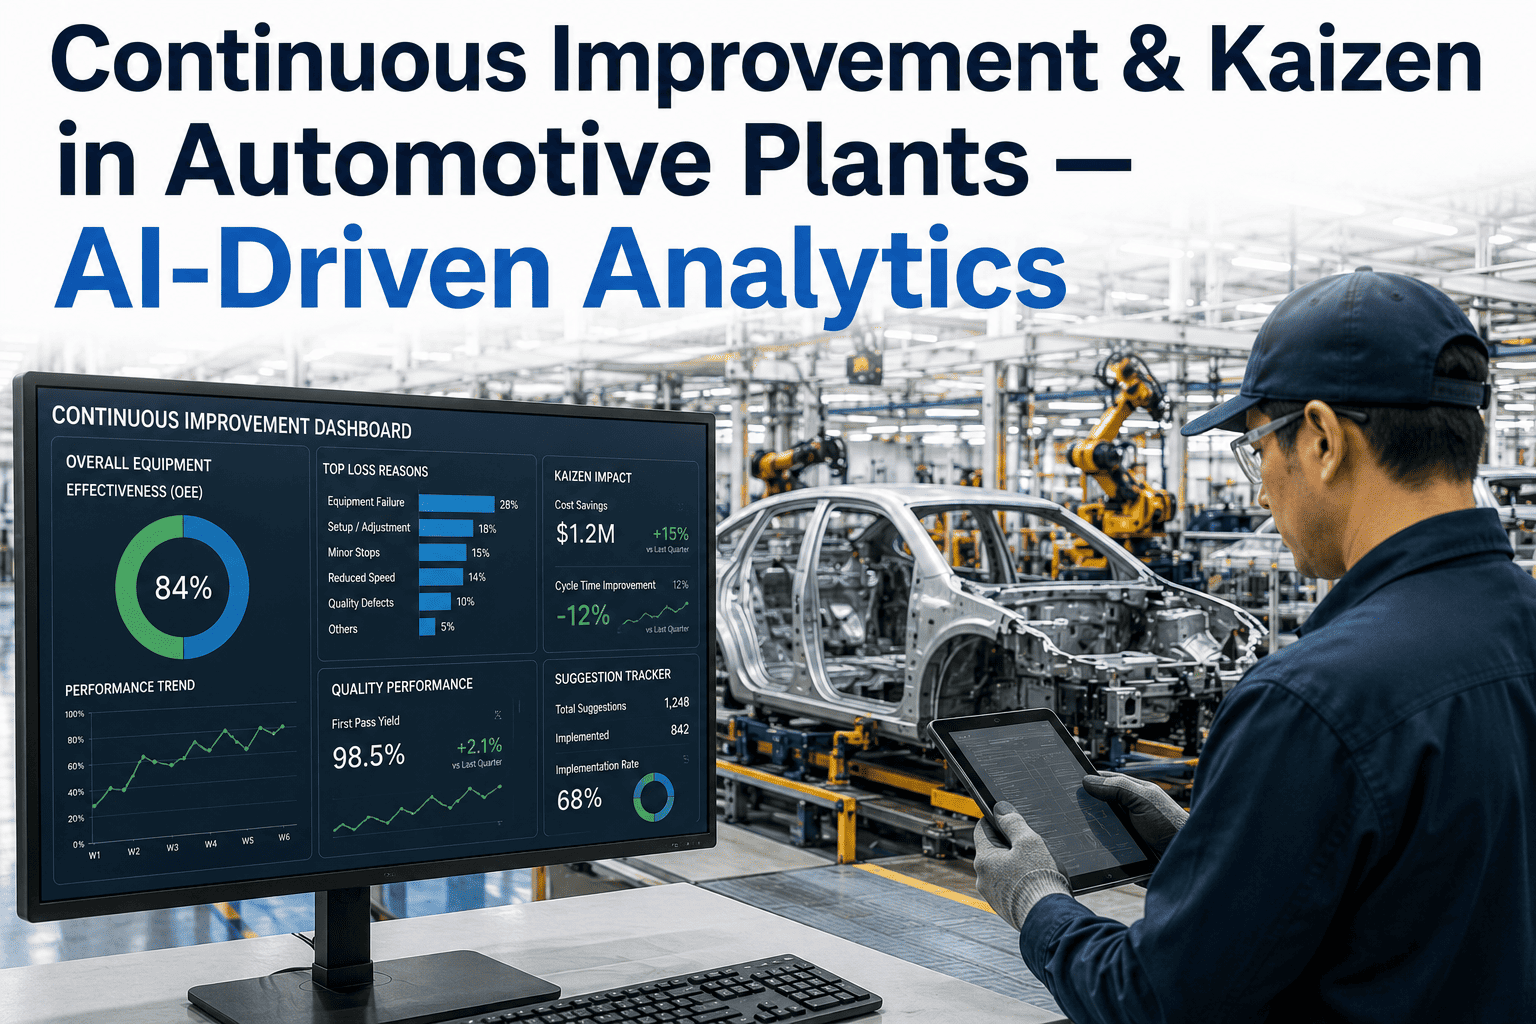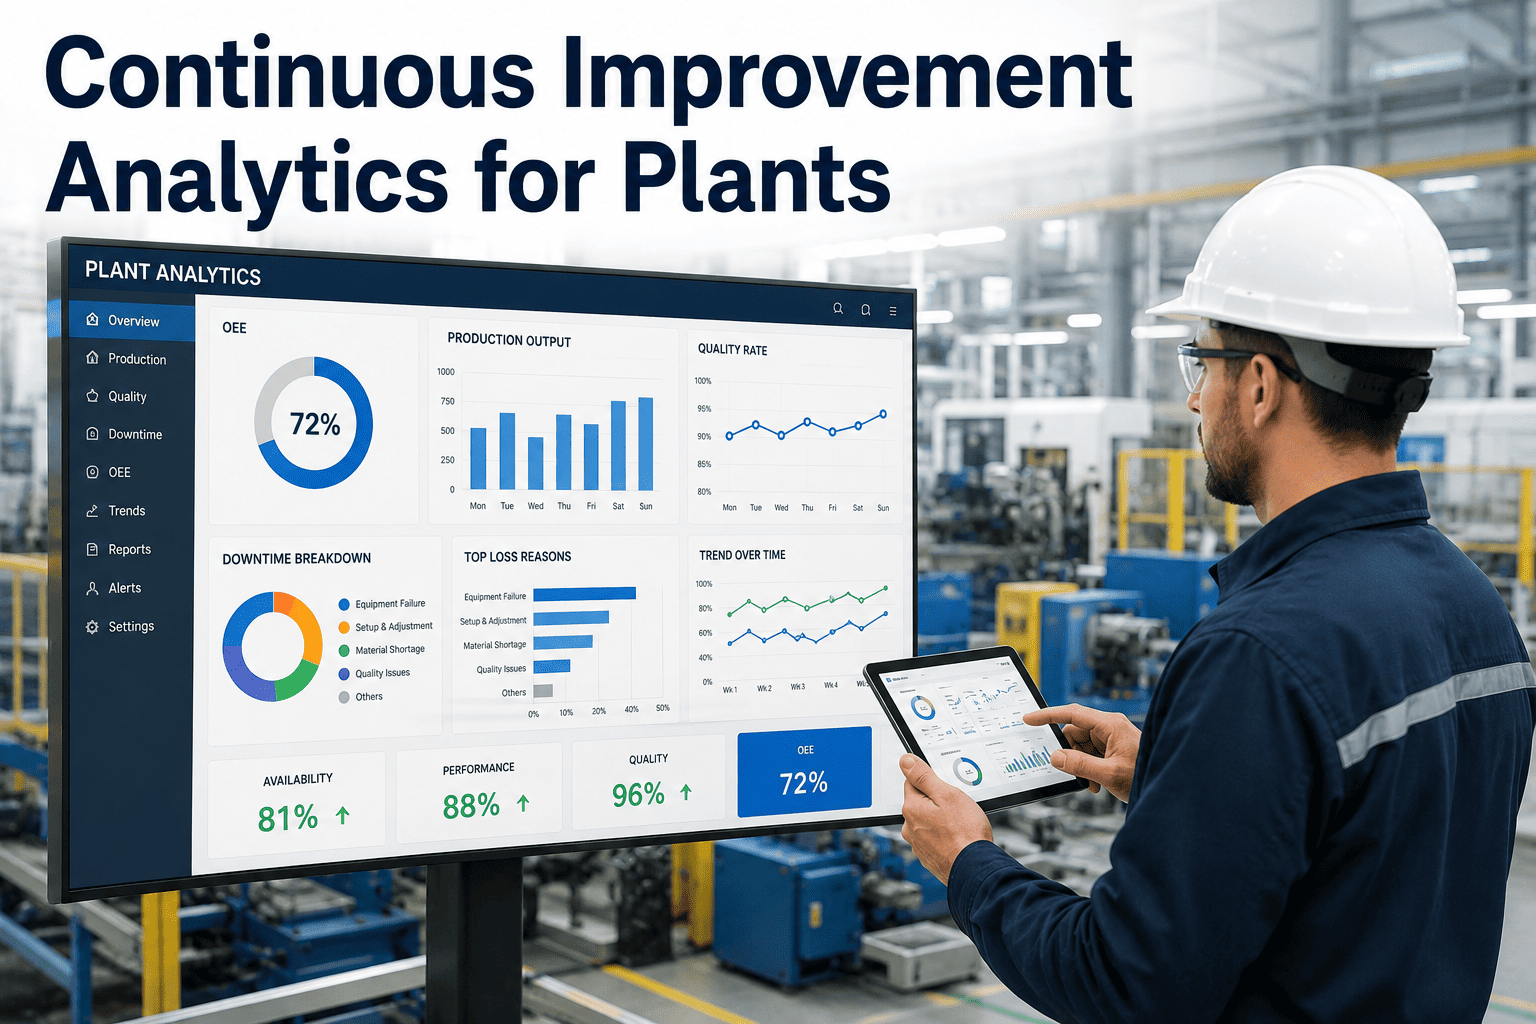
Every plant with a functioning continuous improvement programme has a kaizen backlog, and in almost every one of those plants, the backlog is prioritized by something other than actual financial impact. It is prioritized by which supervisor complained loudest at the last operations review, by which problem is most visible when a plant manager walks the floor, by which team has the most persuasive champion in the room, or simply by which project happened to be next on a list nobody has re-ranked in eighteen months. Meanwhile, the highest-value opportunity in the plant — a slow-bleeding inefficiency in a process nobody watches closely because it never triggers an alarm — sits unaddressed, quietly costing more than the visible, politically prioritized projects combined. Continuous improvement analytics exists to fix this: using AI to scan every process, every line, every shift simultaneously, and surface the ranked list of improvement opportunities by quantified financial impact — so the CI team's limited time goes to the problems that are actually worth solving first. Book a session with the iFactory continuous improvement team to see how data-driven opportunity scanning changes what your kaizen calendar looks like.
Production Efficiency · Continuous Improvement Analytics
Continuous Improvement Analytics: Let the Data Pick the Next Kaizen, Not the Loudest Voice in the Room
AI scans every process, line, and shift simultaneously to surface a ranked improvement opportunity backlog by quantified financial impact — replacing the politically prioritized kaizen calendar with one built on actual data.
Opportunity Backlog — Ranked by Data, Not Volume
1
Line 4 changeover time variance
$412K/yr
2
Station 7 micro-stoppage cluster
$298K/yr
3
Weld cell rework loop
$187K/yr
4
Paint booth idle-time pattern
$94K/yr
Ranked automatically from plant-wide process data — not from which supervisor raised it first.
Where CI Programmes Break Down
The Four Structural Problems That Limit Even Well-Resourced Kaizen Programmes
Continuous improvement programmes rarely fail from lack of effort or lack of methodology knowledge — most CI teams are staffed with genuinely skilled practitioners who know DMAIC, know how to run an effective kaizen event, and know how to build an A3. What limits programme impact is almost always structural: the mechanism by which improvement opportunities are identified and selected, not the mechanism by which selected opportunities are executed.
01
Silo Visibility
Each area supervisor, shift lead, or process owner sees only their own domain clearly. The CI team's opportunity pipeline is assembled from what individual silos surface — which means the highest-value opportunity in the plant is invisible if it sits in a process nobody with visibility across the whole plant is watching closely.
02
Squeaky Wheel Prioritization
Problems that are visible, loud, or politically championed get selected for kaizen events regardless of their actual financial impact relative to quieter, larger opportunities. A CI team's calendar fills with the projects that generated the most meeting-room attention, not the projects with the largest quantified savings potential.
03
Stale Backlog Ranking
Improvement backlogs are typically ranked once, at creation, and rarely re-scored as conditions change. A process that was the fifth priority a year ago may now be the top priority because a supplier change, a product mix shift, or equipment aging has changed its cost profile — but the backlog ranking has not moved to reflect it.
04
No Sustainment Validation
A kaizen event concludes, the A3 is filed, and the team moves to the next project — but whether the improvement actually held six months later is rarely tracked systematically. Improvements that quietly reverted go undetected, and the CI team's reported cumulative savings become progressively less trustworthy over time.
Plant-Wide Opportunity Scanning
How AI Surfaces Improvement Opportunities Across Every Process Simultaneously
AI-driven opportunity scanning applies a consistent analytical framework across every monitored process in the plant simultaneously — something no human CI team, however skilled, can do manually across dozens or hundreds of processes at once. The scanning approach draws on the same production, quality, and maintenance data already flowing through plant systems, applying statistical and pattern-detection methods to surface deviations, variances, and loss patterns that represent quantifiable improvement opportunity.
Variance Detection
Statistical scanning identifies processes with high variance in cycle time, changeover duration, quality yield, or throughput relative to their peer processes or their own historical baseline — high variance is a direct signal of untapped standardization opportunity, since the best-observed performance already demonstrates what is achievable.
Loss Category Aggregation
Six Big Losses data (breakdowns, changeover, minor stops, reduced speed, startup rejects, production rejects) is aggregated across every monitored process and ranked by total dollar cost — surfacing loss categories that individually seem manageable at each station but aggregate into a major opportunity across the plant.
Cross-Shift Comparison
Identical processes run by different shifts on the same equipment produce a natural experiment — comparing OEE, quality yield, and cycle time across shifts on the same line isolates process and behavioral variation from equipment variation, frequently revealing that a best-practice already exists somewhere in the plant and simply needs to be transferred.
Rework and Correction Loop Detection
Tracing units through the production sequence identifies processes with recurring rework, reinspection, or correction loops — the "hidden factory" that consumes capacity and labor without appearing as a formal downtime or scrap event, invisible to standard OEE reporting but fully visible in unit-level trace data.
See What Your Own Plant Data Is Already Telling You
iFactory Scans Your Existing Production, Quality, and Maintenance Data to Build a Ranked Opportunity Backlog
Most plants already generate the data needed to identify their highest-value improvement opportunities — it simply lives in disconnected systems that no one has connected and scored consistently. iFactory's opportunity scanning connects to your existing MES, quality, and maintenance systems and produces a financially ranked backlog within the first engagement.
Prioritization Scoring
The Formula That Converts Raw Opportunities Into a Ranked Kaizen Backlog
Not every high-cost opportunity is a good kaizen candidate, and not every easy fix is worth prioritizing over a harder, higher-value one. A defensible scoring formula weighs financial impact against implementation feasibility and confidence in the estimate — producing a ranking that reflects genuine priority rather than raw dollar figures alone.
Opportunity Priority Score
Priority = (Annual $ Impact × Confidence Factor) ÷ (Implementation Effort × Time-to-Value)
Where Confidence Factor reflects the statistical reliability of the underlying data (a variance pattern observed across 6 months of consistent data scores higher confidence than one observed over 3 weeks), Implementation Effort reflects estimated kaizen event resourcing and capital requirement, and Time-to-Value reflects how quickly the improvement will realize savings once implemented.
Annual $ Impact
Direct financial value of the identified variance or loss — calculated from actual production data, not estimated from a general assumption
Confidence Factor
Statistical reliability of the pattern — data volume, consistency across time periods, and whether the pattern holds across multiple shifts or products
Implementation Effort
Estimated resourcing — kaizen event duration, capital requirement, cross-functional coordination complexity, and change management scope
Time-to-Value
Expected duration between implementation and measurable savings realization — a quick-win with modest value can outrank a large but slow-to-realize opportunity
Kaizen Event Design
From Ranked Opportunity to Structured Event — How Data Shapes the Kaizen Charter
Once an opportunity is selected from the ranked backlog, the same data that surfaced and quantified it directly informs the kaizen event's scope, target, and success metric — replacing the often-vague charter statements that result when a kaizen topic is selected primarily because "everyone knows it's a problem" rather than from quantified analysis.
01
Data-Derived Problem Statement
The opportunity scan output provides a precise, quantified problem statement — "Line 4 changeover time varies from 22 to 61 minutes across the 8 SKU changeovers performed weekly, with the top-quartile changeovers demonstrating that 28 minutes is achievable" — rather than a general statement like "changeovers take too long."
02
Root Cause Hypothesis from Pattern Analysis
Where the scanning identified specific correlating factors (a particular operator combination, a particular SKU transition sequence, a particular tooling configuration associated with the longest changeovers), the kaizen team enters the event with a data-informed hypothesis to test rather than starting root cause analysis from a blank page.
03
Quantified Target Setting
Because the best-observed performance is already known from the data (the top-quartile changeover time in the example above), the kaizen target is grounded in demonstrated achievability rather than an arbitrary percentage improvement goal — the team is working to standardize toward a proven best case, not guessing at what might be possible.
04
Pre-Defined Success Metric and Monitoring Point
Since the improvement is being implemented against a process already instrumented and monitored by the same system that surfaced the opportunity, the post-kaizen success metric requires no new measurement infrastructure — the same data stream that identified the problem continues tracking performance after the event concludes.
Sustainment Validation
Proving the Improvement Actually Stuck — The Step Most CI Programmes Skip
The most common failure mode in continuous improvement programmes is not a bad kaizen event — it is a good kaizen event whose gains silently erode over the following months because nobody was watching to confirm the new standard was actually sustained. Since the opportunity scanning system continuously monitors the same processes it identified, sustainment validation becomes a natural extension of the existing monitoring rather than a separate, easily-skipped audit task.
Automated Drift Detection
The same statistical monitoring that identified the original variance continues tracking the process after the kaizen event, automatically flagging if performance begins drifting back toward the pre-improvement baseline — catching sustainment failure within weeks rather than discovering it a year later during an unrelated review.
Verified Savings Attribution
Rather than a one-time before/after comparison at the kaizen event's close-out, ongoing monitoring provides a continuously validated savings figure — the CI team's reported cumulative impact reflects sustained, current performance rather than a snapshot that may no longer be accurate.
Cross-Line Transfer Verification
When an improvement is transferred from its originating line to sister lines or sister plants, the monitoring system confirms whether the transfer actually achieved the same improvement magnitude — many transferred best practices underperform their origin site, and this pattern is only visible with continued measurement.
CI Programme KPIs
Six Metrics That Define a Data-Driven Continuous Improvement Programme
Opportunity Backlog Coverage
Target: 100% of processes scanned
Percentage of monitored plant processes included in the automated opportunity scanning system. Any unscanned process represents a blind spot — a potential top-priority opportunity that would never surface for consideration.
Data-Sourced Kaizen Percentage
Target: >70%
Percentage of kaizen events selected from the data-ranked opportunity backlog versus selected through traditional escalation, request, or observation. A rising percentage indicates the CI programme's prioritization discipline is maturing away from politically or visibility-driven selection.
Estimate-to-Actual Accuracy
Target: within ±15%
How closely the opportunity scan's predicted financial impact matches the actual realized savings after kaizen implementation. Tracked to continuously calibrate the confidence factor in the scoring formula and build organizational trust in the scan's financial estimates.
Sustainment Rate at 6 Months
Target: >85%
Percentage of completed kaizen improvements still measurably holding their target performance level 6 months after event close-out. The single most revealing metric for programme integrity — low sustainment rates indicate the change management and standard work embedding process needs strengthening, not that more kaizen events are needed.
Backlog Re-Ranking Frequency
Target: Continuous / weekly
How frequently the opportunity backlog is re-scored as new data arrives, versus static ranking set once and rarely revisited. Continuous re-ranking ensures the CI team's next kaizen selection reflects current plant conditions rather than a snapshot from months earlier.
Cumulative Validated Savings
Trend: sustained growth
Total financial savings from all completed kaizen events, adjusted continuously for any sustainment drift detected by ongoing monitoring — a trustworthy figure precisely because it accounts for reversion rather than only counting the initial post-event measurement.
From the CI Programme Floor
“
I have led continuous improvement programmes at four different manufacturing organizations over my career, and the single most consistent pattern across all of them is that the CI team's actual impact is capped not by their skill at running kaizen events, but by the quality of the opportunity selection feeding those events. A brilliantly executed kaizen on a mediocre opportunity still produces a mediocre result. The uncomfortable truth I had to accept relatively late in my career is that most of our kaizen calendar, across most of those years, was built from what was visible and vocal rather than from what was actually most valuable — and I only really understood the scale of that gap once we started running systematic data scans across the plant and found opportunities worth two to three times our best-performing kaizen projects, sitting in processes that had simply never generated enough noise to attract attention. The teams that adopt this kind of data-driven opportunity discovery do not become better at kaizen execution overnight — the methodology skills were already there. What changes is that the same execution skill is now consistently pointed at the highest-value target instead of whichever target happened to be loudest.
Priscilla Amankwah-Reyes
Lean Six Sigma Master Black Belt · Continuous Improvement Director · 23 years leading CI programmes across automotive, aerospace, and consumer goods manufacturing · Former VP Operational Excellence, multi-plant automotive components manufacturer
CI Team Questions
Continuous Improvement Analytics — Frequently Asked
Does AI-driven opportunity scanning replace the CI team's judgment, or does it work alongside it?
AI opportunity scanning is a prioritization and discovery tool, not a replacement for CI team judgment — it surfaces and financially quantifies opportunities across the whole plant that a human team could not manually identify at the same scale, but the decision about which opportunities to pursue, how to design the kaizen event, and how to lead the change management still requires the CI team's expertise. The most effective implementation model treats the scan output as an input to the CI team's existing prioritization discussion, replacing "which problem got the most complaints this month" with "here are the top-ranked opportunities by quantified financial impact, and here is the supporting data" — the team still applies judgment about feasibility, organizational readiness, and strategic fit, but that judgment now operates on a foundation of genuine data rather than anecdote and visibility. For a walkthrough of how the scan output integrates into a typical CI team's existing review cadence, book a session with the iFactory CI analytics team.
What data do we need to have in place before opportunity scanning can produce useful results?
The minimum viable dataset includes production output and downtime data (from MES or equivalent), quality inspection and rework records, and basic maintenance work order history — most plants with a functioning MES and quality system already generate this data, even if it has never been aggregated and analyzed at the plant-wide level the scanning approach requires. Richer data sources — unit-level traceability connecting individual parts through the production sequence, detailed cycle time data at the station level, and shift-level performance breakdowns — meaningfully improve the granularity and confidence of the opportunities identified, but are not strict prerequisites for an initial scan that will still surface significant, actionable findings from more basic data. Plants beginning without unit-level traceability typically see the scanning system identify strong opportunities in the categories most visible from aggregate data (changeover variance, downtime pattern concentration, shift-to-shift OEE gaps) while flagging where additional instrumentation would unlock deeper analysis in specific high-potential areas. Contact our support team for a data readiness assessment specific to your current systems.
How do we handle opportunities that the scan identifies as high value but that require capital investment beyond typical kaizen event scope?
Not every opportunity the scan surfaces is a good fit for a traditional one-week kaizen event — some represent capital project candidates rather than process improvement kaizen targets, and the prioritization scoring should distinguish between these categories rather than forcing every opportunity into the same event format. The implementation effort factor in the priority scoring formula naturally reflects this: an opportunity requiring significant capital investment scores differently than one addressable through standard work changes and minor process adjustments, and the ranked backlog should be reviewed with this distinction in mind. High-value, high-capital opportunities are typically routed to the capital planning process with the same quantified financial justification the scan produced — giving the capital request a stronger evidence base than the traditional capital justification process usually provides, since the projected savings are grounded in actual observed process variance rather than vendor claims or engineering estimates alone. The CI team's traditional kaizen calendar then focuses on the subset of the ranked backlog addressable through standard kaizen event scope and resourcing.
How does opportunity scanning distinguish between a genuine improvement opportunity and normal, expected process variation?
This distinction is fundamental to the scanning methodology and is handled through statistical process control principles applied at scale — every process has natural, expected variation, and the scanning system establishes a statistical baseline for each monitored process using historical data before flagging any deviation as a potential opportunity. A process performing within its established statistical control limits, even if that performance level is not ideal, is treated differently from a process showing variance beyond what its own history would predict, or performance significantly below what comparable peer processes or shifts demonstrate is achievable. This approach avoids the common failure mode of naive threshold-based flagging, which either generates excessive false-positive opportunities from normal variation or misses genuine opportunities because a fixed threshold does not account for each process's unique baseline characteristics. The confidence factor in the priority scoring formula directly reflects this statistical rigor — opportunities identified from data showing consistent, statistically significant deviation score higher confidence than those from limited or noisy data, appropriately deprioritizing uncertain signals relative to well-established patterns.
How long does it take to see the first ranked opportunity backlog after starting an engagement with iFactory?
For plants with existing MES, quality, and maintenance data systems already in operation, an initial opportunity backlog covering the connected data sources is typically produced within 3 to 5 weeks of engagement start — this timeline covers data source connection, historical baseline establishment (requiring a minimum of several months of historical data for statistically reliable pattern detection), and initial scan execution and validation with the CI team. The initial backlog is deliberately treated as a starting point for review and refinement with the CI team's domain expertise, not a final, unquestionable ranking — the first several weeks of live operation typically involve calibrating the scoring weights and validating early findings against the team's own knowledge of the plant before the system is fully trusted as the primary prioritization input. Full integration into the CI team's ongoing kaizen selection process, including the continuous re-ranking and sustainment monitoring capabilities, typically reaches steady-state operation within 2 to 3 months. Book a scoping session to discuss a timeline specific to your current data systems and CI programme maturity.
Stop Selecting Kaizen Projects by Who Complained Loudest
Let Your Plant Data Rank the Opportunities — Then Let Your CI Team Do What They Do Best
iFactory's continuous improvement analytics scans every monitored process in your plant, ranks improvement opportunities by quantified financial impact, informs kaizen event design with data-derived problem statements and targets, and continuously validates that improvements actually sustain — turning your kaizen calendar into a genuinely prioritized programme instead of a reactive one.