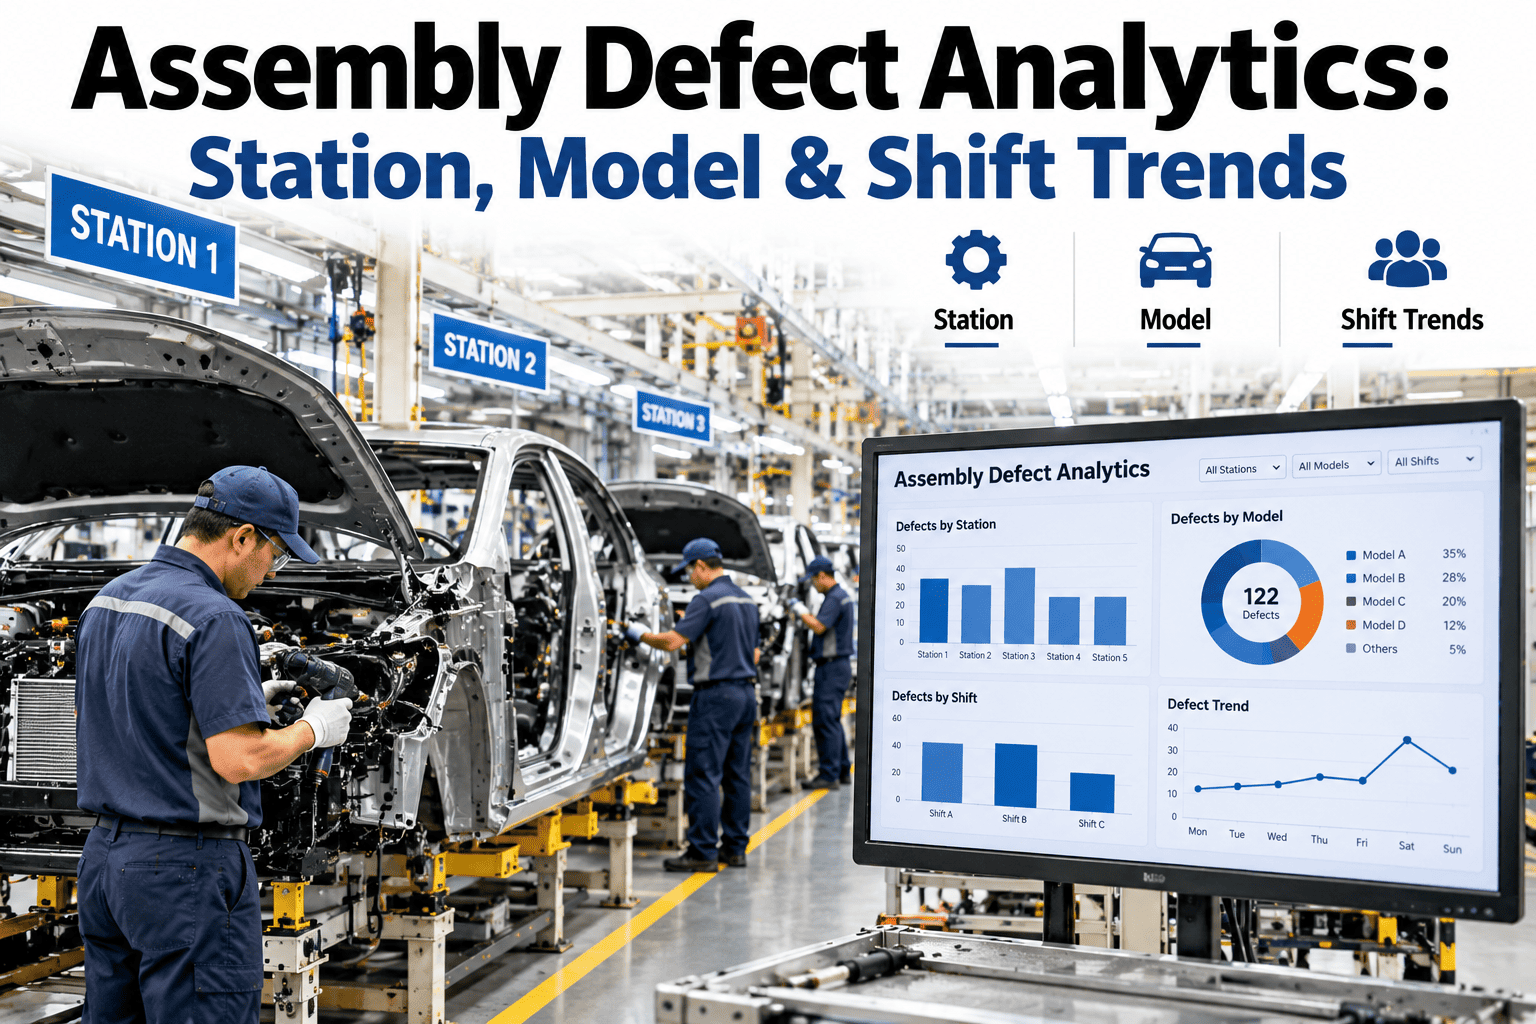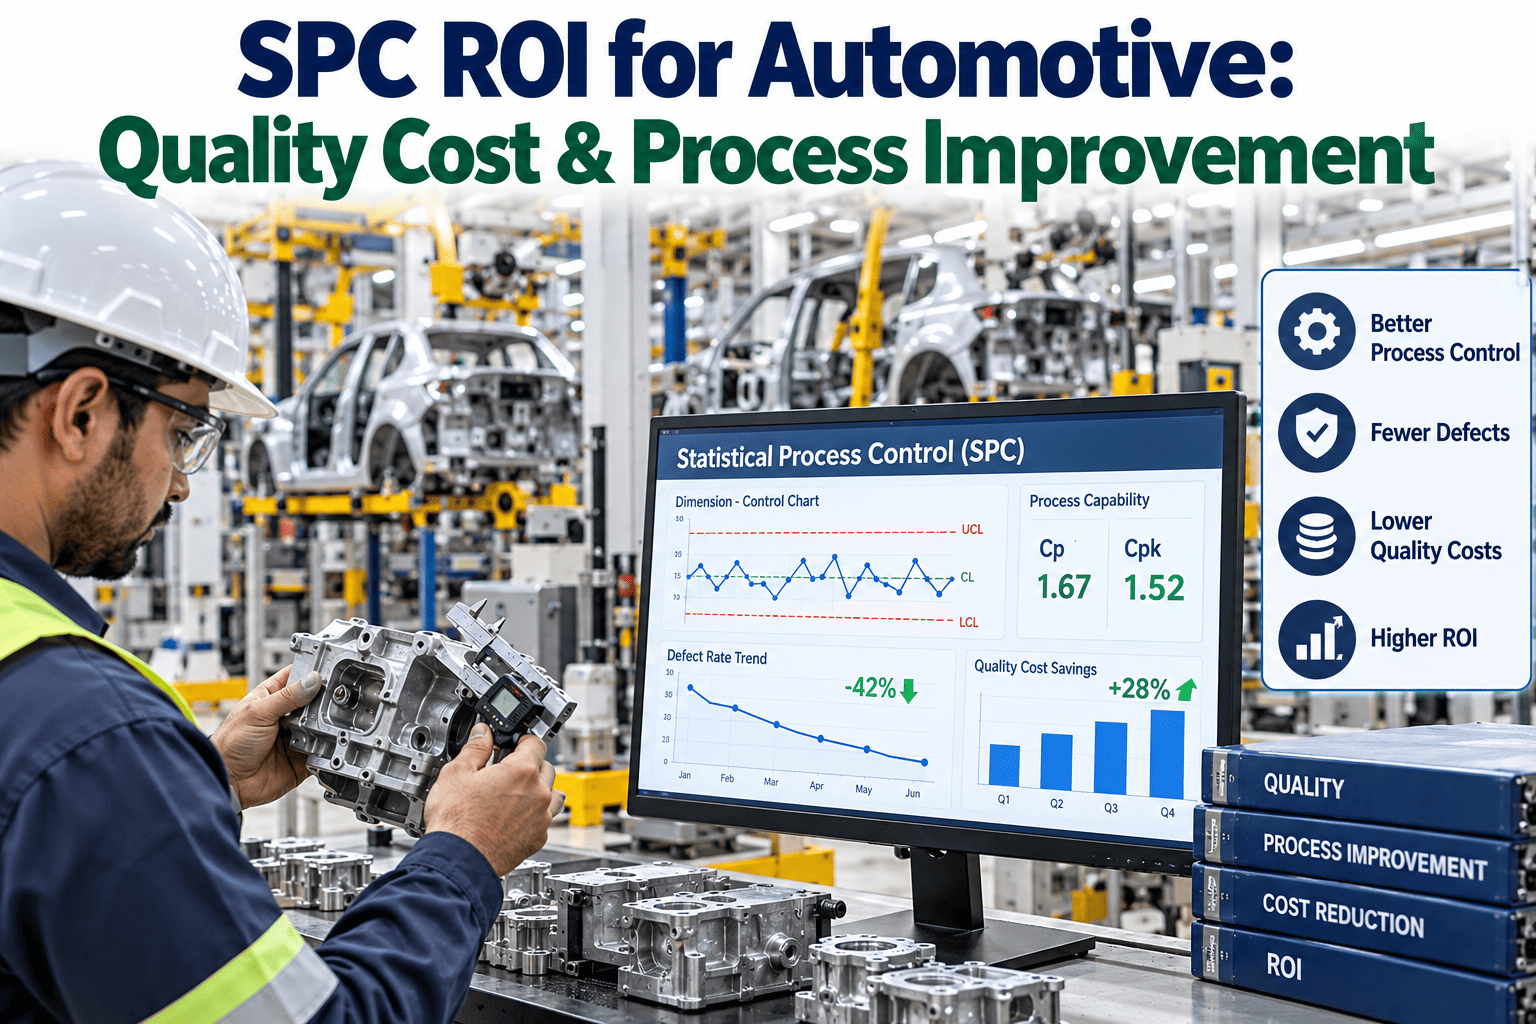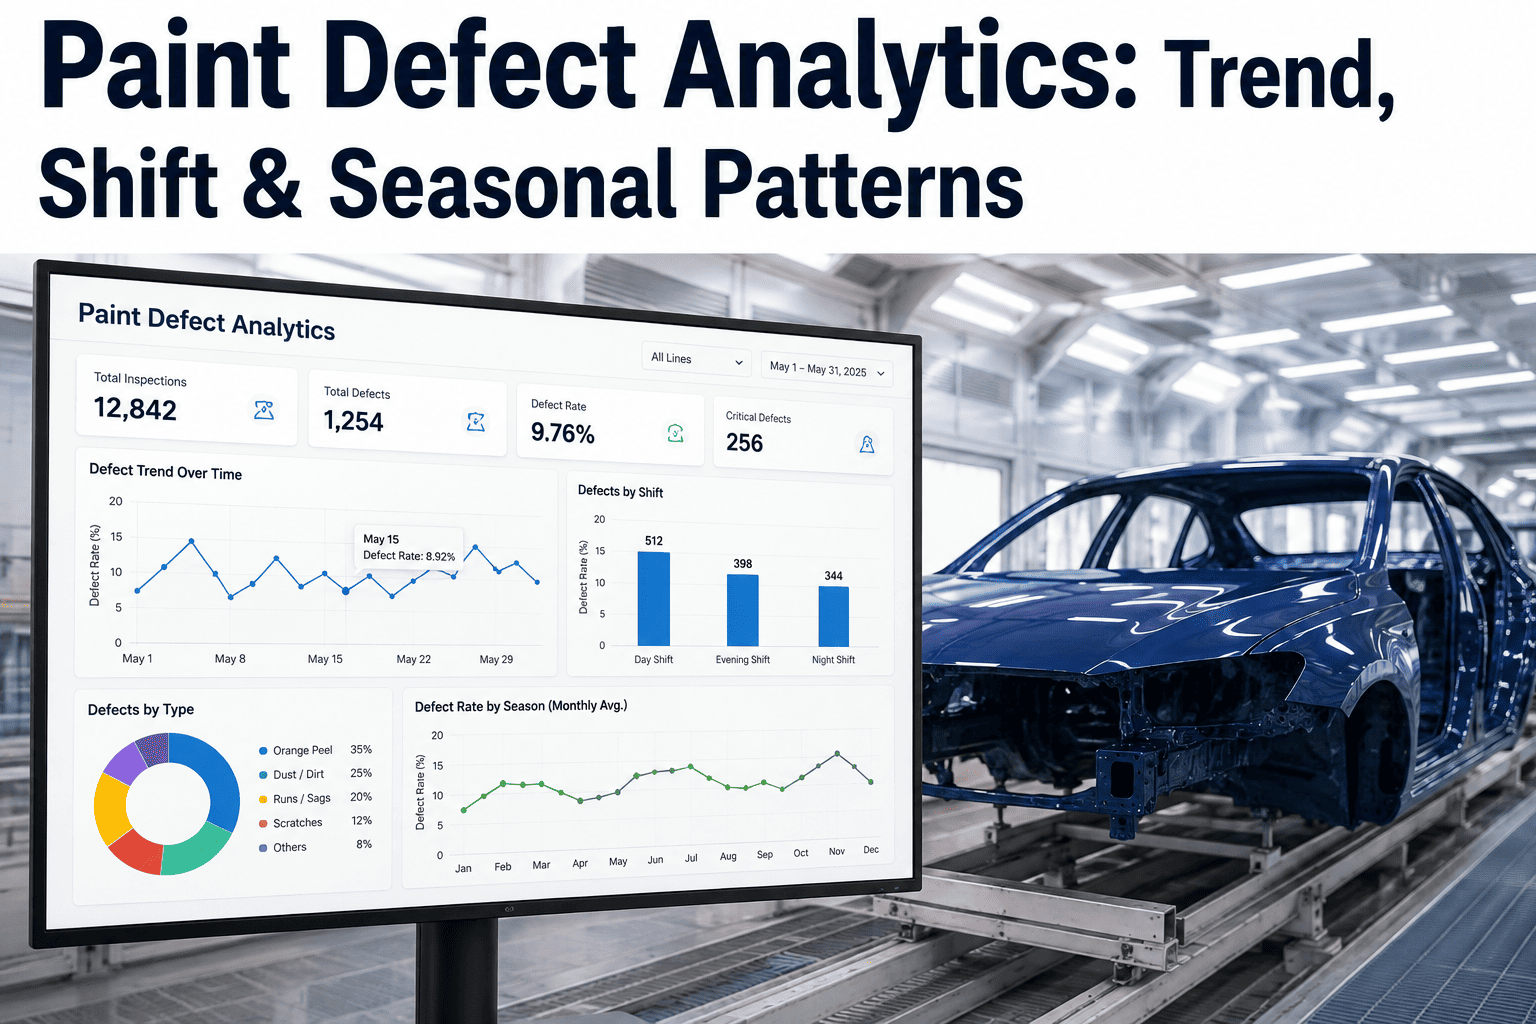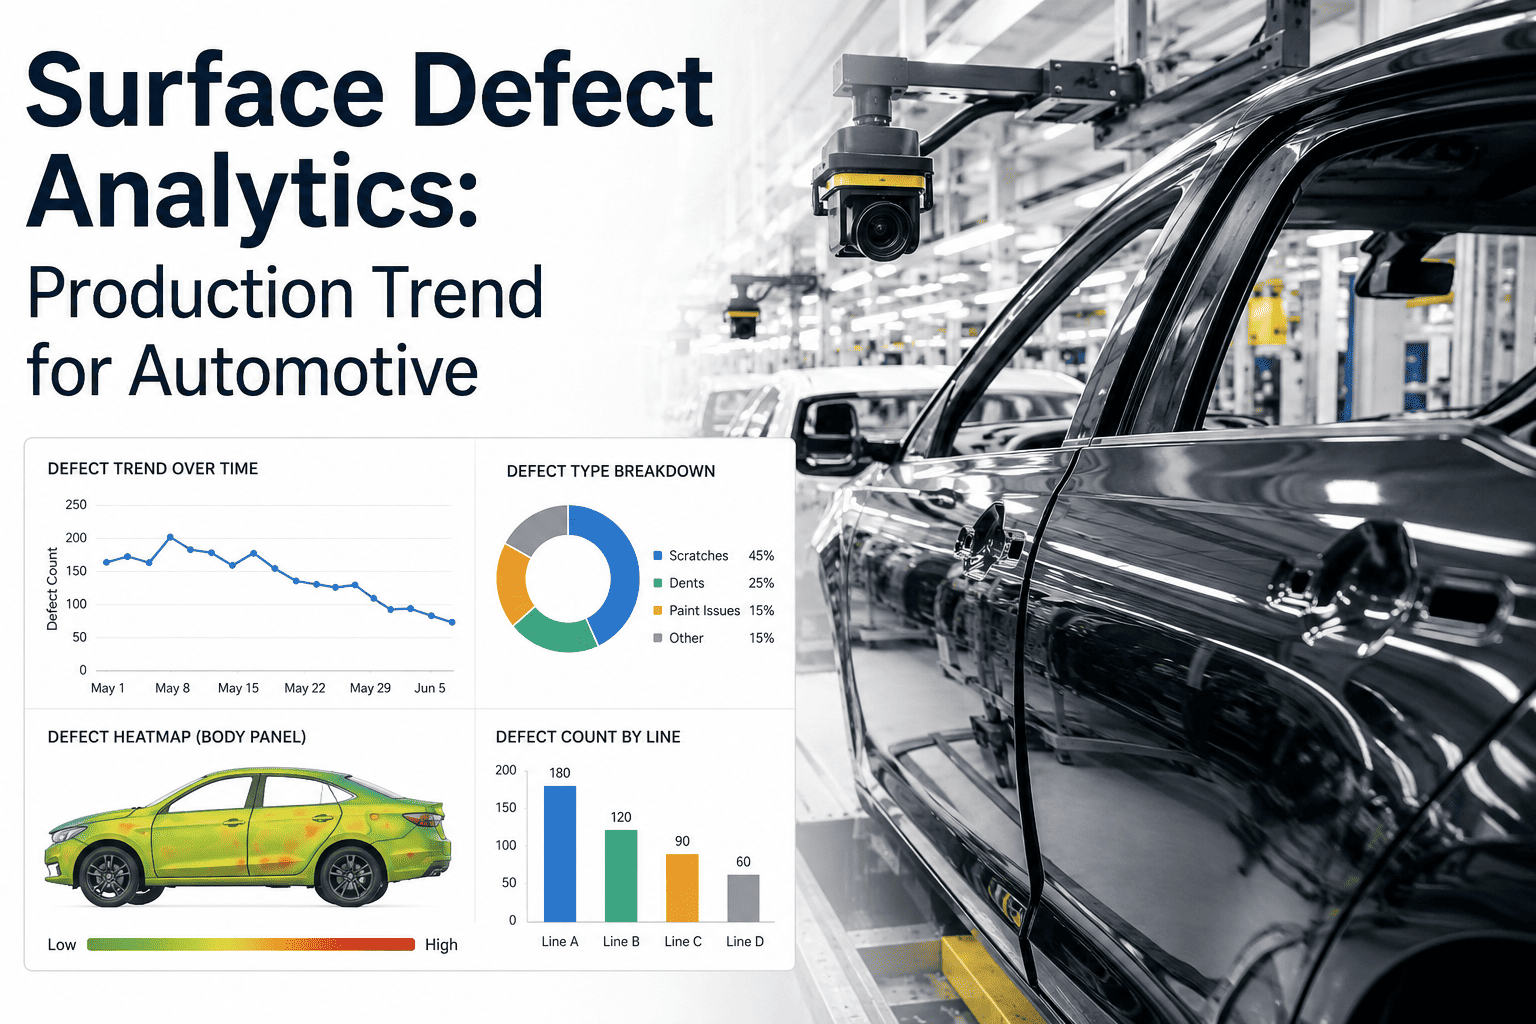
A plant running a dozen vision inspection stations generates an enormous volume of defect data every shift, but volume alone doesn't translate into insight unless someone is actually slicing that data by the variables that matter: which station, which shift, which model variant, which supplier lot. Too often this data sits in per-station dashboards showing today's pass rate and little else, while the more valuable question, whether a specific defect type is concentrated on one shift, one line, or one model variant, never gets asked because the data was never organized to answer it. This page covers how to structure defect data for meaningful correlation analysis, which cross-cuts tend to reveal the most actionable patterns, and how to avoid drawing false conclusions from data that looks correlated but isn't. You can book a demo to see how iFactory organizes defect data across stations for pattern discovery your current dashboards aren't built to surface.
The Pattern Is Usually in the Cross-Cut, Not the Headline Defect Rate
iFactory slices defect data by station, shift, model variant, and supplier lot so patterns hidden in a single blended pass rate become visible and actionable.
Which inspection point sees the highest defect concentration
Whether defect rate varies meaningfully across shifts
Whether a specific trim or body style trends differently
Whether a component batch correlates with a defect spike
Blended Metrics Average Away Exactly the Detail Worth Finding
A plant-wide or even a single-station defect rate is a useful headline number, but it's also a statistical average that can hide sharply different underlying patterns. A station showing a comfortable 98 percent pass rate overall might be running at 99.5 percent on two shifts and 94 percent on a third, a difference that matters enormously for root cause investigation but that the blended number completely obscures. The averaging effect gets worse the more dimensions get blended together, station, shift, model, and supplier data combined into one number tells you almost nothing about where to actually look for a fix.
The Cross-Cuts Most Likely to Reveal Something Actionable
Not every possible way of slicing defect data is equally likely to reveal something useful, and trying to analyze every conceivable combination of variables at once tends to produce noise rather than insight. A handful of cross-cuts consistently prove most valuable across automotive plants, and starting there tends to be more productive than an unstructured, exploratory analysis across dozens of variables simultaneously.
Consistent differences in defect rate across shifts often point to training gaps, staffing differences, or process parameter drift specific to a particular crew or time window.
A defect concentrated on one trim or body style, while others run clean, usually points to a variant-specific component, tooling setup, or process step.
Defects clustering around a specific supplier batch, rather than spreading evenly across time, is one of the strongest signals of an incoming component issue.
A defect appearing at a downstream station that correlates with conditions at an earlier station suggests a root cause upstream of where the defect is actually detected.
Not Every Pattern That Looks Real Actually Is
The flip side of powerful cross-cut analysis is the real risk of finding patterns that look statistically interesting but don't reflect a genuine causal relationship, particularly when slicing a dataset across many dimensions simultaneously increases the odds that some combination will show an apparent pattern purely by chance. Being disciplined about validating a pattern before acting on it matters as much as having the analytical capability to find patterns in the first place.
| Validation Check | Why It Matters |
|---|---|
| Does the pattern hold across multiple time periods? | A pattern present only in one narrow window is more likely to be noise than a real, sustained trend |
| Is there a plausible physical explanation? | A correlation without any reasonable causal mechanism deserves more skepticism before acting on it |
| Does sample size support the conclusion? | A pattern based on a handful of units carries far less confidence than one based on hundreds |
| Does the pattern predict forward, not just explain backward? | A genuine pattern should continue showing up in new data, not just fit what's already been observed |
Turning a Confirmed Correlation Into an Investigation
Finding a statistically solid pattern is only the first half of the value; the second half is routing that pattern to the right team with enough specific context that they can actually investigate it efficiently. A pattern showing a defect concentrated on a specific shift should go to that shift's supervisor with the specific data behind it, not to a generic quality distribution list where it competes with dozens of other lower-priority items for attention.
Route to shift supervisors and training coordinators with specific data on which defect types and time windows are involved.
Route to the program or platform engineering team responsible for that specific model variant's component and process specifications.
Route to supplier quality for corrective action discussion, with the specific lot and measurement data attached.
Route to process engineering for the upstream station, since the defect's origin sits earlier in the line than where it's actually being caught.
What Needs to Be True for Cross-Cut Analysis to Actually Work
Meaningful cross-cut analysis depends entirely on the underlying defect data being tagged consistently with the dimensions you want to slice it by. If shift, model variant, and supplier lot aren't captured reliably alongside every inspection result, no amount of analytical sophistication can recover that missing context after the fact. This makes data capture discipline at the point of inspection just as important as the analysis performed downstream.
Every inspection record needs an accurate shift tag tied to when the unit was actually produced, not just when it happened to be inspected.
Build data needs to capture specific trim, body style, and option content, since blended model-year-level data can hide variant-specific patterns.
Component serial or lot data needs to be captured at the point of installation, not reconstructed after the fact from approximate date ranges.
A shared defect classification scheme across every station makes it possible to aggregate and compare defect types meaningfully across the whole plant.
Building Cross-Cut Review Into Existing Quality Meetings
The analytical capability to slice defect data by shift, variant, and supplier lot only creates value if someone actually looks at it on a regular basis, rather than treating it as a tool reserved for special investigations after a problem has already been noticed some other way. Building a habit of reviewing key cross-cuts as part of an existing weekly or monthly quality review, rather than creating an entirely separate meeting cadence, tends to be the more sustainable way to keep this analysis part of the routine.
A useful starting practice is to pick two or three of the most consistently valuable cross-cuts, shift-level defect rate and supplier lot correlation are common choices, and make reviewing those specific views a standing agenda item, rather than trying to review every possible combination every time. Over time, as the team builds familiarity with what normal variation looks like within each cross-cut, deviations that warrant deeper investigation become easier to spot quickly during a routine review rather than requiring a dedicated analytical exercise each time.
Isolating a Shift-Specific Defect Pattern Hidden in a Healthy Overall Rate
A weld inspection station's overall pass rate remained comfortably within target for months, giving no indication of an underlying problem when viewed as a single blended metric reviewed at the weekly quality meeting.
Breaking the same data down by shift revealed one shift running measurably higher defect rates on a specific weld joint than the other two, a difference the blended number had fully absorbed. Investigation traced it to a training gap on a recently rotated operator, addressed through targeted retraining rather than a broader, unnecessary process change that the blended data alone would never have pointed toward.
A Practical Starting Point for Cross-Cut Analytics
Start with shift-level or supplier-lot analysis on your highest-defect-rate station rather than attempting comprehensive analysis across every station and dimension at once.
Confirm shift, variant, and lot data are captured reliably for that station before investing further in analysis built on top of it.
Build the chosen cross-cut into a standing quality meeting agenda rather than creating a separate analytical review cycle.
Once the team is comfortable interpreting one cross-cut reliably, extend the same approach to additional stations and dimensions.