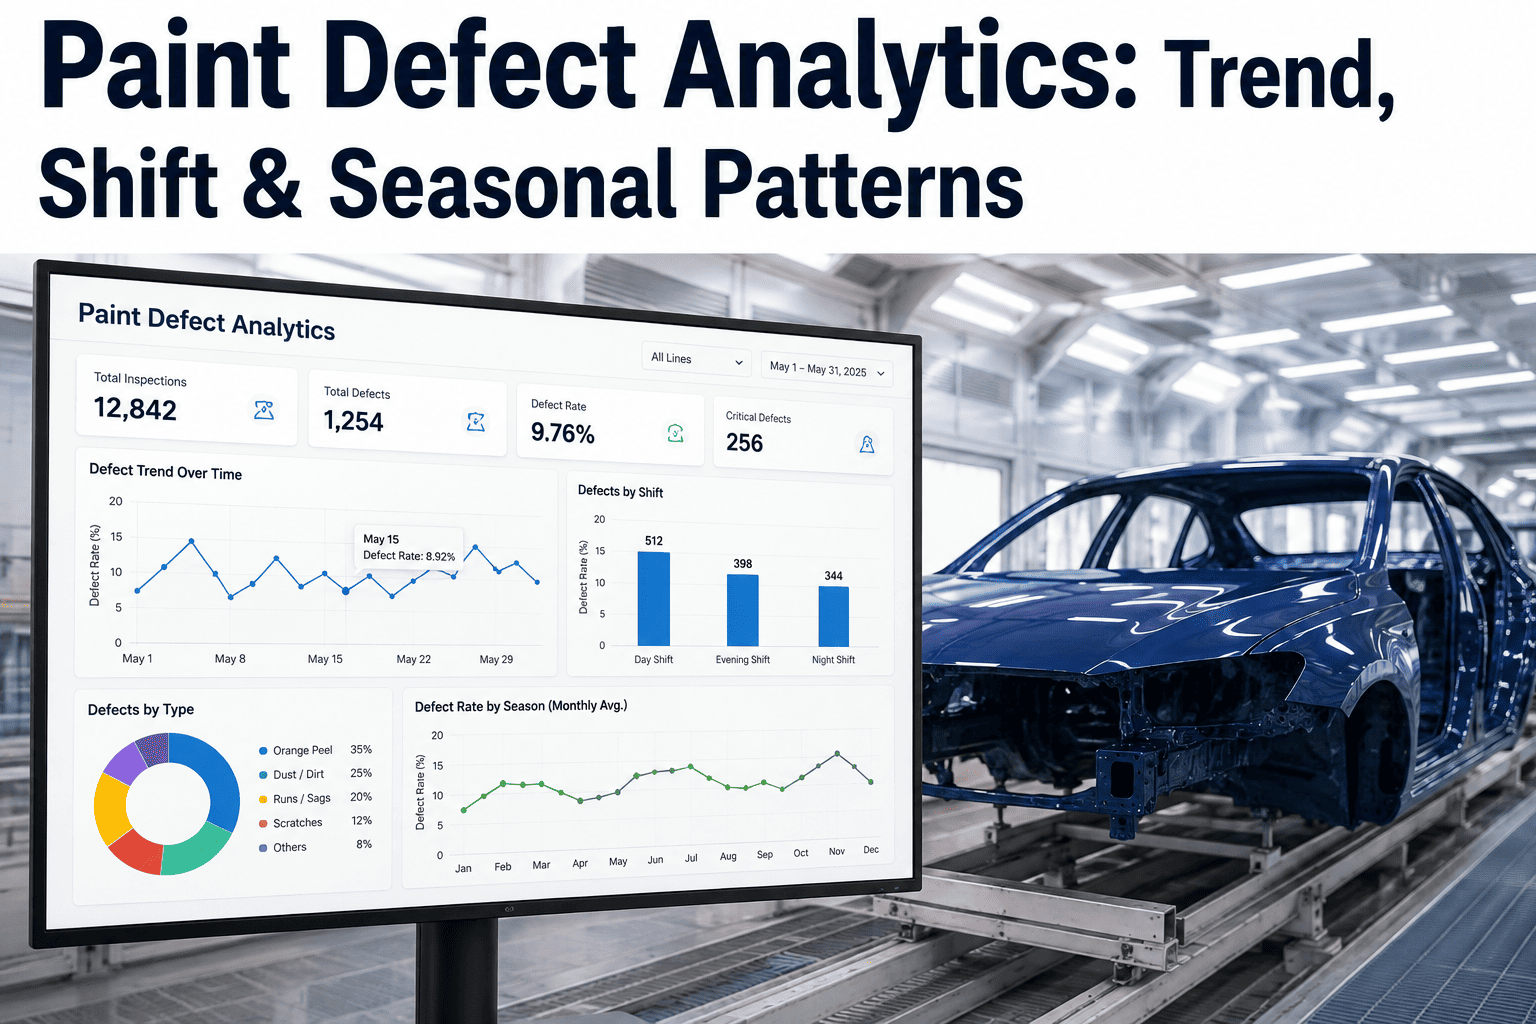
A paint shop that logs every defect but never looks across the logs is sitting on a pattern it cannot see. The orange peel rate that quietly doubles every August. The dirt nib cluster that only shows up on second shift. The solvent pop rate that tracks almost exactly with a specific paint batch number. None of these patterns are visible in a single day's defect count, and none of them get found by a quality engineer scanning yesterday's numbers. They surface only when defect data is analyzed across weeks and months, cut by shift, season, and material lot, looking for correlations a day-by-day view can never reveal. iFactory's analytics platform runs this correlation continuously across every defect your AI vision system captures, so the pattern gets found in weeks instead of years. To see this analysis run against your own paint shop's defect history, book a demo.
AUTOMOTIVE PAINT DEFECT DETECTION · DATA ANALYTICS
The Pattern Was Always in the Data, It Just Needed the Right Cut
iFactory correlates every logged defect against shift, season, environmental conditions, and material batch automatically, surfacing the hidden pattern behind a rising defect rate instead of leaving it buried in a spreadsheet nobody has time to mine.
WHY THE PATTERN STAYS HIDDEN
A Daily Defect Count Cannot Show You What a Trend Line Can
Most paint shops already collect defect data. The AI vision system logs every detected defect with location, severity, type, and timestamp automatically. What is far less common is actually mining that accumulated data for the correlations sitting inside it, because a daily or even weekly quality report is built to answer "how did we do today," not "what has been quietly changing over the last three months."
01
Daily Noise Hides Weekly Signal
A defect rate bounces around naturally day to day, and a gradual upward drift over several weeks is easy to miss inside that normal noise unless someone is deliberately tracking the trend line, not the daily number.
02
Shift Handovers Obscure Shift-Specific Patterns
A defect rate that is meaningfully worse on one specific shift gets averaged away in a plant-wide daily total, unless the data is deliberately segmented by shift before anyone looks at it.
03
Seasonal Change Is Slow Enough to Miss
A humidity-driven defect pattern that builds gradually across a season looks like ordinary month-to-month variation unless it is compared explicitly against the same period in a prior year.
04
Material Batch Data Lives in a Different System
Defect logs and paint batch records typically sit in separate systems, so correlating a defect spike against a specific material lot requires a manual cross-reference almost nobody has time to run routinely.
None of these four reasons reflects a lack of diligence on a quality team's part. They are structural gaps in how defect data typically gets reviewed, and closing them is a matter of analysis design, not additional inspection effort. A plant that already logs highly detailed defect data at the point of detection has, in most cases, already done the harder part; the gap is almost always in how that data gets used afterward, not in how much of it exists.
THREE AXES OF ANALYSIS
Where the Hidden Correlations Actually Live
Nearly every recurring paint defect pattern traces back to one of three cuts of the data: when it happened, what the environment was doing at the time, or which material batch was in use. Structuring analysis around these three axes deliberately is what turns a pile of logged defects into an actual diagnosis.
Shift and Time-of-Day Patterns
Defect rates compared across shifts and even hours within a shift, since equipment behaves differently as it warms up, wears through a shift, or is handled differently by different crews.
Seasonal and Environmental Correlation
Defect rates compared against booth temperature, humidity, and time of year, since spray performance and paint viscosity both shift meaningfully with ambient conditions.
Material Batch and Lot Correlation
Defect rates compared against specific paint batch, hardener lot, and thinner supply, since a formulation or storage issue in one lot can produce a defect signature that looks like a process problem until the batch link is made.
A defect spike rarely announces which of these three axes it belongs to on its own. It takes systematically checking a rising defect rate against all three before the actual driver becomes clear, which is exactly the kind of repetitive cross-referencing that is impractical to do manually but straightforward to automate once the underlying data is connected. It is also common for more than one axis to be involved at once — a material batch issue that only produces a visible defect under a specific humidity range is a genuine two-axis interaction, and finding it requires checking combinations, not just each axis independently.
See what patterns are already sitting in your defect logs
iFactory runs shift, seasonal, and material correlation against your existing defect history and shows you what's actually driving your current defect rate.
A WALKTHROUGH
How a Real Pattern Gets Found and Confirmed
The value of this kind of analysis is easiest to see worked through a concrete example, since the sequence is the same whether the underlying cause turns out to be a shift issue, a seasonal one, or a material one.
1
A Trend Line Crosses a Statistical Threshold
Orange peel rate on one paint line has been climbing steadily for three weeks, a pattern invisible in any single day's count but obvious once the trend is tracked continuously.
2
The Defect Data Is Cut by Shift
The rise turns out to be concentrated almost entirely on second shift, immediately narrowing the search away from a plant-wide material or equipment issue.
3
Environmental Data Is Checked Against the Shift Window
Booth humidity readings during second shift show a consistent spike starting three weeks ago, aligning with when a specific HVAC scheduling change took effect.
4
The Correlation Is Confirmed Against the Known Failure Mode
Humidity spikes preceding orange peel is a documented, well-understood relationship, so the correlation lines up with an established mechanism rather than a coincidental pattern.
5
A Targeted Fix Replaces a Broad Guess
The HVAC schedule for second shift gets corrected specifically, rather than the plant applying a broad, unfocused process change across every shift on every line.
What would otherwise take a quality engineer days of manually pulling logs, cross-referencing timestamps, and testing hypotheses by hand becomes a query that surfaces the same answer automatically, because the underlying defect, environmental, and material data are already connected rather than living in three separate systems nobody has time to reconcile routinely. The speed difference has a compounding effect on cost too: a defect pattern left unaddressed for the days or weeks a manual investigation would take continues producing scrap and rework the entire time, while a same-day diagnosis narrows that exposure window dramatically.
FROM PATTERN TO PREVENTION
What Changes Once Correlation Becomes a Routine Practice
Finding one pattern once is useful. Building the habit of checking for patterns continuously is what actually compounds into a meaningfully lower defect rate over time.
Reactive Fixes Become Proactive Adjustments
Once a historical pattern between a specific environmental condition and a defect type is established, operators can watch for that condition and adjust before the defect rate actually rises.
Root Cause Investigations Shrink From Weeks to Hours
A quality engineer with pre-connected shift, environmental, and material data can test several hypotheses in a single sitting instead of manually assembling each cross-reference from scratch.
Material Supplier Issues Surface Faster
A defect signature tied cleanly to a specific paint or hardener lot gives a quality team concrete evidence to bring back to a supplier, rather than a vague complaint about inconsistent quality.
Continuous Improvement Has Something to Point At
A documented, quantified pattern gives a process improvement initiative a specific, measurable target rather than a general instruction to "reduce defects" with no clear starting point.
TURNKEY DELIVERY
How iFactory Connects Your Defect, Environmental, and Material Data
This analysis depends on data that usually already exists across separate systems in your plant. iFactory's deployment focuses on connecting those sources, not asking you to start a new data collection effort from zero.
What Gets Built
Automated shift, seasonal, and material batch tagging on every logged defect
Environmental sensor integration for booth temperature and humidity correlation
Trend-line monitoring with statistical threshold alerting, not just daily counts
Cross-reference queries connecting defect data to material lot and supplier records
24×7 remote monitoring with alerts on developing correlation patterns
Deployment Timeline
Weeks 1–4: Defect log, environmental sensor, and material record integration mapping
Weeks 5–8: Historical baseline analysis, correlation model validation
Weeks 9–12: Go-live, trend alerting activation, quality team training
FREQUENTLY ASKED QUESTIONS
What Paint Shop Quality Teams Ask About Defect Analytics
We already have a defect dashboard tracking rate and rework percentage — isn't that the same thing?
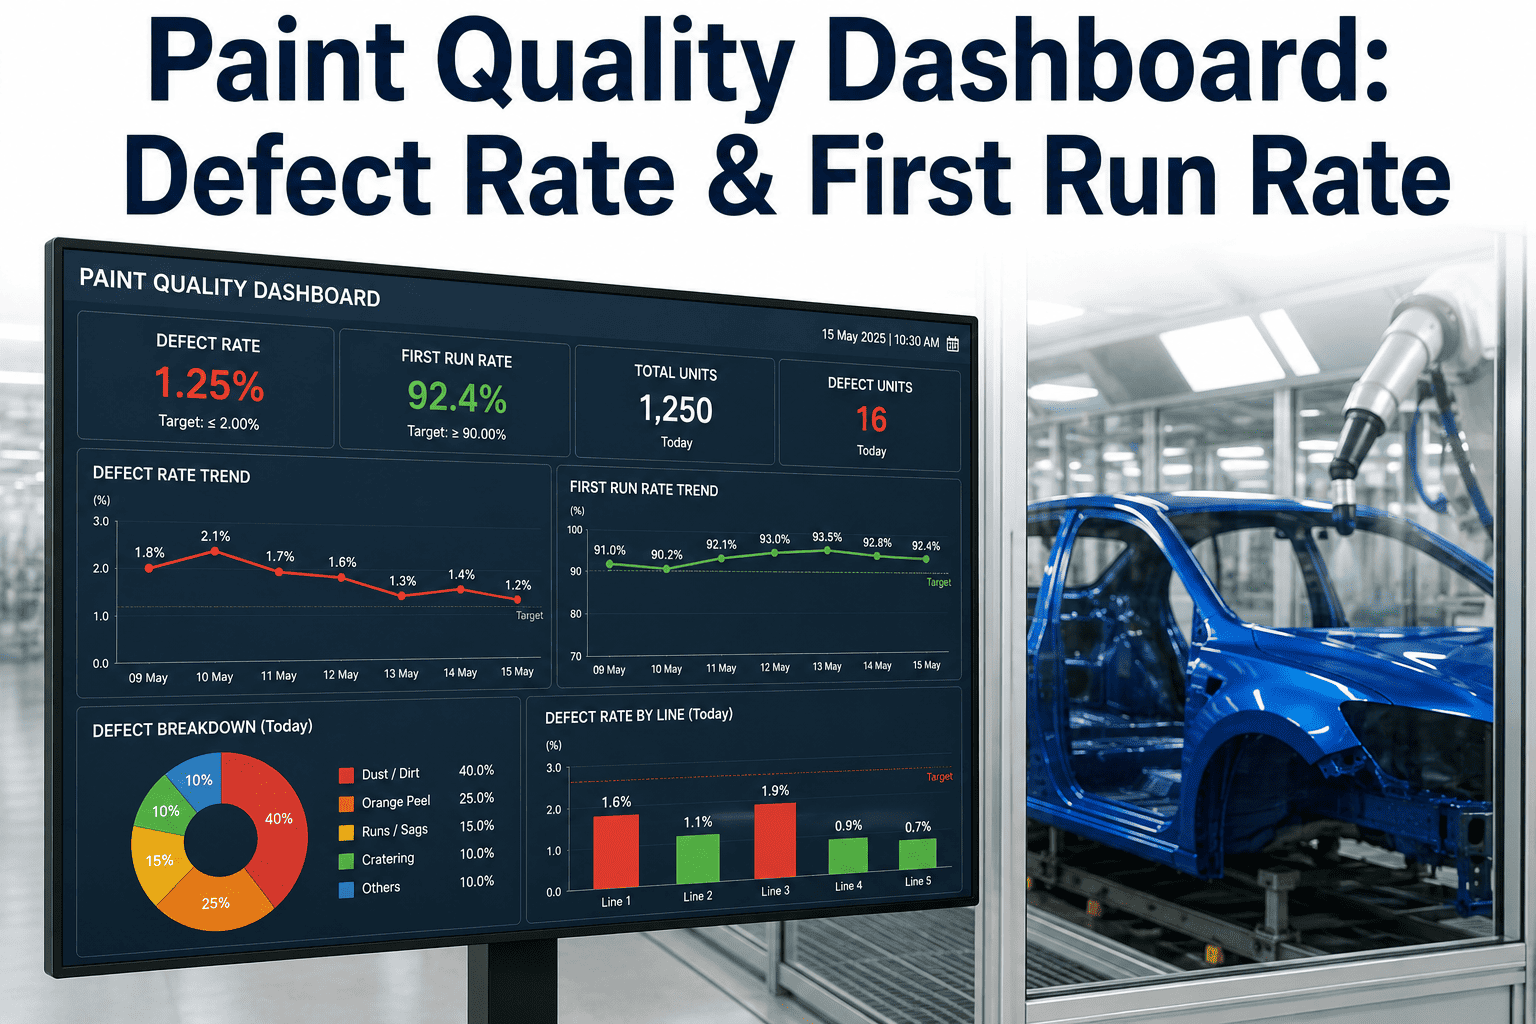
A dashboard tracking current defect rate, first-run rate, and rework percentage tells you how you're doing right now, which is valuable but answers a different question than pattern analysis does. Correlation analysis specifically looks backward across weeks and months to find what shift, environmental, or material factor is driving a change in those numbers, which a real-time dashboard is not built to surface on its own. The two are complementary rather than redundant — the dashboard tells you something changed, the analysis tells you why.
Book a demo to see both working together against your own data.
How much historical data do we need before this kind of pattern analysis becomes useful?
Meaningful shift and short-term environmental correlation can often be established within several weeks of consistent defect logging, since those patterns tend to repeat frequently enough to show up quickly. Seasonal patterns naturally take longer to confirm with full confidence, ideally spanning at least one full year so a given season can be compared against the same period previously, though an emerging seasonal trend can sometimes be flagged provisionally well before a full year of data exists.
Contact our support team to review what your current defect log history would already support.
Can this analysis tell us definitively that a correlation is the actual cause, not just a coincidence?
Correlation analysis identifies candidate relationships worth investigating, and the strongest candidates are ones that align with a documented, physically understood failure mechanism, such as humidity preceding orange peel, rather than pure statistical coincidence. A quality engineer still confirms the finding, typically by correcting the suspected variable and confirming the defect rate responds as expected, which is standard practice regardless of how the correlation was originally surfaced.
Book a demo to see how a flagged correlation gets validated before it drives a process change.
Our material batch and defect data live in completely separate systems — is that a blocker?
It is a common starting condition rather than a blocker, and connecting those systems is typically the first phase of a deployment rather than a prerequisite you need to solve beforehand. Most paint material tracking systems and defect logging platforms expose enough structured data to support an integration, and the specific approach depends on what systems you currently use for each.
Contact our support team to review integration feasibility for your specific material tracking and defect logging systems.
What kind of defect rate improvement is realistic once this analysis is running?
Closed-loop process improvement built on this kind of correlated defect data has been reported to reduce defect occurrence by up to 60 percent within six months in documented paint shop deployments, though the specific improvement depends heavily on how many actionable patterns exist in your current process and how quickly identified fixes are actually implemented. The analysis surfaces the pattern; the improvement comes from acting on what it finds.
Book a demo to set a realistic improvement target based on your current defect profile.
FIND THE PATTERN BEFORE IT COSTS YOU MORE
Turn Your Paint Shop's Defect History Into an Answer, Not Just a Log
iFactory connects your defect data to shift, environmental, and material records automatically, so the pattern behind a rising defect rate gets found in weeks, not discovered by accident months later.