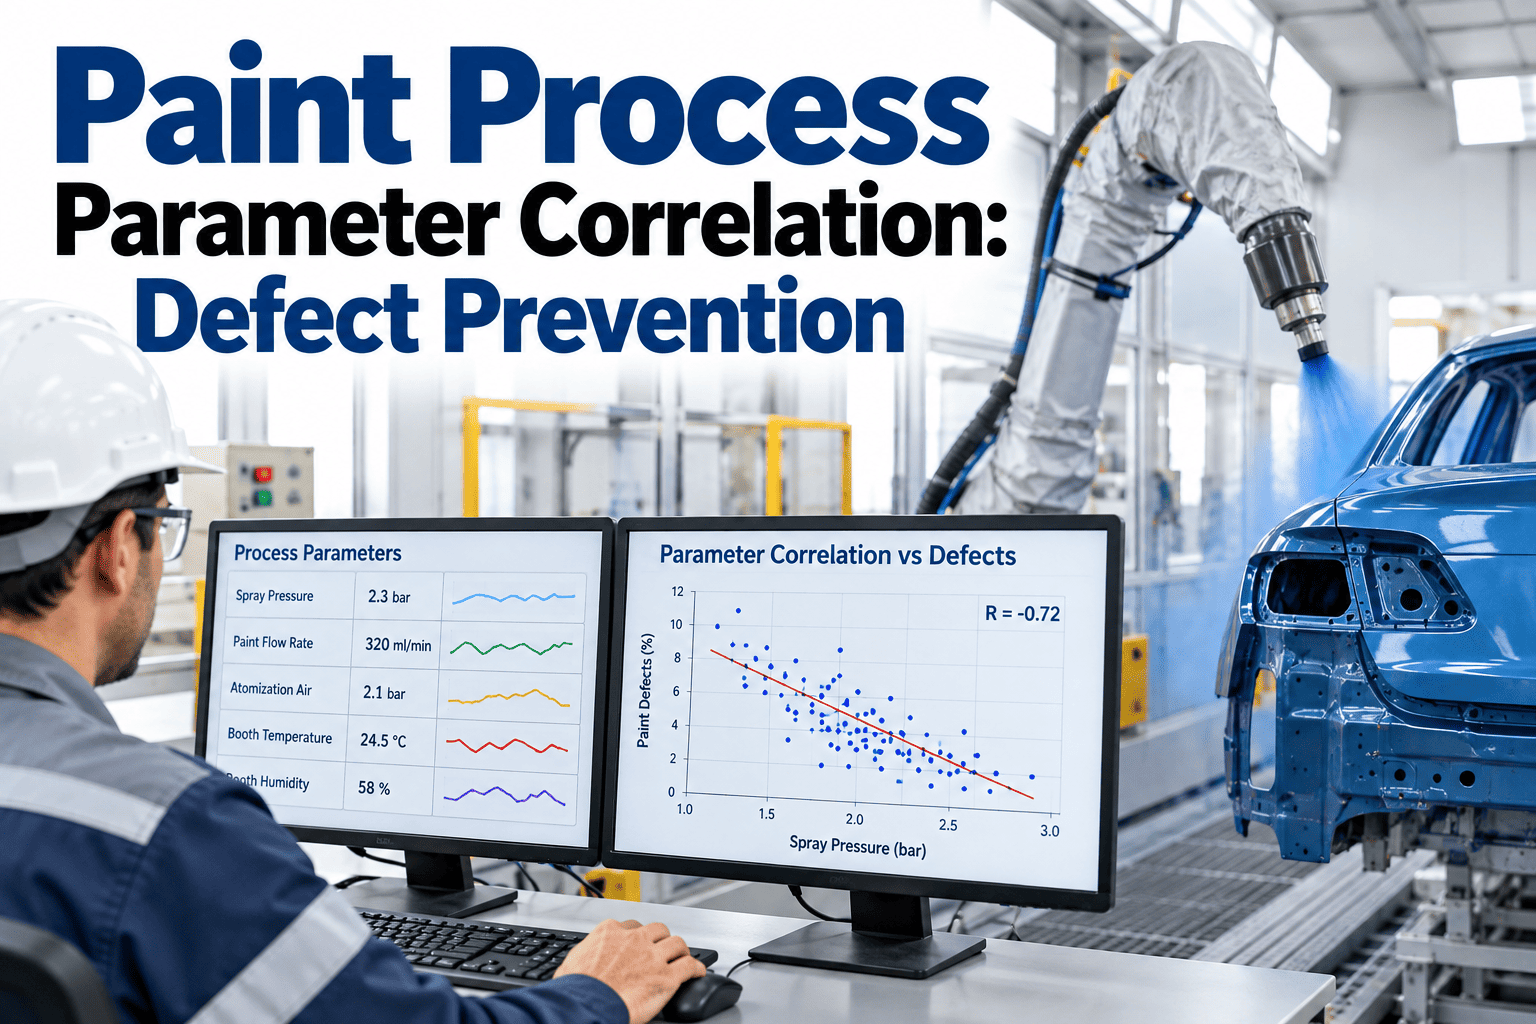
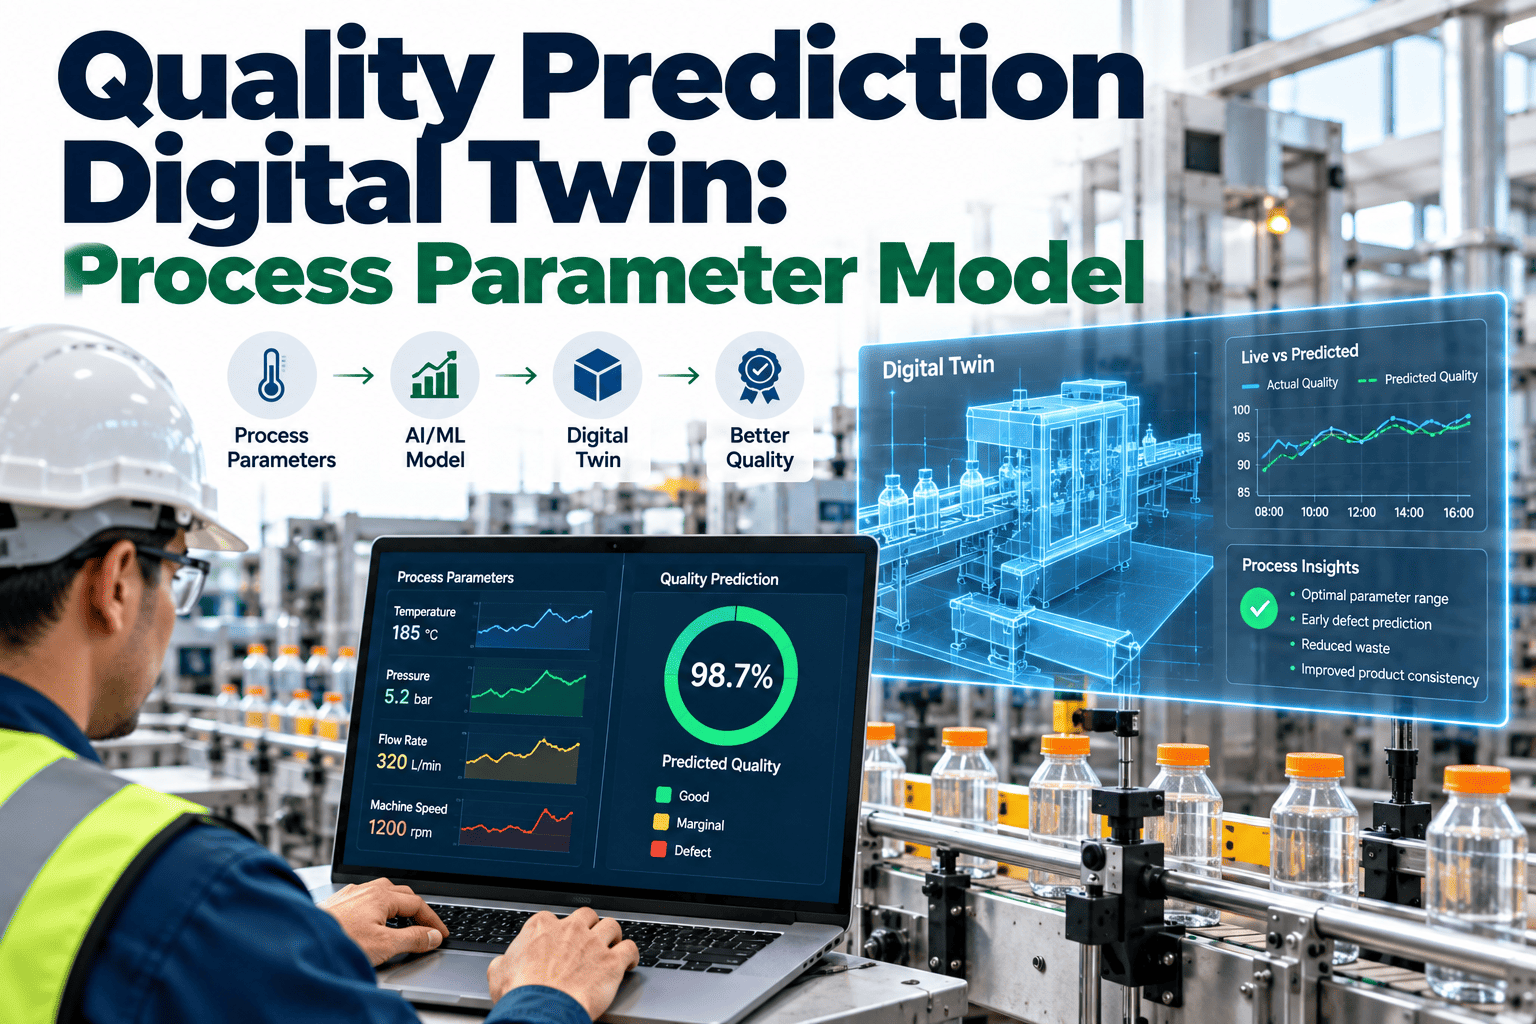
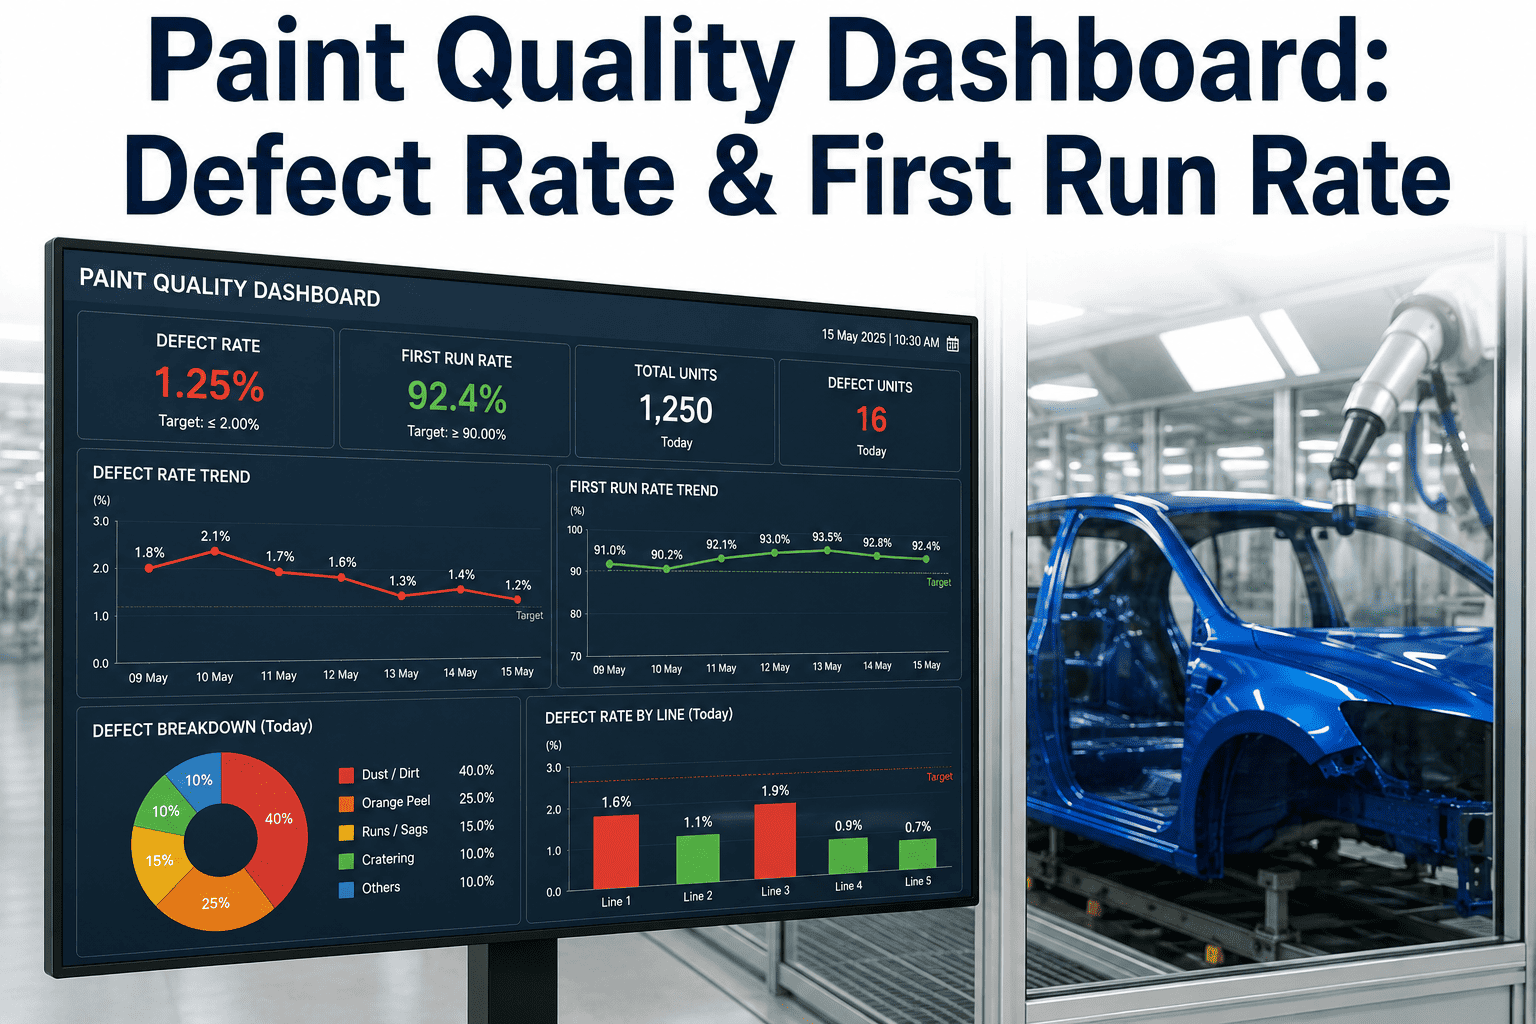
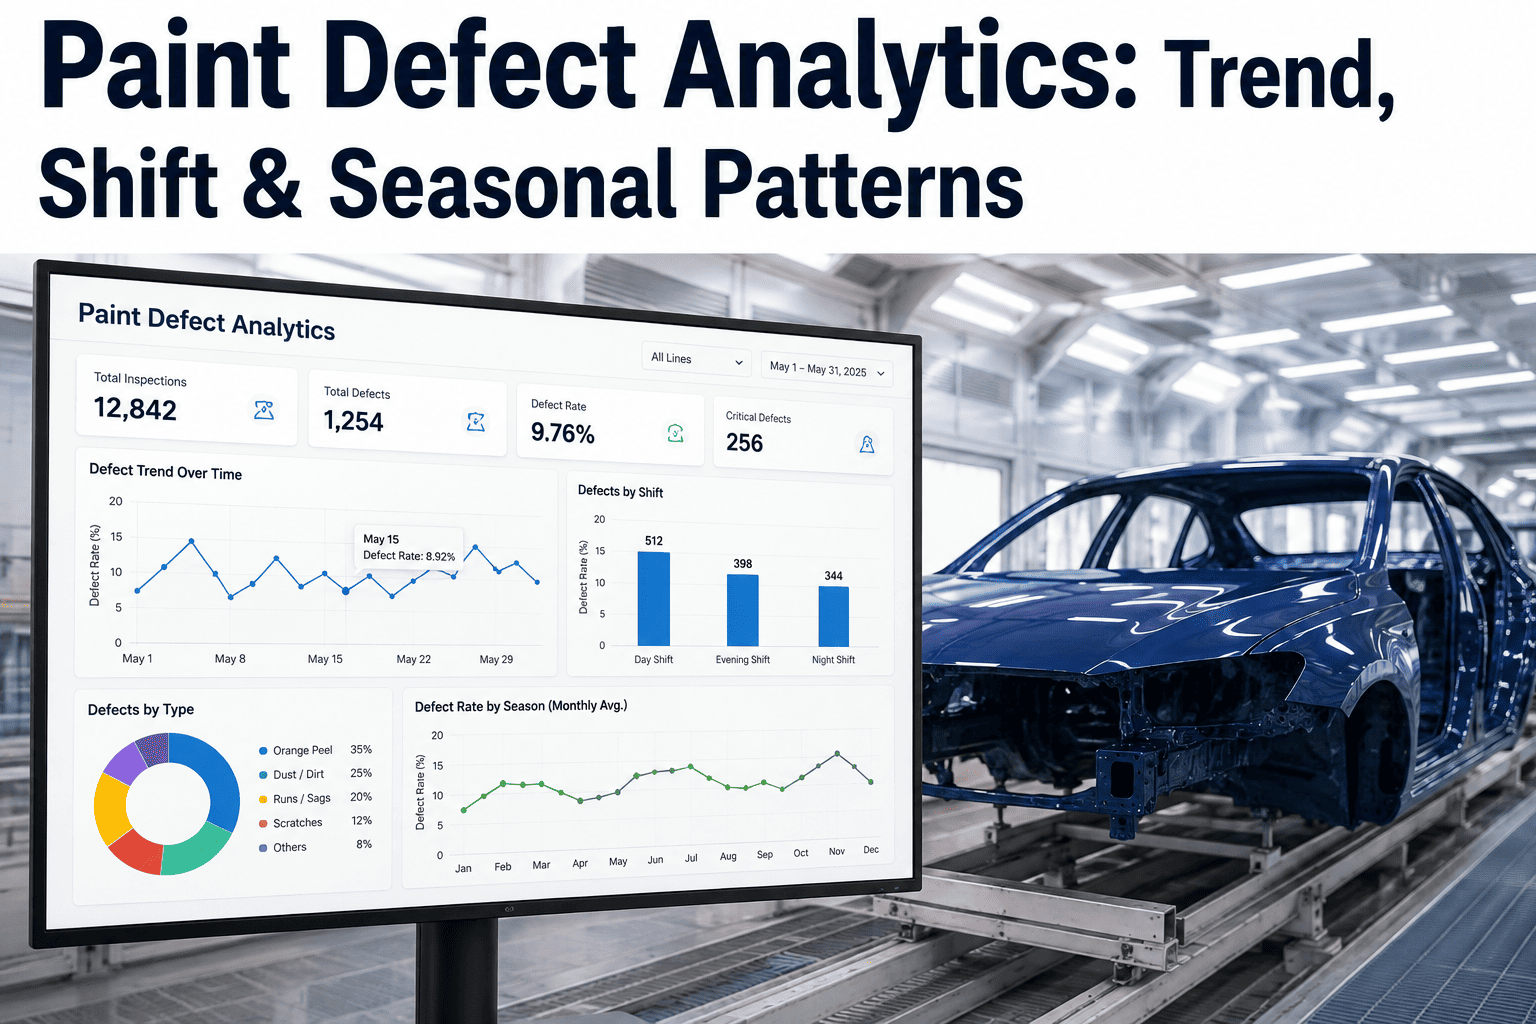
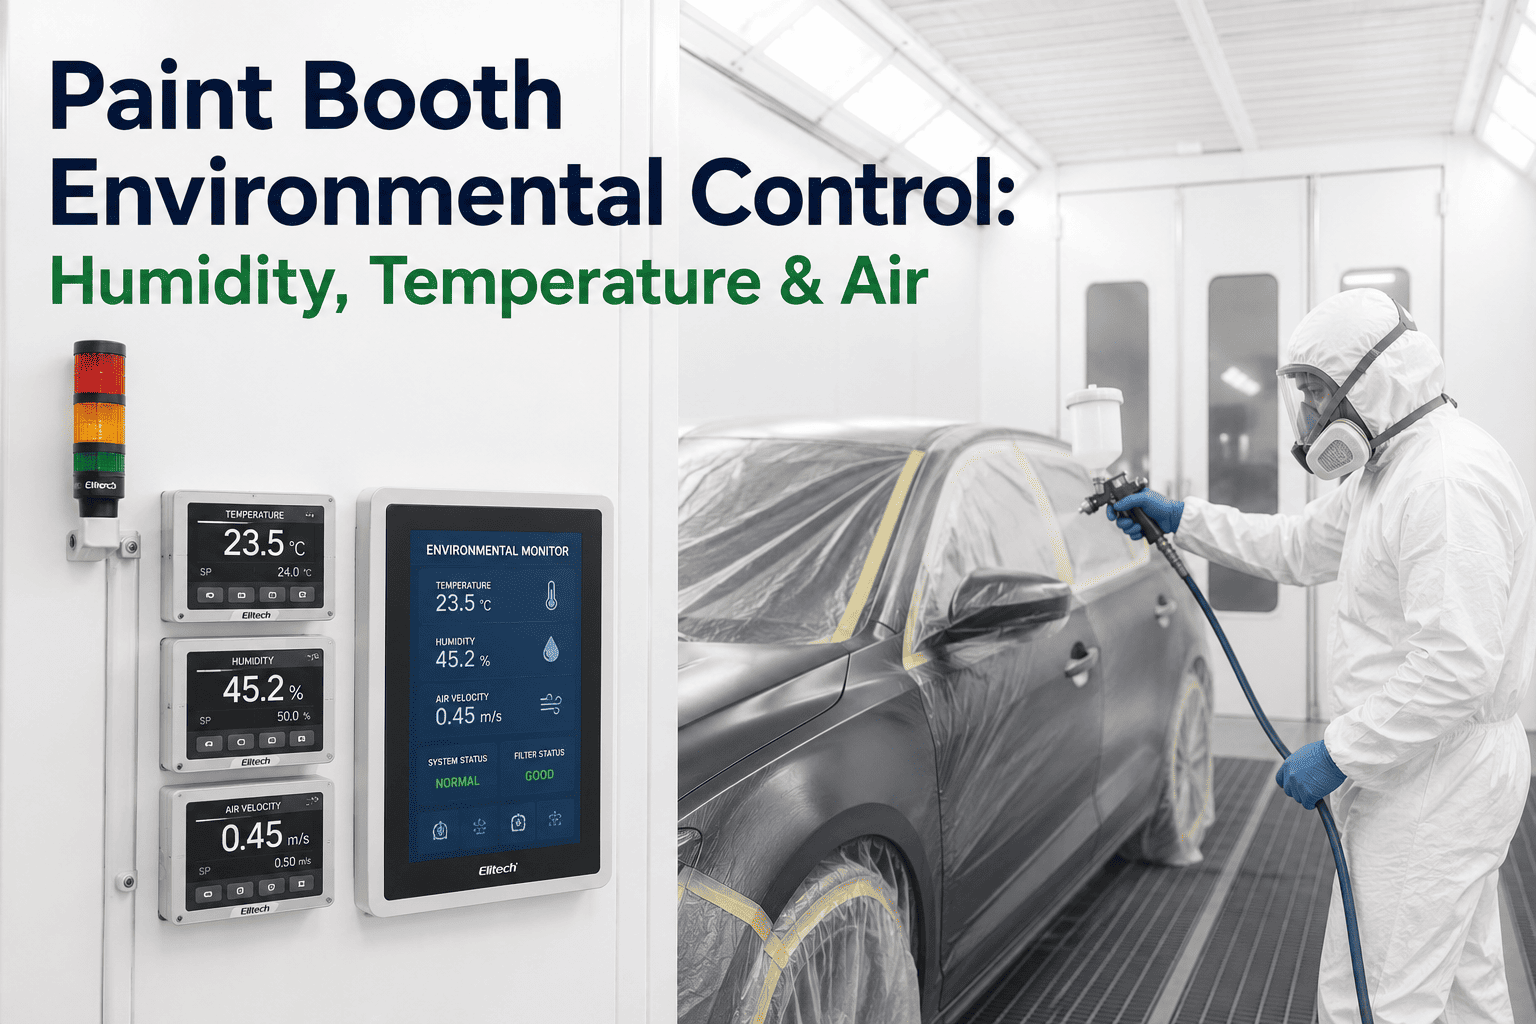
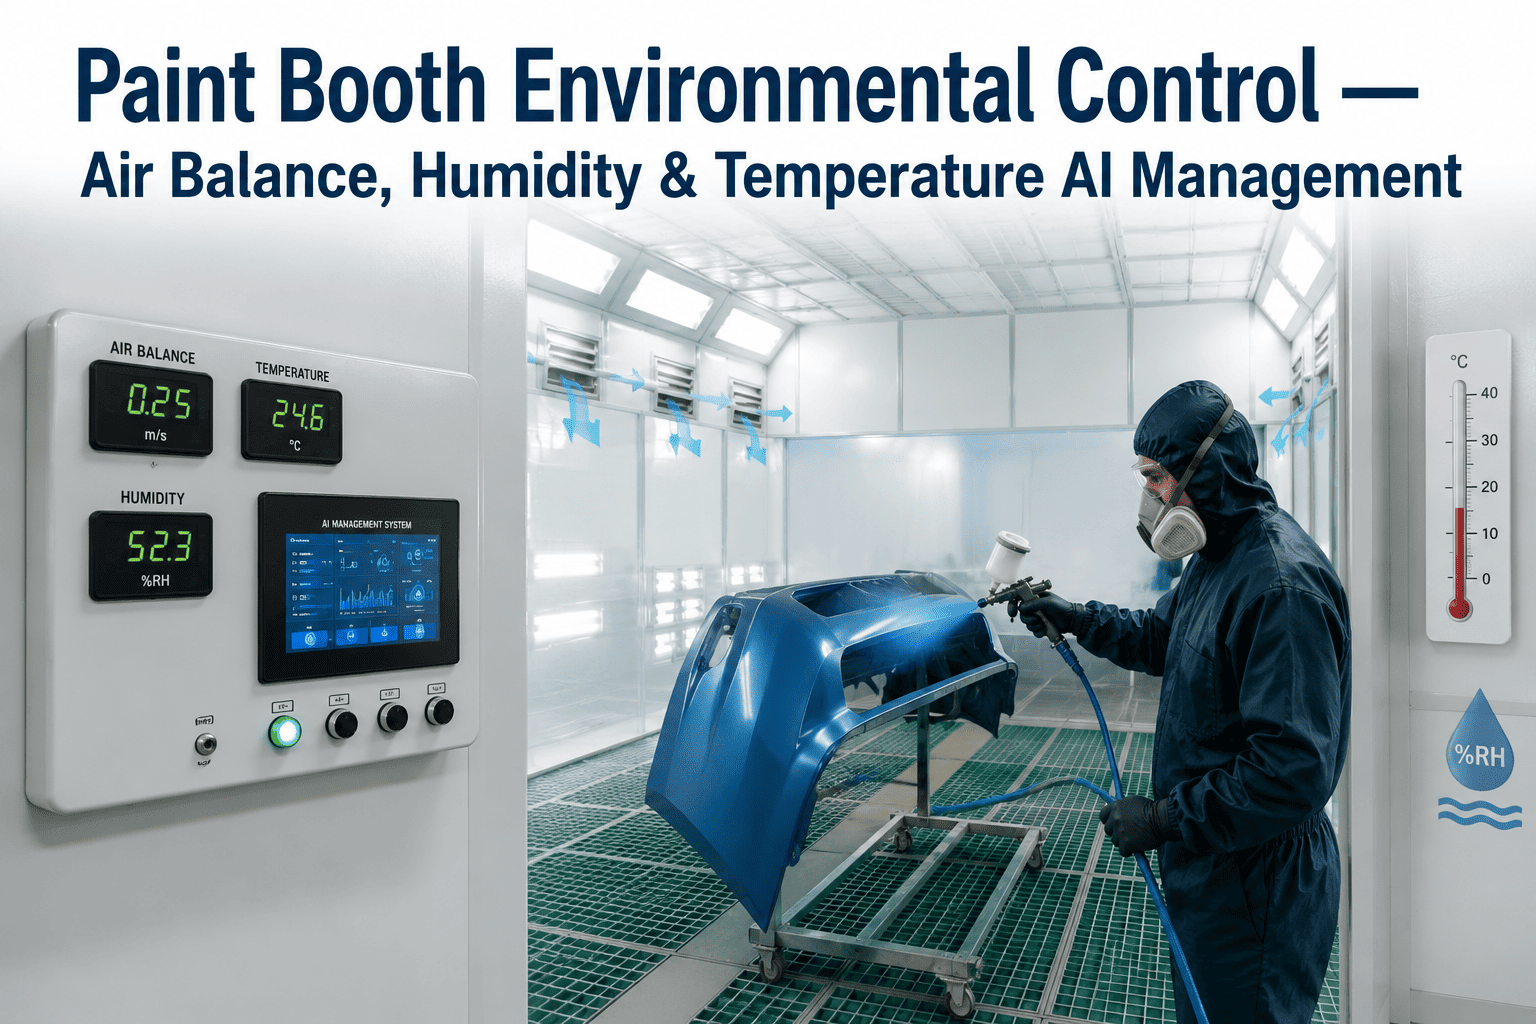
Every paint defect on an automotive body has a fingerprint, and that fingerprint is almost always written in process data that was sitting in front of you the whole time. A run of orange peel that shows up on the afternoon shift isn't random, it correlates with a booth that drifted two degrees warm and a batch of clearcoat that thickened past its target viscosity. Sags cluster around the days humidity climbs and film build creeps high. The problem has never been that the signal isn't there, it's that booth temperature, humidity, spray pattern, viscosity, and cure profile all live in separate logs that no human has time to cross-reference in real time. iFactory AI correlates every one of those parameters against actual defect occurrence, so instead of reacting to scrap you can see the drift forming and correct it before the first bad panel leaves the booth — walk through it with our team to map it against your own line.
AUTOMOTIVE · PAINT DEFECT DETECTION · PARAMETER CORRELATION
Stop Guessing Which Parameter Caused the Defect
iFactory correlates booth temperature, humidity, spray pattern, viscosity, and cure profile against real defect occurrence, turning scattered process logs into a single early-warning signal that flags a drift toward orange peel, sags, or solvent pop before the paint hits the body.
THE CORE IDEA
A Defect Is a Symptom, a Parameter Is the Cause
Walk any automotive paint shop and you'll find teams that are very good at describing defects and much less certain about what produced them. The finish came out with a texture like an orange skin, or a panel sagged on the vertical, or a pinhole opened up during bake. Those are symptoms, visible after the fact, when the cost is already sunk into the body.
The cause lives upstream, in a measurable process parameter that moved outside its window. Automotive topcoat appearance is produced by film thickness, coating composition, substrate geometry, and processing factors working interdependently, and inadequate control at the application stage is what leads to cratering, orange peel, and sag.
WHAT YOU SEE
The Defect
Orange peel, sag, solvent pop, dirt inclusion, mottling — caught at inspection, after the body is painted and the material and booth time are already spent.
is driven by
WHAT MOVED
The Parameter
Booth temperature, relative humidity, paint viscosity, atomization pressure, gun distance, film build, flash time, cure temperature — all measurable, all logged, all correctable in real time.
The gap between those two boxes is where scrap is made. Close it and you shift from explaining defects after the shift to preventing them during it. That shift is the entire point of correlating parameters against occurrence rather than just charting defects on their own.
THE PARAMETER MAP
Which Parameter Produces Which Defect
The reason parameter correlation works is that these relationships are not mysterious — they are documented, repeatable coating physics. Each major defect family traces back to a small cluster of parameters that, when they drift, reliably produce it. Here is the map the platform learns and monitors against your line.
Orange Peel
A dimpled, uneven surface from poor leveling and flow — the paint never settled smooth before it set.
DRIVEN BY
Viscosity too high · booth temperature too warm · gun distance too far · poor atomization · flash time too long
Sags & Runs
Paint flows downward on vertical panels, leaving drips and curtains where film gravity overcame surface tension.
DRIVEN BY
Film build too high · viscosity too low · gun too close · humidity high on waterborne · booth airflow imbalance
Solvent Pop
Trapped solvent bursts through the film during bake, leaving pinholes and blisters in the cured surface.
DRIVEN BY
Flash time too short · cure ramp too aggressive · film build too heavy · booth temperature swing
Dirt & Inclusions
Airborne particles land in wet paint, showing as raised specks that fail the appearance standard.
DRIVEN BY
Low humidity static pickup · booth cleanliness · filter loading · airflow disturbance
Water Spots & Craters
Moisture or micro-pockets of diluted paint dry into craters, common on waterborne systems out of the humidity window.
DRIVEN BY
Humidity above range · condensation on cold body · excessive dilution of coat · contamination
Mottling & Shade Shift
Metallic flake orients unevenly or color reads off-shade across the panel under different lighting.
DRIVEN BY
Basecoat application inconsistency · atomization variation · film build variation across the body
Notice how the same handful of parameters keeps reappearing across different defects. Booth temperature alone sits behind orange peel, solvent pop, and cure quality. That overlap is exactly why isolated single-parameter alarms miss so much, and why correlation across the whole parameter set catches what a threshold on any one gauge cannot.
See your top three defects mapped to their parameters
iFactory can take your recent defect history and booth logs and show you which parameter drifts line up with your actual scrap, before you commit to anything.
THE ENVIRONMENTAL WINDOW
Booth Temperature and Humidity: The Two Master Dials
If two parameters deserve to be watched above all others, it is booth temperature and relative humidity, because they influence nearly every defect family at once and because they drift silently across a shift as ambient weather changes outside the plant.
TEMPERATURE
RULE OF THUMBFor every 15°F above 70°F, a catalyzed coating cures roughly twice as fast — and twice as fast the other way for every 15°F below.
TOO WARMPaint skins and sets before it levels, pushing orange peel and locking in surface texture.
TOO COLDBelow 55°F the catalyst goes dormant and never crosslinks properly, so cure quality is permanently compromised.
HUMIDITY
TARGET BANDMost automotive booths run best with relative humidity in the 50–70% range for consistent application and cure.
TOO HIGHOn waterborne systems, excess moisture over-dilutes the coat and forms tiny liquid pockets that dry into craters, plus drying times stretch and coatings sag.
TOO LOWDry air spikes static, pulling dust onto wet paint, and drives premature drying that hurts leveling and adhesion.
The trouble is that these two dials interact. A booth that is technically inside its temperature spec can still produce defects if humidity has drifted to the opposite edge of its window at the same time. A human watching two separate gauges rarely spots the combined drift — a correlation engine watching both against the defect record does, every cycle.
REACTIVE VS PROACTIVE
The Difference Correlation Actually Makes
Most paint shops already collect a lot of this data. What changes with iFactory is not the existence of the numbers, it is the moment they become useful — before the defect instead of after.
| Dimension |
Reactive Quality Control |
iFactory Parameter Correlation |
| When You Learn of the Problem |
At inspection, after the body is painted and cured |
While the parameter is drifting, before the next body is sprayed |
| Data View |
Separate logs for booth, viscosity, spray, and defects, cross-checked by hand |
All parameters correlated against occurrence in one live model |
| Root Cause |
Debated in a defect meeting days later, often inconclusive |
Ranked parameter contributors surfaced automatically per defect |
| Response |
Rework, sand-and-respray, or scrap the panel |
Correct the setpoint before scrap is created |
| Drift Detection |
Only caught once it crosses a hard alarm limit |
Slow multi-parameter drift flagged as a developing trend |
| Institutional Memory |
Lives in the experience of veteran operators |
Captured in the model, applied consistently across every shift |
The reactive column is not wrong, it is simply late. Every entry in it describes learning something after the material is already committed. Correlation moves the whole exercise upstream, which is where the money is saved.
HOW THE ENGINE WORKS
From Raw Signals to a Ranked Warning
The platform does not just chart parameters, it continuously learns the relationship between where each parameter sits and whether defects follow. Here is the loop it runs against your line.
1
Ingest Every Signal
Booth temperature and humidity sensors, viscosity readings, spray pattern and pressure data, film thickness gauges, and cure oven profiles all stream into one timestamped record.
2
Align With Defect Records
Each inspected body's defect result is tied back to the exact parameter conditions present when it was painted, building a labeled history the model can learn from.
3
Learn the Correlations
The model identifies which parameter combinations precede which defects on your specific coatings, substrate, and booth — not a generic textbook, your actual line.
4
Flag the Drift Early
When live parameters start tracking toward a known defect signature, the platform raises a ranked warning naming the contributing parameters and the likely defect.
5
Close the Loop
Operators correct the setpoint, the outcome feeds back into the model, and the correlation sharpens with every cycle it runs.
Because the model is trained on your own painted bodies and your own defect history, it recognizes the signatures your line actually produces rather than a theoretical relationship that may not match your paint chemistry, booth design, or product mix.
WHAT DRIFT COSTS
The Cost Compounds the Later You Catch It
A parameter that drifts unnoticed doesn't cost the same amount everywhere along the line. The price of the same underlying drift multiplies with each stage it survives before someone acts on it.
STAGE 1
Caught at the Setpoint
The drift is corrected before a single defective body is painted. Cost is a few seconds of operator attention and nothing else.
STAGE 2
Caught at Inspection
The body is painted and cured before the defect is found. Now it needs rework — sand, respray, re-cure — consuming labor, material, and booth capacity.
STAGE 3
Caught After Assembly
A defect discovered once the body is built up is far harder to fix, may require teardown, and stalls throughput on a line that costs money by the minute.
STAGE 4
Caught by the Customer
An escaped appearance defect becomes a warranty and reputation cost, arriving long after the process data that would have explained it is gone.
The economic case for correlation is simply the distance between Stage 1 and Stage 4. Every warning that moves a catch from the inspection line back to the setpoint collapses that cost to nearly nothing.
TURNKEY DELIVERY
How iFactory Ships This to Your Paint Shop
Parameter correlation sounds like a data-science project, but iFactory delivers it as a turnkey system so your team isn't left assembling infrastructure. The intelligence arrives pre-built and pre-loaded.
What Arrives
A pre-configured NVIDIA AI server, racked and ready, with the correlation software already loaded
Rack it, connect power and Ethernet, and the AI is live on your network
Integration with your existing booth sensors, viscosity meters, and PLC/SCADA layer
A dashboard your quality and paint engineers use without a data-science background
24×7 remote monitoring with trend alerts on developing parameter drift
Live in 6–12 Weeks
Weeks 1–4: Ship the server, connect it to the network, and wire in your booth and application data feeds.
Weeks 5–8: Train the correlation model on your defect history and coatings, then run it in pilot alongside current QC.
Weeks 9–12: Go live with active warnings, activate operator alerting, and train the paint team on the dashboard.
Scope covers the cabling, network configuration, PLC and SCADA integration, and operator training, so the handoff to your team is a working early-warning system rather than a stack of parts. Trusted by 1000+ clients with 99.9% uptime, the deployment is designed to fit around a running paint shop, not shut it down.
FREQUENTLY ASKED QUESTIONS
What Paint Shops Ask Before Correlating Parameters
We already log booth temperature and humidity — what does correlation add that our charts don't?
Charts show you each parameter on its own axis, which tells you when a single value crosses a limit but not when several parameters are drifting together toward a defect that no one of them would trigger alone. Correlation links the parameter record to your actual defect outcomes, so the platform learns that a specific combination — say a warm booth plus high-target viscosity plus long flash — reliably precedes orange peel on your line, and warns you when that pattern starts forming. It turns disconnected logs into one predictive signal. See how
iFactory AI runs against your parameter set.
Does this work for both solvent-borne and waterborne paint systems?
Yes, and the distinction actually matters because the two chemistries have different sensitivities that the model learns separately. Waterborne systems are far more reactive to humidity, since excess moisture over-dilutes the coat and can form the tiny liquid pockets that dry into craters, so the humidity correlation carries more weight there. Solvent-borne systems shift the emphasis toward flash time and cure ramp for issues like solvent pop. The platform is trained on whichever system your line runs, so the correlations reflect your real chemistry rather than a generic model. Our
team can review your specific coatings with you.
How much defect history do we need before the correlations are reliable?
The model becomes useful faster than most teams expect because paint defects follow well-documented physical relationships, so it isn't starting from zero — it's learning how those known relationships express themselves on your particular booth and coatings. During the pilot phase the platform runs alongside your existing quality control, refining its correlations against each newly inspected body, so accuracy climbs steadily before you rely on it for active warnings. Lines with well-kept defect records reach confident correlation sooner than those starting fresh. Find out
what your defect history can support.
Will this integrate with our existing booth sensors and control system, or do we replace everything?
It integrates with what you already have rather than replacing it. iFactory connects to your existing booth temperature and humidity sensors, viscosity meters, spray and film-thickness data, and cure oven profiles through your PLC and SCADA layer, pulling those signals into one correlated record. The turnkey server ships pre-configured, and the deployment scope explicitly covers the cabling, network setup, and integration work, so your team isn't stitching feeds together. The goal is to make your current instrumentation more useful, not to force a rip-and-replace. Our
team can map iFactory AI against your control stack.
Does the system stop the line or change setpoints on its own?
That depends on how you choose to configure it, and most shops begin with the platform raising ranked warnings for operators rather than acting automatically, so the team keeps control of every response while learning to trust the detection. As confidence in the correlations builds, some lines move toward tighter automated setpoint nudges or holds for high-confidence, high-severity drift while lower-severity flags continue to route through operator review. Every warning is logged with the contributing parameters and the predicted defect regardless of configuration, so the decision trail exists either way. Talk through
the right response setup for your shop with us.
CATCH THE DRIFT, NOT THE SCRAP
Correlate Every Parameter Before It Becomes a Defect
iFactory AI ties booth temperature, humidity, viscosity, spray pattern, and cure profile to real defect occurrence, so your paint shop corrects the setpoint before the bad body is ever painted.