A dirt nib shows up on a hood three weeks into a production run. The quality team knows it's dirt, they can see it under magnification, but knowing what it is isn't the same as knowing where it came from — a torn filter in the booth, a contaminated air line, a maintenance cart that rolled through at the wrong moment, or dust tracked in from an upstream body shop. Most paint shops still chase this kind of finding manually, cross-referencing shift logs and maintenance records by hand, a process that can take days or weeks and often ends in an educated guess rather than a confirmed cause. Our paint quality specialists can show how AI-correlated defect analysis turns that guesswork into a documented answer.
Paint Shop & Surface Finishing
Most Paint Defects Have Already Told You Their Cause
The process data was already being collected — booth pressure, filter age, humidity, conveyor speed — it just was never correlated against defect location and timing fast enough to matter before the next batch went through the same conditions.
Why Manual Root Cause Analysis Takes So Long
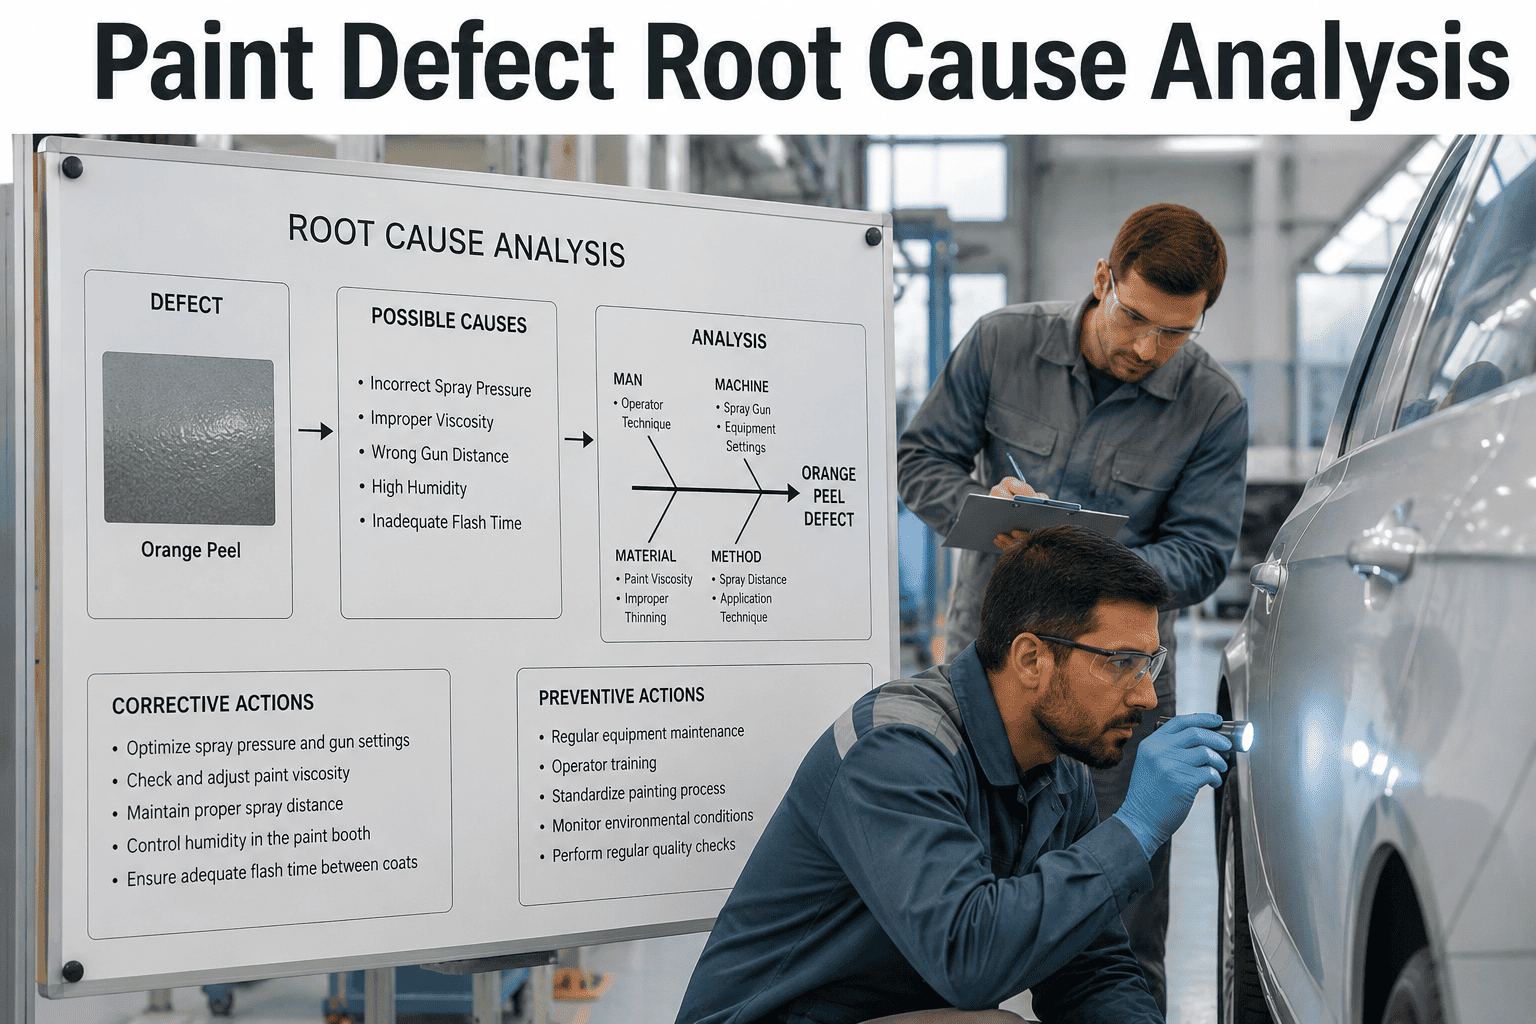
A paint defect investigation traditionally starts with a quality engineer pulling defect location and timing data from an inspection report, then manually checking that timestamp against separate systems for booth environmental logs, filter change records, maintenance work orders, and upstream process data. Each of these lives in a different system, on a different reporting cadence, and cross-referencing them by hand for even a single defect cluster can consume a full day of an engineer's time — and that's before accounting for the defects that never get a full investigation because the backlog is too long.
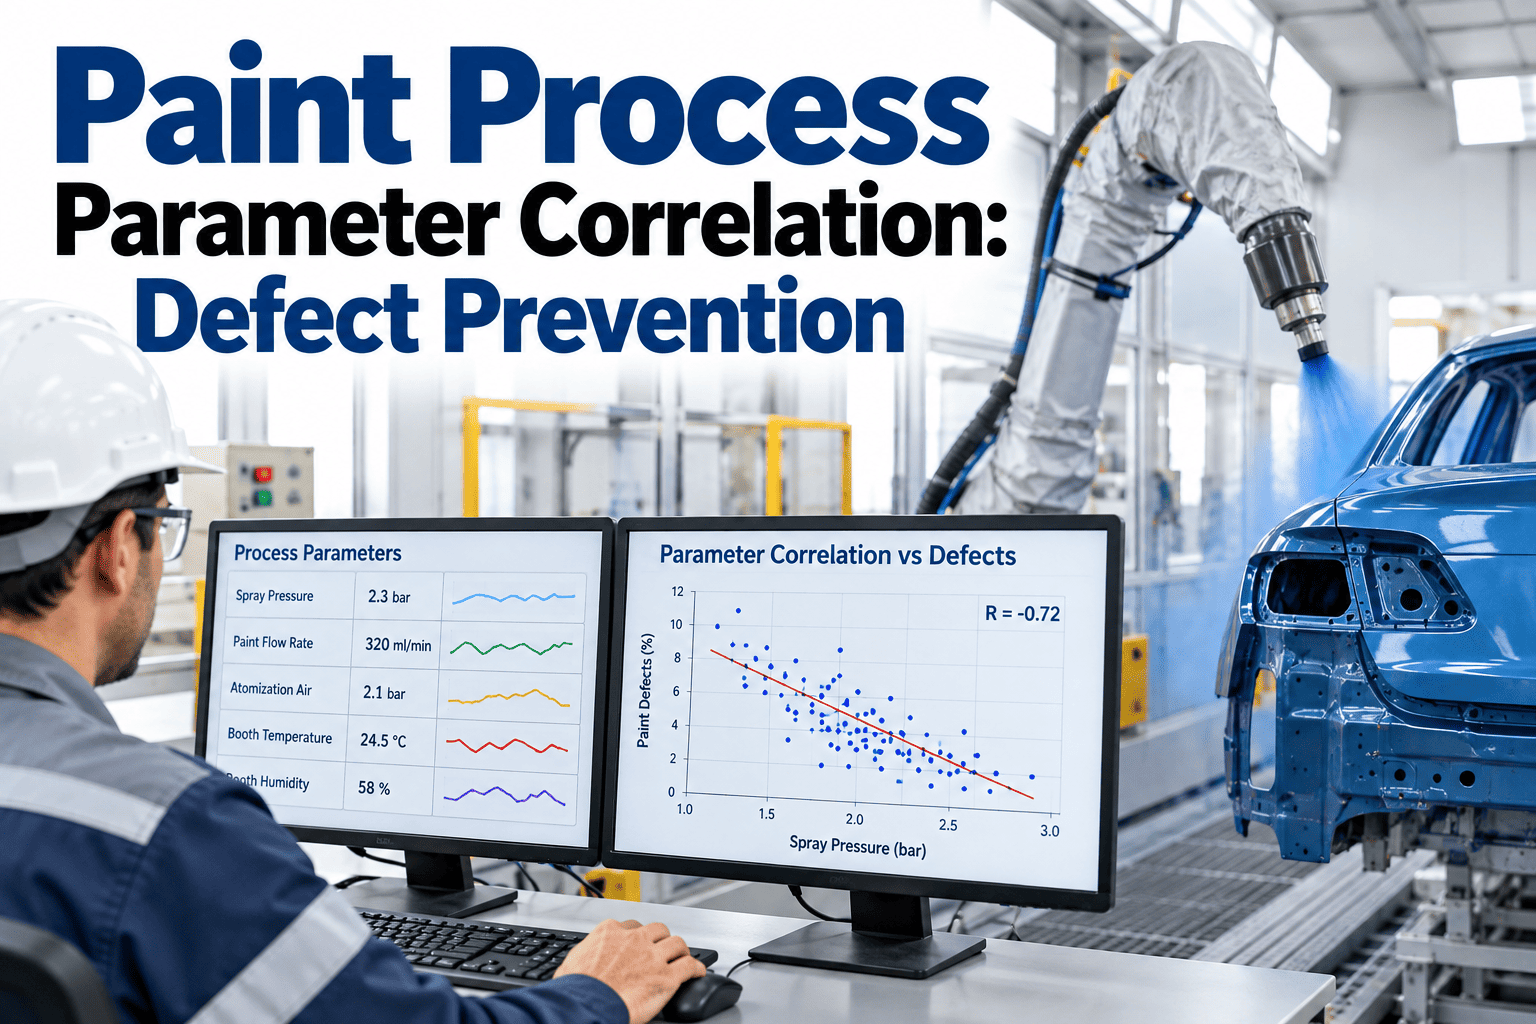
The core problem isn't a lack of data. Most modern paint shops already capture booth pressure, temperature, humidity, filter differential pressure, and conveyor speed continuously. The problem is that this data sits in separate systems that were never built to be queried together against a specific defect's location and timestamp, which means the correlation work has to happen manually, defect by defect, every single time.
Days-Weeks
typical manual root cause investigation timeline for a defect pattern
Hours
typical timeline with automated data correlation across systems
4-6
separate data systems a manual investigation typically has to cross-reference
38%
of paint defects industry data commonly attributes to dirt and debris contamination
Correlating Defect Data Against Process History Automatically
An AI-assisted root cause system works by continuously ingesting the same process data streams a manual investigation would eventually pull — booth environmentals, filter status, conveyor and robot parameters, upstream prep station data — and indexing all of it against time and body position on the line. When a defect is logged during inspection, the system can immediately query that entire process history for the exact time window and line position the defective panel passed through, surfacing correlated anomalies instead of requiring an engineer to manually track them down one system at a time.
1
Defect logged with location and timestamp during inspection
2
System pulls process data for that exact time window and line position
3
Correlated anomalies surfaced — filter age, humidity spike, equipment event
4
Pattern confirmed or ruled out against historical defect-cause pairs
Want to see how this correlation would run against a recent unresolved defect cluster?
Book a walkthrough using your own recent inspection data.
Building a Confirmed Pattern Library Over Time
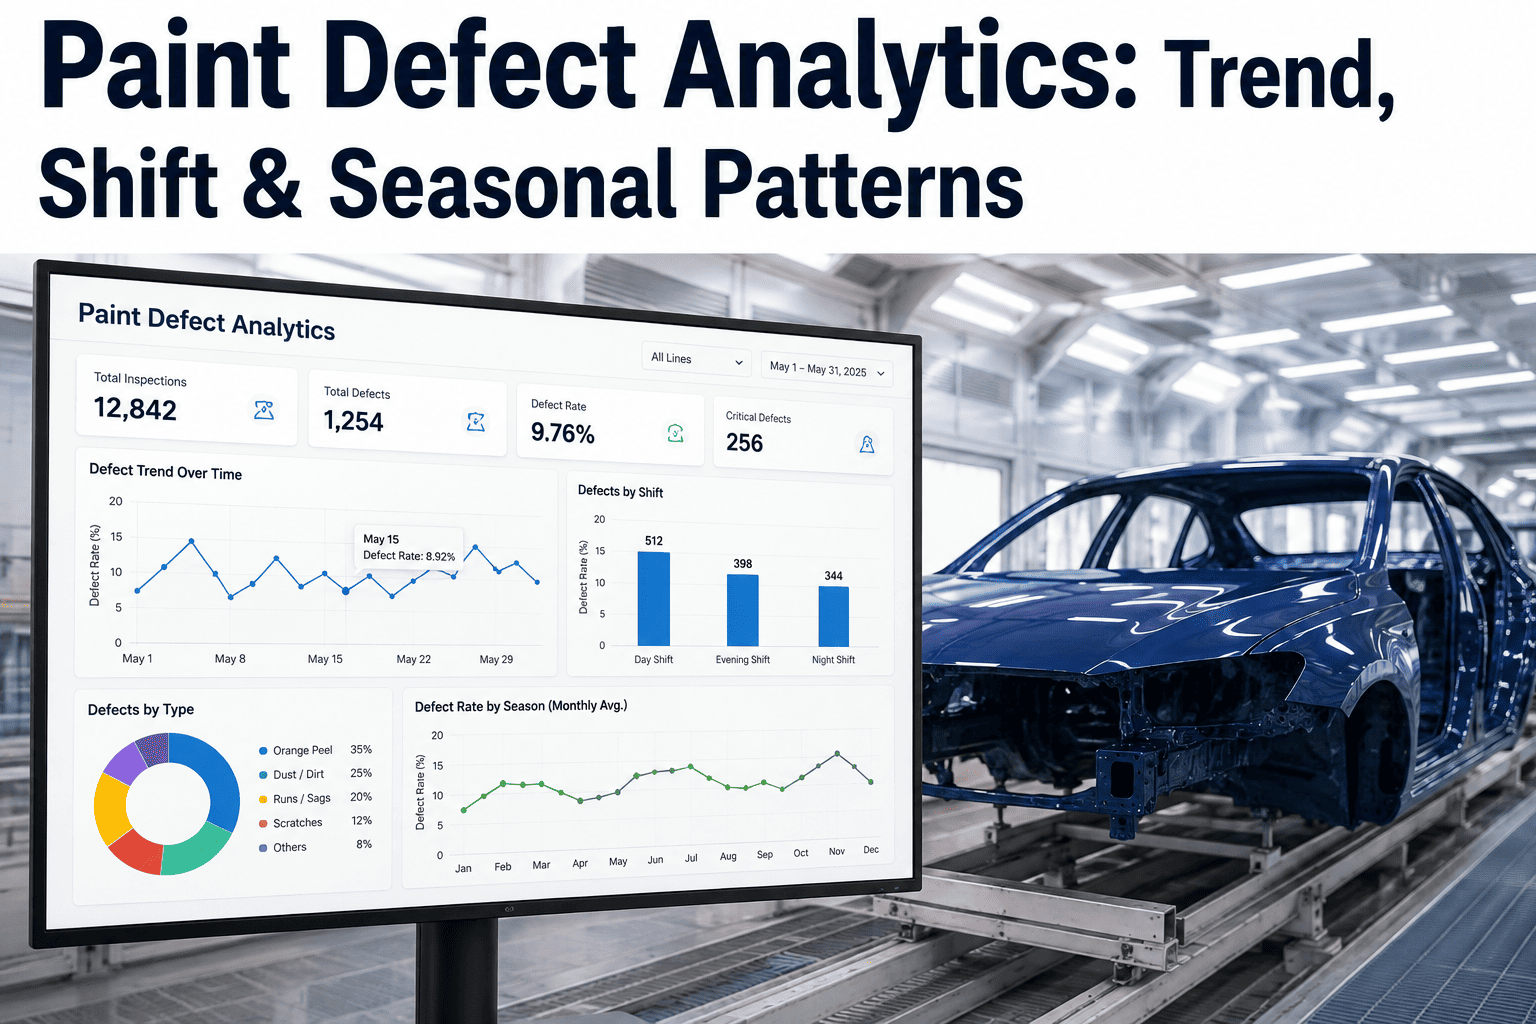
The real value compounds the longer the system runs, because every confirmed root cause investigation adds to a growing library of defect-to-cause patterns specific to that plant's own equipment and process. A dirt nib defect that repeatedly correlates with filter differential pressure crossing a certain threshold becomes a confirmed pattern the system can flag proactively the next time that threshold is approached, rather than waiting for another defect to occur before investigating.
This shifts the workflow from purely reactive — investigate after a defect appears — toward a mix of reactive and predictive, where the same correlation engine that explains yesterday's defect can also flag today's process conditions as trending toward a known defect pattern before any panel is actually rejected.
| Defect Type | Common Correlated Factors | Typical Detection Window |
|---|
| Dirt nibs / debris | Filter differential pressure, booth door cycling, cart traffic | Hours once correlated |
| Orange peel / texture | Booth humidity, atomizer wear, air pressure | Hours to one shift |
| Fisheyes / craters | Silicone contamination, upstream prep chemistry | One to several shifts |
| Sags / runs | Film build, robot path speed, coating viscosity | Hours once correlated |
Why Dirt and Debris Dominate Most Defect Pareto Charts
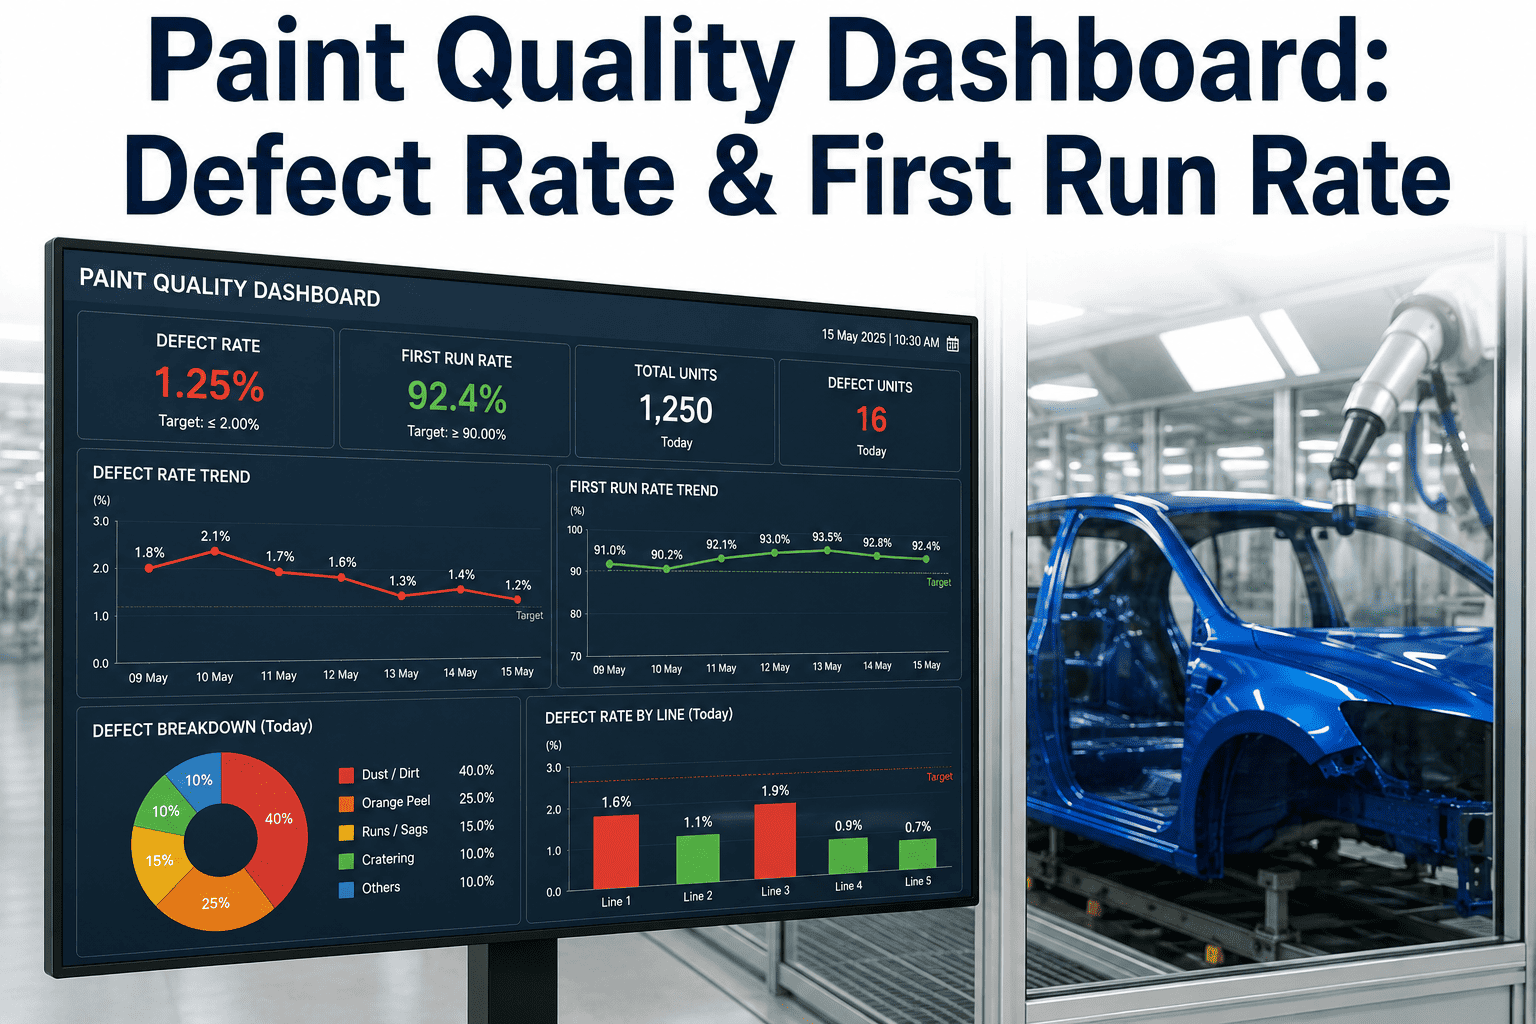
Dirt and debris contamination is consistently one of the largest categories in paint defect breakdowns, and the reason it's so persistent is that it can enter the process at nearly any point — a torn filter, a door seal that isn't sealing, an operator's clothing, a maintenance cart, even dust generated by the body shop upstream and carried into paint on the body itself. This wide range of possible entry points is exactly why manual investigation struggles with dirt defects specifically: there are simply too many candidate sources to check by hand within a reasonable investigation window.
Automated correlation narrows this search dramatically by checking every candidate source simultaneously against the defect's exact timing and location, rather than requiring an engineer to guess which source to check first. A defect cluster that correlates strongly with a specific booth zone and a specific shift, for instance, points investigation toward that zone's filtration and door-cycling history rather than a plant-wide search.
Filtration System
Torn or saturated filters allow particulate through; differential pressure trending flags this before failure.
Booth Door Cycling
Frequent door openings introduce outside air and particulate; cycling frequency correlates with contamination spikes.
Upstream Body Prep
Dust and debris carried on the body itself from body shop or sealer operations upstream of paint.
Personnel & Material Traffic
Cart movement and personnel access patterns near the booth, tracked against shift and time-of-day defect spikes.
Turning Root Cause Findings Into a Prevention Plan
Identifying a root cause only creates value if it changes something about the process going forward, and a mature root cause program builds this feedback explicitly into its workflow rather than treating each investigation as a closed, one-off event. Confirmed causes should feed back into preventive maintenance schedules, filter replacement intervals, and process parameter thresholds, so the same defect pattern is progressively less likely to recur.
Days to Hours
Faster Investigation
Automated correlation replaces manual cross-referencing across separate data systems.
Growing
Confirmed Pattern Library
Each resolved investigation strengthens future proactive detection of the same defect type.
Documented
Prevention Trail
Confirmed causes feed directly into maintenance schedules and process thresholds.
Curious what your own defect pareto would look like with confirmed root causes instead of best-guess categories?
Talk to our team about building that view from your existing data.
Frequently Asked Questions
What data sources does the correlation system need access to in order to work?
The system typically needs access to booth environmental data such as temperature, humidity, and pressure, filtration system status including differential pressure readings, conveyor and robot process parameters, maintenance work order history, and the inspection system's defect logs with location and timestamp data. Most of this data already exists in a plant's SCADA, CMMS, and quality management systems, so the integration work is generally focused on connecting to these existing sources rather than deploying new sensors, though some plants choose to add targeted sensors in areas with known data gaps.
Reach out to our team to review what's available in your current systems.
Can this identify a root cause for a defect pattern we've never seen before?
For a genuinely new defect pattern with no historical precedent, the system's value comes from automated correlation across all available process data rather than from a pre-existing confirmed pattern match, which still dramatically narrows the investigation compared to a manual search but does require an engineer to review the correlated candidates and confirm the actual cause. Once that first investigation confirms a cause, the pattern is added to the library and future occurrences of the same defect type can be flagged automatically. The system gets more valuable specifically because it accumulates confirmed patterns over time rather than working from a fixed, generic defect library.
Book a demo to see how a new pattern investigation would be handled.
How far back does the system need historical data to start finding useful correlations?
A useful starting point is typically several months of historical defect and process data, since this gives the correlation engine enough variation in both process conditions and confirmed defect outcomes to identify meaningful patterns rather than coincidental ones. Plants with less historical data can still use the system for new defect investigations from day one, since the correlation against a single defect's process history doesn't require historical pattern matching, but the proactive flagging capability that predicts defects before they occur strengthens considerably as more confirmed history accumulates.
Talk to our team about what your existing data history would support.
Does this replace our quality engineers or just support their existing investigation process?
The system is designed to support quality engineers by handling the time-consuming data correlation work automatically, surfacing likely candidate causes for review rather than replacing the engineering judgment needed to confirm a root cause and decide on a corrective action. Engineers still make the final determination and design the prevention plan, but they spend that time on judgment and problem-solving rather than manually cross-referencing spreadsheets and log files across multiple systems, which is generally the most time-consuming and least value-adding part of a traditional investigation.
Reach out to discuss how this would fit into your current quality team's workflow.
Can the system distinguish between correlation and actual causation for a defect pattern?
The system surfaces statistically correlated factors as candidates for investigation, but confirming actual causation still requires engineering review, since correlation alone can sometimes reflect a coincidental relationship rather than a true cause, particularly early on when the pattern library has fewer confirmed examples to compare against. This is why the workflow is built around engineer confirmation before a pattern is added to the confirmed library — once confirmed, that pattern carries much stronger predictive weight than an unconfirmed correlation, and the system is explicit about which patterns fall into which category.
Book a walkthrough to see how confirmed versus candidate patterns are distinguished in practice.
Stop Guessing at Defect Causes
Correlate Every Defect Against Your Actual Process Data
Share your current defect pareto and investigation backlog. We'll show you how automated correlation across your existing process data would speed up root cause confirmation.