A downtime log full of individually logged stoppages hides the pattern that actually matters: most of those stoppages are not independent events, they cluster around a handful of shared causes that repeat across shifts and weeks. A maintenance team working through the log one entry at a time can spend hours chasing symptoms before noticing that a dozen separate two-minute stops all trace back upstream to the same conveyor sensor drifting out of calibration. Event clustering and upstream trace-back turn a flat list of stoppages into a cause-effect map, cutting the time between a stoppage pattern appearing and the actual cause being identified. Maintenance and production teams rethinking this process can see downtime events clustered and traced to root cause live before the next recurring stoppage pattern repeats again.
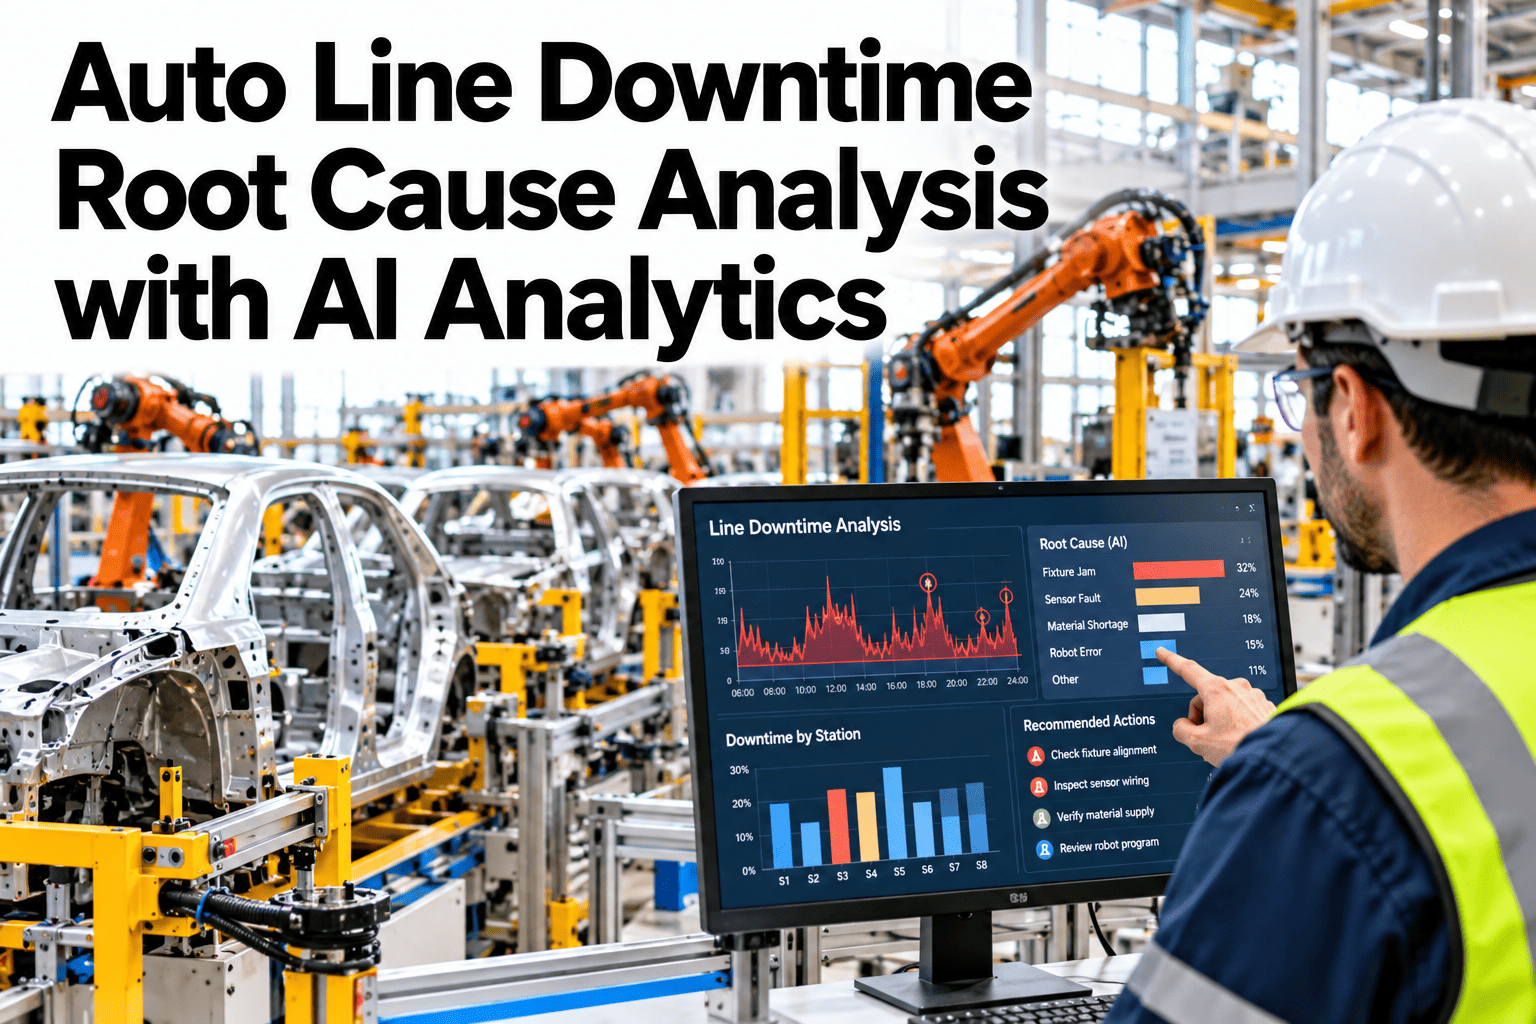
Auto Line Downtime Root Cause Analysis with AI Analytics
Event clustering, upstream trace-back, and cause-effect visualization that speed downtime-cause identification.
Illustrative cluster: scattered stoppages traced back to one shared upstream source
Why a Flat Downtime Log Slows Everyone Down
Treating every stoppage as an isolated event misses the pattern that would point straight to the cause.
Each stoppage is logged and closed individually, with no link drawn between related events.
Spotting a shared cause across dozens of entries depends on someone noticing the pattern by eye.
Teams often fix the station where the stoppage shows up rather than the upstream cause behind it.
Clustering related events automatically is what turns a long downtime log into a short list of actual causes.
From Event to Root Cause, in Order
A defensible root cause trace follows a consistent sequence rather than guesswork.
Cluster Your Own Downtime Log and See the Pattern
Book a 30-minute session and bring a recent downtime log. iFactory AI will cluster the events and trace them upstream live.
Manual Review vs Clustered Trace-Back
The time to root cause differs sharply between the two approaches.
| Factor | Manual Log Review | Clustered Trace-Back |
|---|---|---|
| Pattern detection | Depends on someone noticing by eye | Flagged automatically from event data |
| Upstream tracing | Manual investigation per event | Traced automatically through dependencies |
| Time to root cause | Hours to days per recurring pattern | Minutes once enough events have clustered |
| Fix target | Often the downstream symptom station | The actual shared upstream cause |
What iFactory AI Supports
Downtime events are clustered and traced continuously, not reviewed manually after the fact.
Automatic Event Clustering
Related stoppages are grouped automatically based on timing, location and symptom.
Upstream Trace-Back
Each cluster is traced through equipment and process dependencies to a likely source.
Cause-Effect Visualization
A visual map shows how one upstream cause connects to multiple downstream symptoms.
Pattern Alerts
A recurring cluster is flagged before it accumulates into significant lost production time.
iFactory AI connects to existing downtime logging and equipment data. Scope covers data integration, clustering model setup, team training and ongoing support.
Expert Review
The most common pattern we see is a dozen short, seemingly unrelated stoppages scattered across a week, each logged and closed individually, that trace back to one sensor or component drifting out of spec. No single event looks significant enough to investigate on its own, which is exactly why clustering matters.
Teams new to this approach often fix the downstream symptom first simply because that is where the stoppage shows up. Redirecting the fix to the traced upstream cause is usually the single biggest improvement in repeat stoppage rate we observe.
Frequently Asked Questions
How many events are needed before a cluster becomes reliable?
A pattern can often be flagged after just a handful of related events, though confidence in the traced root cause improves as more data accumulates. Early clusters are flagged as a hypothesis to investigate rather than a confirmed cause. See how early clustering is presented in a live session.
Does this require a detailed equipment dependency map to start?
A basic dependency map of the line's equipment and process flow is needed for upstream tracing to work, and this is typically built during setup using existing line documentation and operator knowledge. It does not need to be exhaustive on day one. Ask support about building your dependency map.
Can this distinguish between truly unrelated events that happen close together?
Yes, clustering considers symptom similarity and equipment relationships, not just timing, so two unrelated stoppages that happen to occur around the same time are not automatically grouped together. Request an example of how false clusters are avoided.
How does this integrate with our existing maintenance work order system?
A traced root cause can generate or link to a work order in the existing CMMS, so the maintenance team's workflow does not change, only the quality of the information feeding into it. Contact support about connecting to your CMMS.
How long before the model reliably traces root causes on our line?
Most lines see useful clustering within a few weeks of connecting downtime data, with trace-back accuracy improving as the equipment dependency map is refined and validated against confirmed cases. Book a session to estimate your own timeline.
Stop Chasing Symptoms, Find the Shared Cause
iFactory AI clusters downtime events and traces them upstream automatically. Book a walkthrough on your own downtime log.