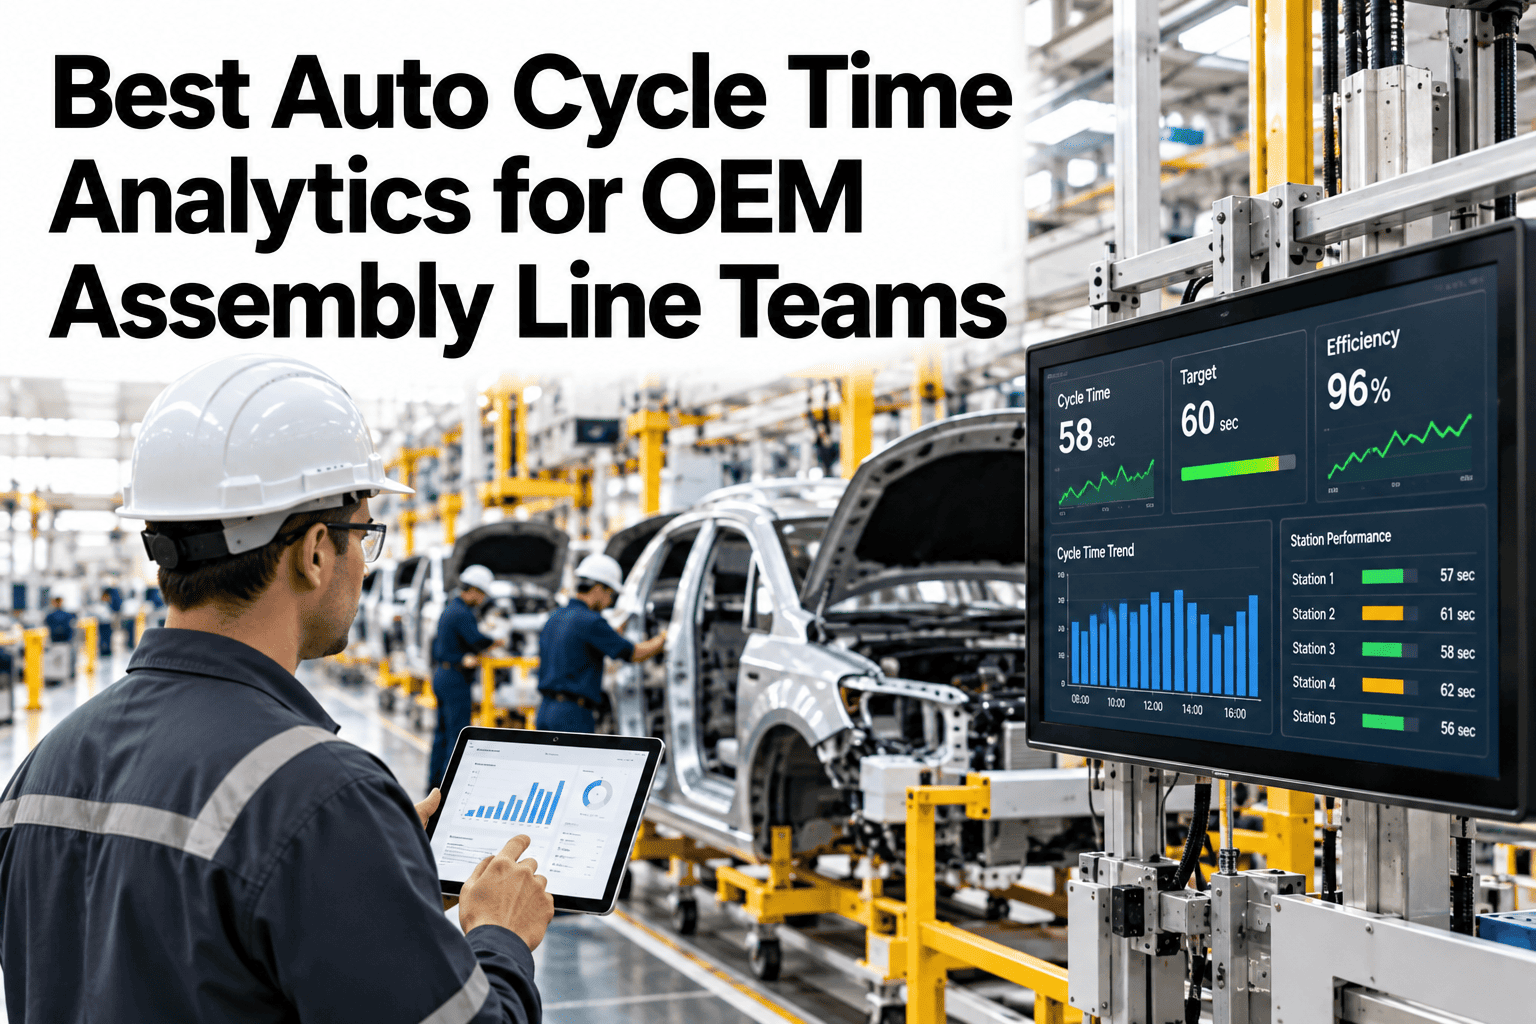
A station that hits its average cycle time can still be a problem if that average hides wide swings from one unit to the next. A line engineer looking only at the average misses exactly the variability that causes downstream queuing, overtime and missed takt. Station-level cycle time trending answers a different question than a plant-wide OEE number: not just how fast a station runs on average, but how consistently it runs, and how far the gap has grown between target and actual over the last week. That gap analysis is what turns a vague sense that "station 7 feels slow" into a specific, fundable improvement target. Assembly line teams rethinking their cycle time view can see station-level cycle time trending running on a live line before the next daily production meeting.
Best Auto Cycle Time Analytics for OEM Assembly Line Teams
Station-level cycle-time trending, variability tracking, and target-vs-actual gap analysis that guide daily improvement.
Why an Average Hides the Real Problem
A station can meet its average cycle time while still causing downstream disruption. Three patterns explain how.
Wide swings around a fine average still cause queuing and starve downstream stations.
A slow creep away from target rarely triggers alarm until it has compounded for weeks.
A plant-wide OEE figure can look healthy while one station quietly erodes it station by station.
Station-level trending surfaces all three patterns individually, instead of letting a plant-wide average smooth them away.
Three Views That Matter Daily
A useful cycle time dashboard answers three specific questions, not just one blended number.
Trend Over Time
Is this station's cycle time improving, stable, or drifting away from target week over week?
Variability
How wide is the swing from one unit to the next, and is it widening or narrowing?
Target vs Actual Gap
How large is the gap right now, and which station carries the largest gap on the line?
Find Which Station Has the Widest Gap to Target
Book a 30-minute session and bring your station cycle time data. iFactory AI will rank every station by its gap to target.
Reading a Gap Trend, Step by Step
A gap trend is read in a specific order to avoid chasing noise instead of a real signal.
What iFactory AI Supports
Cycle time data is tracked continuously at the station level and surfaced the way a daily production meeting actually uses it.
Station-Level Trending
Every station's cycle time trend is tracked individually rather than rolled into one plant figure.
Variability Tracking
Unit-to-unit swing is tracked alongside the average, not hidden by it.
Gap Ranking
Stations are ranked by target-vs-actual gap, surfacing the biggest opportunity first.
Daily Meeting View
A summary view is built for the daily production meeting, not a monthly report cycle.
iFactory AI connects to existing station timing systems. Scope covers data integration, trend model setup, team training and ongoing support.
Expert Review
Variability tracking is the feature teams undervalue until they see it. A station hitting its average cycle time looks fine on paper, but if the swing around that average is wide, downstream stations are absorbing the inconsistency through buffer stock or overtime that never gets traced back to the real cause.
Ranking stations by gap rather than by raw cycle time changes which conversations happen in the daily meeting. A slow station that is stable and predictable is often a lower priority than a faster station whose gap to target is quietly widening.
Frequently Asked Questions
How is takt time different from the target cycle time used here?
Takt time is the pace set by customer demand across the whole line, while a station's target cycle time is typically set slightly inside that to account for normal variability. Tracking both together shows whether a station is at risk of missing takt even while technically meeting its own target. See both metrics displayed together in a live session.
What counts as meaningful variability versus normal noise?
The threshold depends on the station and process, but a consistent widening trend over several days is treated differently from random day-to-day fluctuation around a stable range. The model is tuned to the station's own history rather than a generic cutoff. Ask support about setting variability thresholds for your stations.
Can this data be broken down by shift or operator?
Yes, cycle time, variability and gap data can be filtered by shift, which often surfaces patterns tied to staffing or handoff timing that a plant-wide view would hide. This is commonly used alongside the daily meeting view to spot shift-specific issues. Request a shift-level breakdown example.
How does this connect to our existing OEE reporting?
Station-level cycle time data feeds into the same performance loss calculations used for OEE, giving the plant-wide number a traceable breakdown by station rather than just a single aggregated figure. Contact support to connect this view to your current OEE reporting.
How long before trend data is reliable enough to act on?
A reliable trend typically emerges within two to three weeks of continuous data collection per station, enough to distinguish a real drift from short-term noise. Stations with highly variable product mix may need slightly longer to establish a stable baseline. Book a session to estimate your own timeline.
See Every Station's Real Gap to Target, Not Just the Average
iFactory AI tracks cycle time, variability and gap station by station. Book a walkthrough on your own line data.