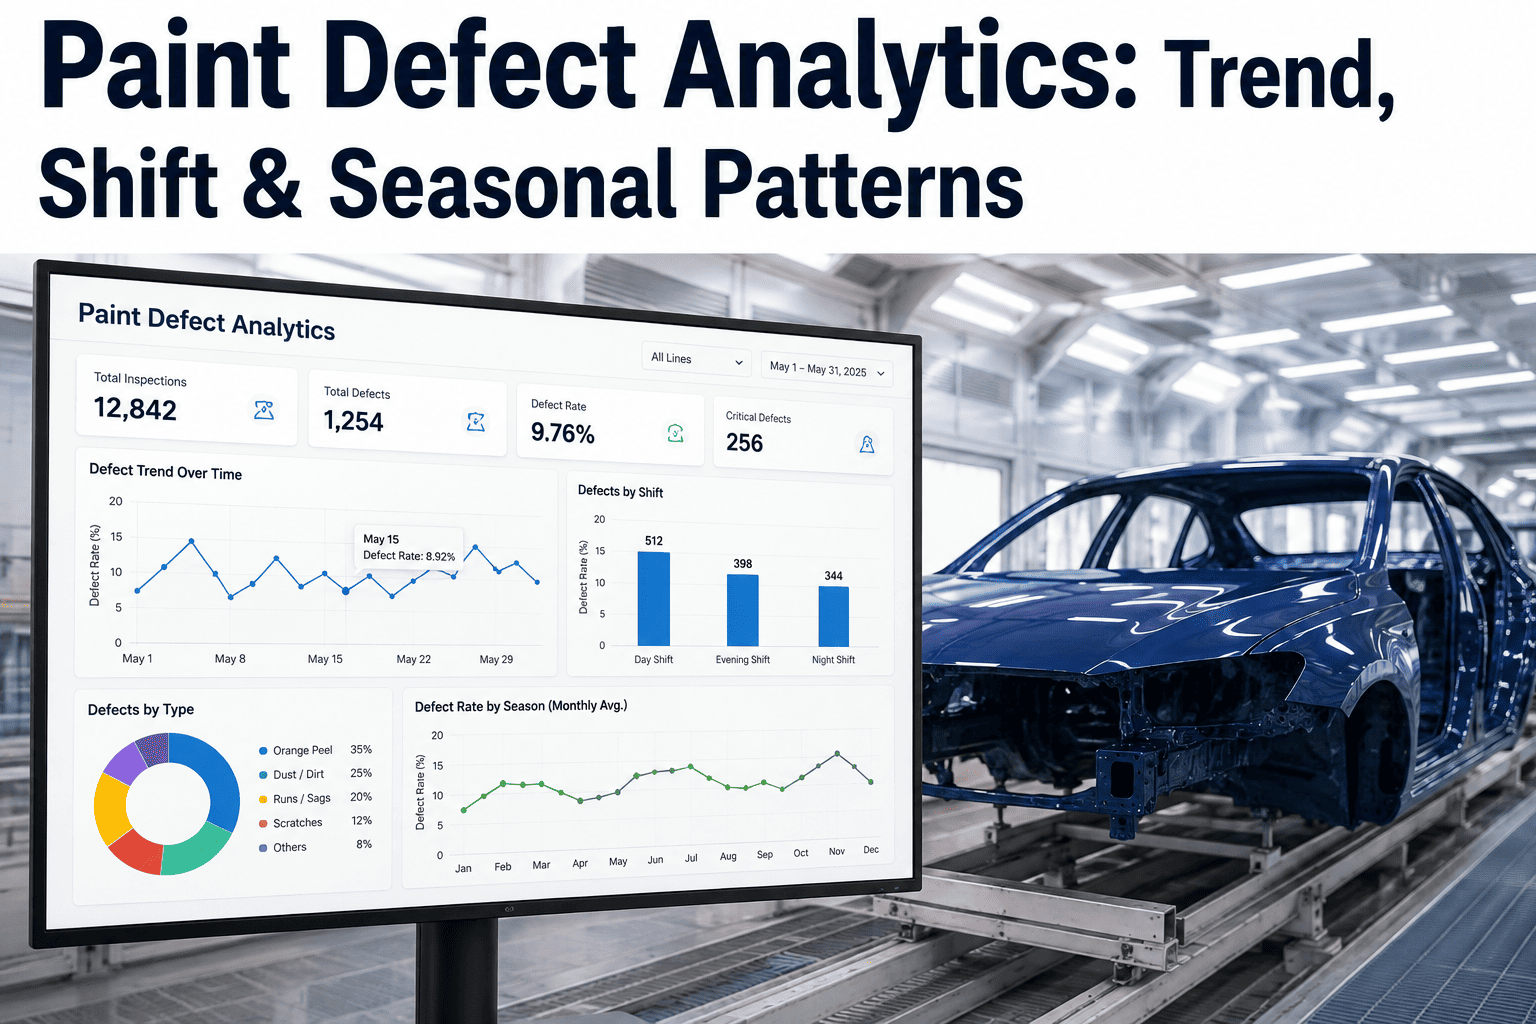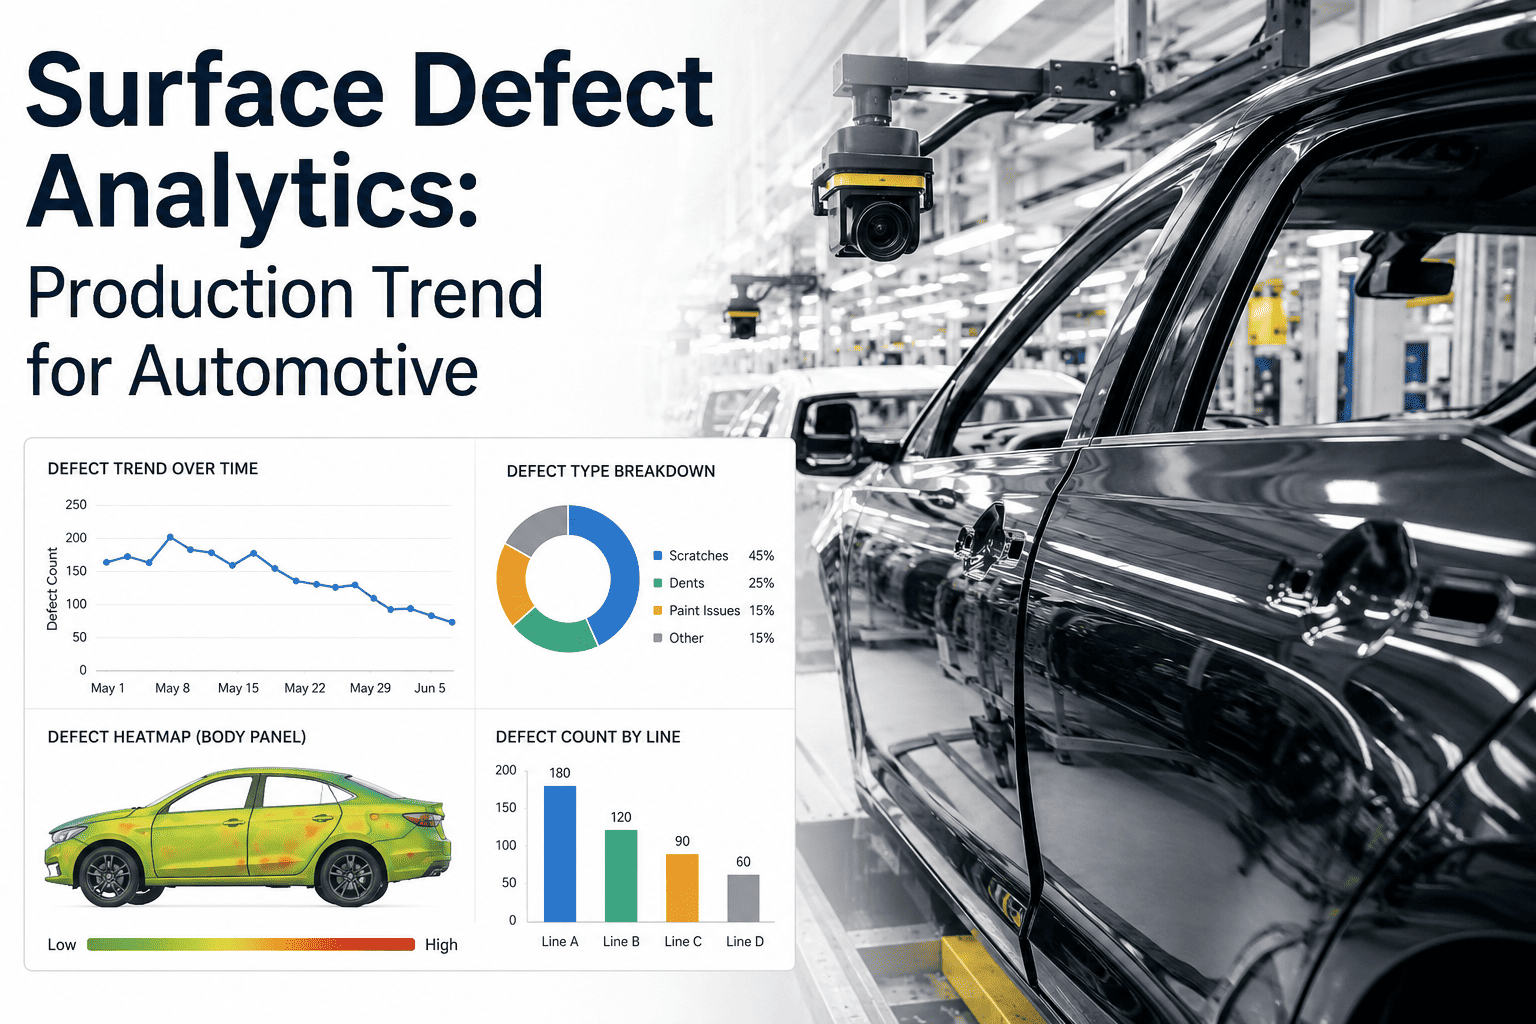
Most plants can tell you how many panels failed surface inspection last week, but very few can tell you why those failures cluster on the third shift, on a specific press, or after a particular supplier's material lot arrives — and that gap is where the real cost of poor quality hides. Every AI vision inspection generates structured defect data: type, location, severity, timestamp, station, and often the specific material lot in production at the time. Left unanalyzed, that data is just a longer rejection log. Correlated against station, shift, model variant, and supplier source, it becomes the fastest root cause tool a quality team has ever had. Plants ready to turn inspection logs into a defect intelligence system can Book a Demo to see production trend analytics on live defect data.
Your Inspection System Already Has the Answer to "Why" — It's Just Not Being Analyzed
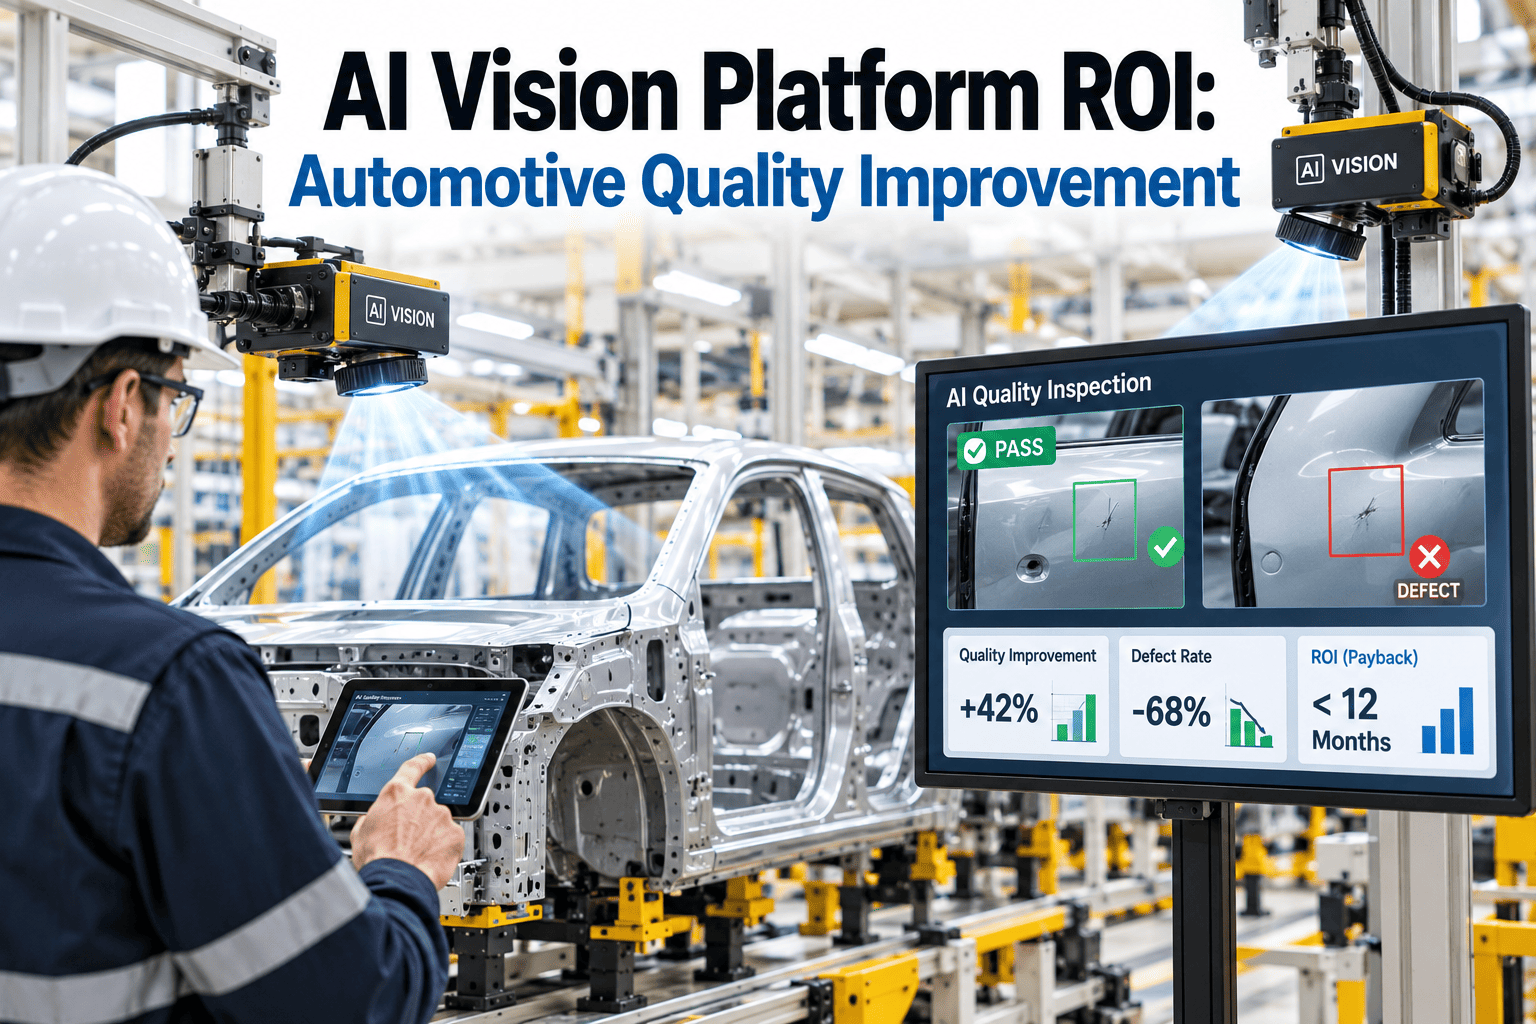
iFactory turns every AI vision detection into structured trend data, correlating defect type against station, shift, model, and supplier material to surface root causes your rejection log alone never would.
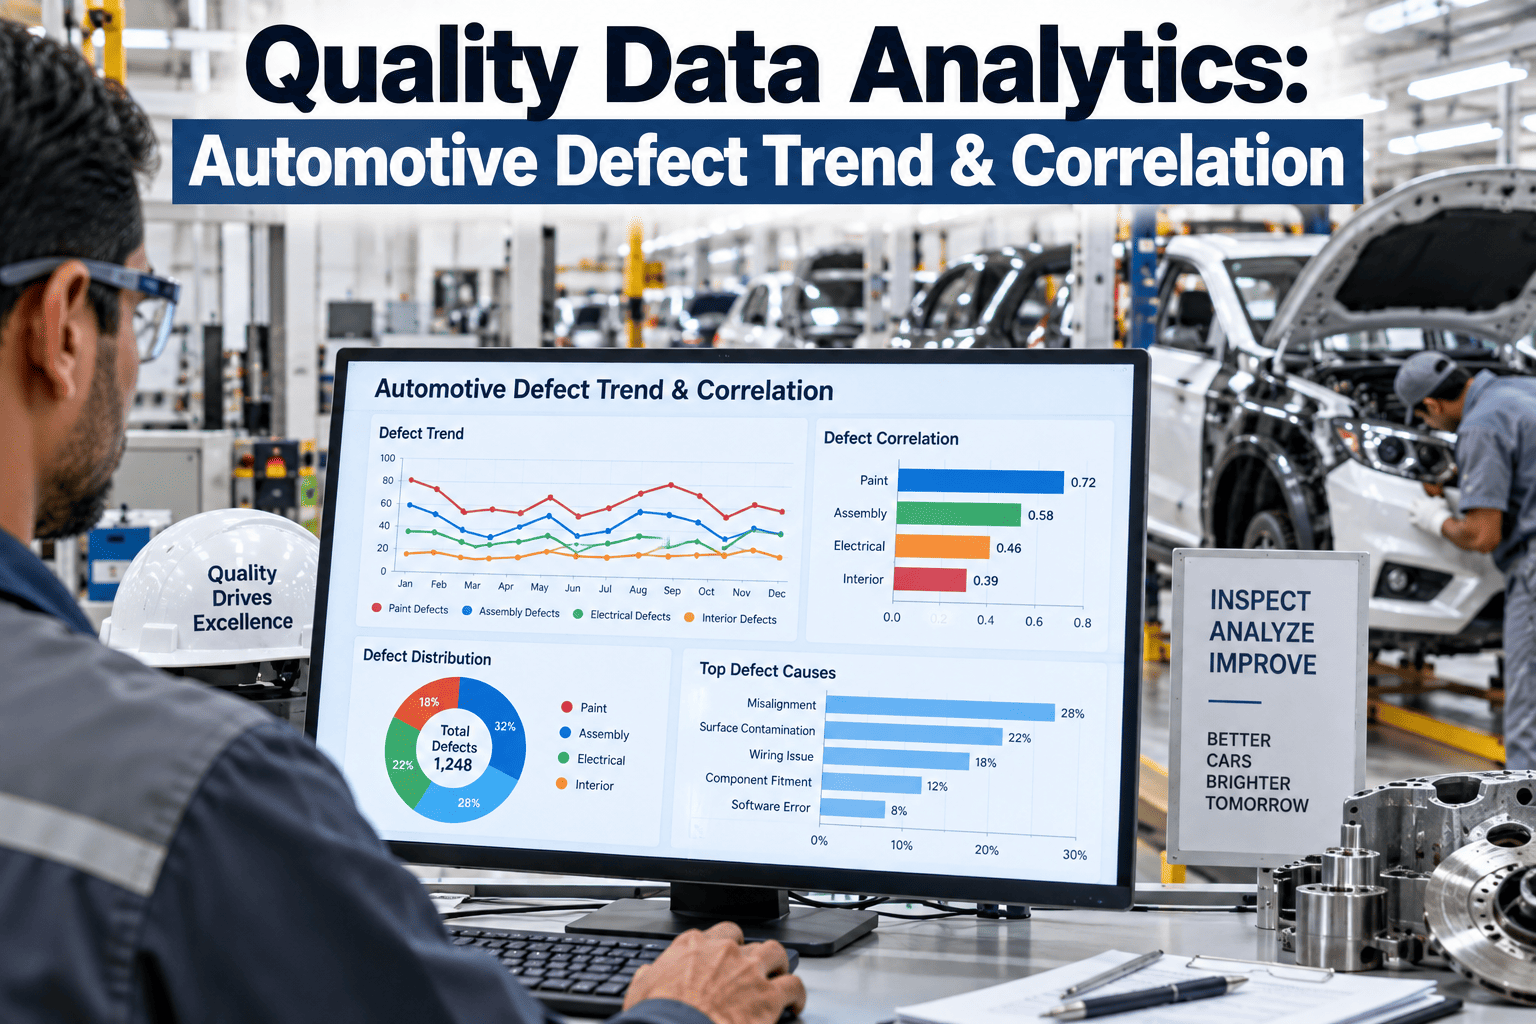
Four Correlations That Turn Defect Logs Into Root Cause
A defect count by itself tells you volume. A defect count correlated against production variables tells you cause. These four correlations consistently surface the fastest wins for quality and process engineering teams once defect data is structured and searchable rather than trapped in disconnected inspection reports.
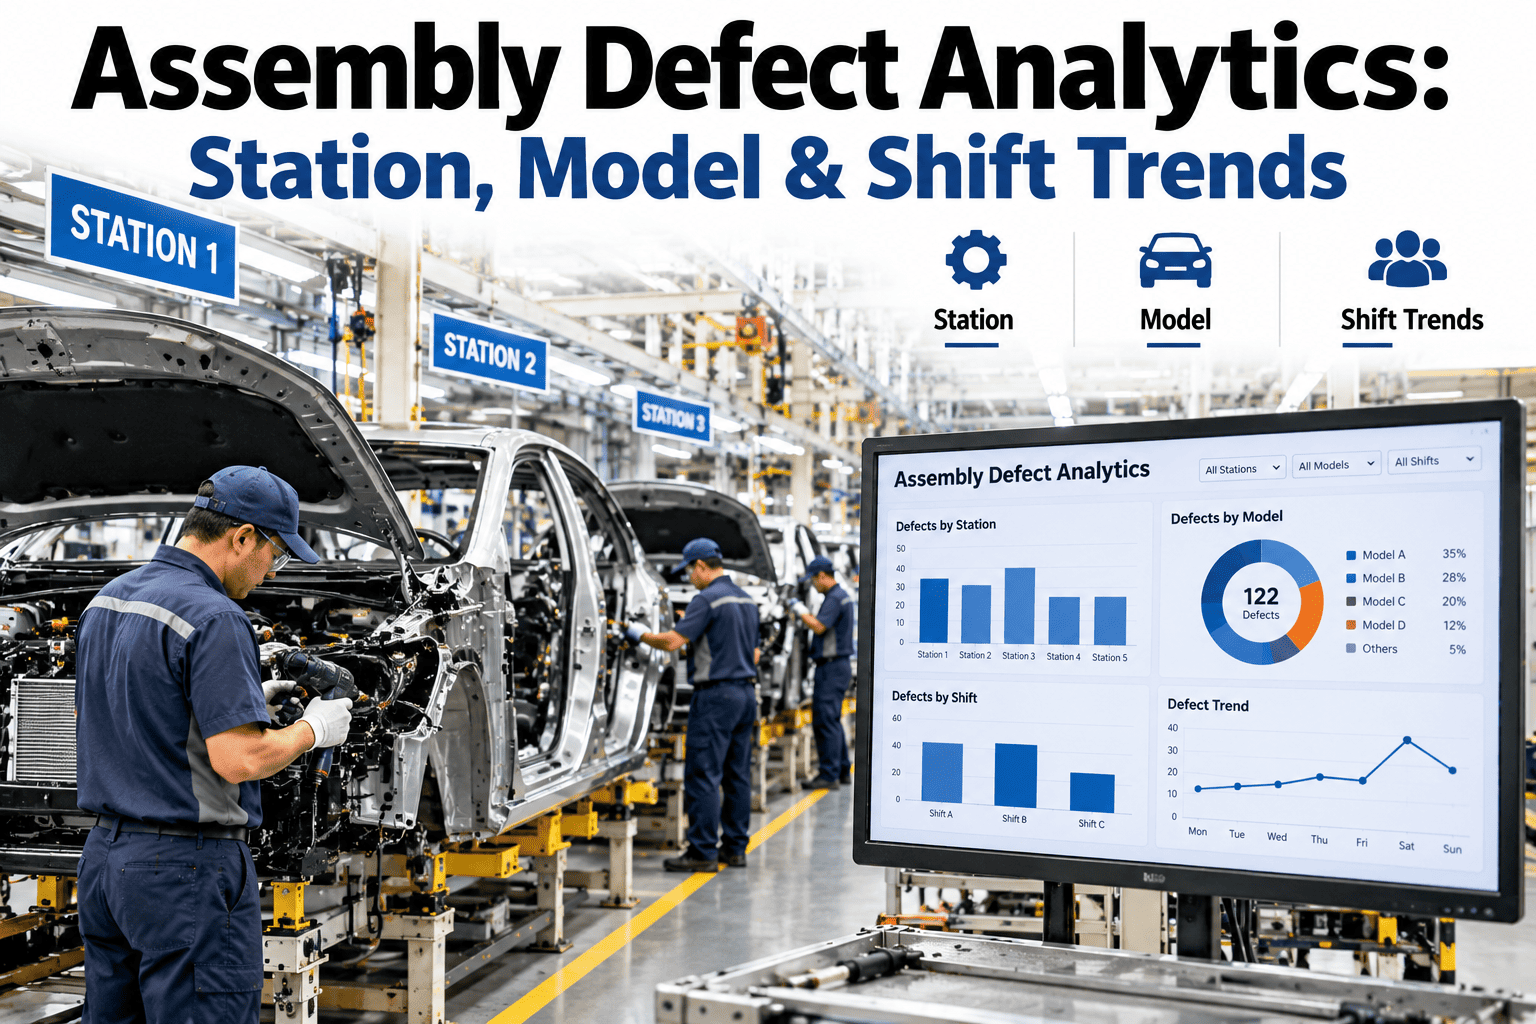
Identifies which specific station or tool is producing the majority of a given defect type — isolating a worn die or misaligned fixture in days instead of weeks.
Reveals whether a defect pattern tracks with a specific shift, pointing toward process adherence, training gaps, or equipment drift over the day.
Flags defects concentrated on a specific vehicle model or trim variant, often pointing to a design tolerance or fixture setup issue unique to that build.
Links defect spikes to specific incoming material lots, giving supplier quality teams objective evidence for corrective action requests.
From Raw Detection to Actionable Trend — The Data Pipeline
Structured defect analytics depends on capturing the right context at the moment of detection, not reconstructing it afterward from disconnected systems. The pipeline below is what separates a usable trend dashboard from a static defect count.
Detection Event Capture
Every flagged defect is logged with type, severity, image reference, and precise timestamp at the moment of inspection.
Production Context Tagging
Station ID, shift, operator, model variant, and material lot are automatically attached to each detection from connected line systems.
Trend Aggregation
Detections are rolled up by hour, shift, and station to surface patterns invisible in individual inspection reports.
Root Cause Dashboard
Quality engineers query trend data directly — filtering by defect type, date range, and station to isolate the variable driving a spike.
Sample Trend Signal: Isolating a Die Wear Pattern
The table below reflects a real pattern type common in stamped panel production — a gradual defect rate increase traced to a single die approaching its service interval, surfaced through station-level trend data rather than a single inspection failure.
| Week | Station 4 Defect Rate | Plant Average | Signal |
|---|---|---|---|
| Week 1 | 0.8% | 0.9% | Normal |
| Week 2 | 1.1% | 0.9% | Watch |
| Week 3 | 1.9% | 0.9% | Elevated |
| Week 4 | 2.8% | 1.0% | Die service flagged |
| Week 5 (post-service) | 0.7% | 0.9% | Resolved |
Catch the Trend Before It Becomes a Recall-Level Problem
Station-level trend data flags gradual drift days or weeks before it would surface as a spike in your weekly rejection report.
What Quality Teams Do With Analytics They Didn't Have Before
Structured defect analytics changes the day-to-day work of quality and process engineering teams from reactive firefighting toward targeted, evidence-based improvement.
Targeted Corrective Action
Engineering time goes to the specific station or supplier driving the defect trend, not a generalized line-wide investigation.
Supplier Scorecarding
Objective, timestamped defect-to-material-lot correlation strengthens supplier corrective action requests with evidence instead of anecdote.
Predictive Maintenance Signals
Gradual defect rate creep at a single station becomes an early warning for tooling service, ahead of a scheduled maintenance interval.
Shift Performance Visibility
Shift-level trend comparison surfaces training or process adherence gaps that aggregate plant-wide numbers would otherwise hide.
Frequently Asked Questions
What production data does defect analytics need to correlate against?
At minimum, useful trend analysis needs station or camera ID, shift and timestamp, and ideally model or trim variant and incoming material lot number pulled from your MES or ERP system. The more production context attached automatically at the moment of detection, the more specific the correlations the system can surface — a defect count alone only tells you volume, while contextualized data tells you cause. iFactory's integration phase maps which of these data points are already available in your systems and which require a lightweight connector. Teams can Book a Demo to see what a mapped integration looks like.
How quickly can trend analytics surface a root cause?
Once station and shift context is attached to detection data, a defect pattern concentrated on a specific station or shift typically becomes visible within days of onset, rather than the weeks it can take to notice a gradual trend in a manual weekly rejection report. Sharp defect spikes tied to a specific material lot or fixture change are often visible within hours, since the correlation is immediate once the data structure exists. The speed of root cause identification depends primarily on how quickly production context reaches the analytics platform.
Can this data feed into existing quality or MES dashboards?
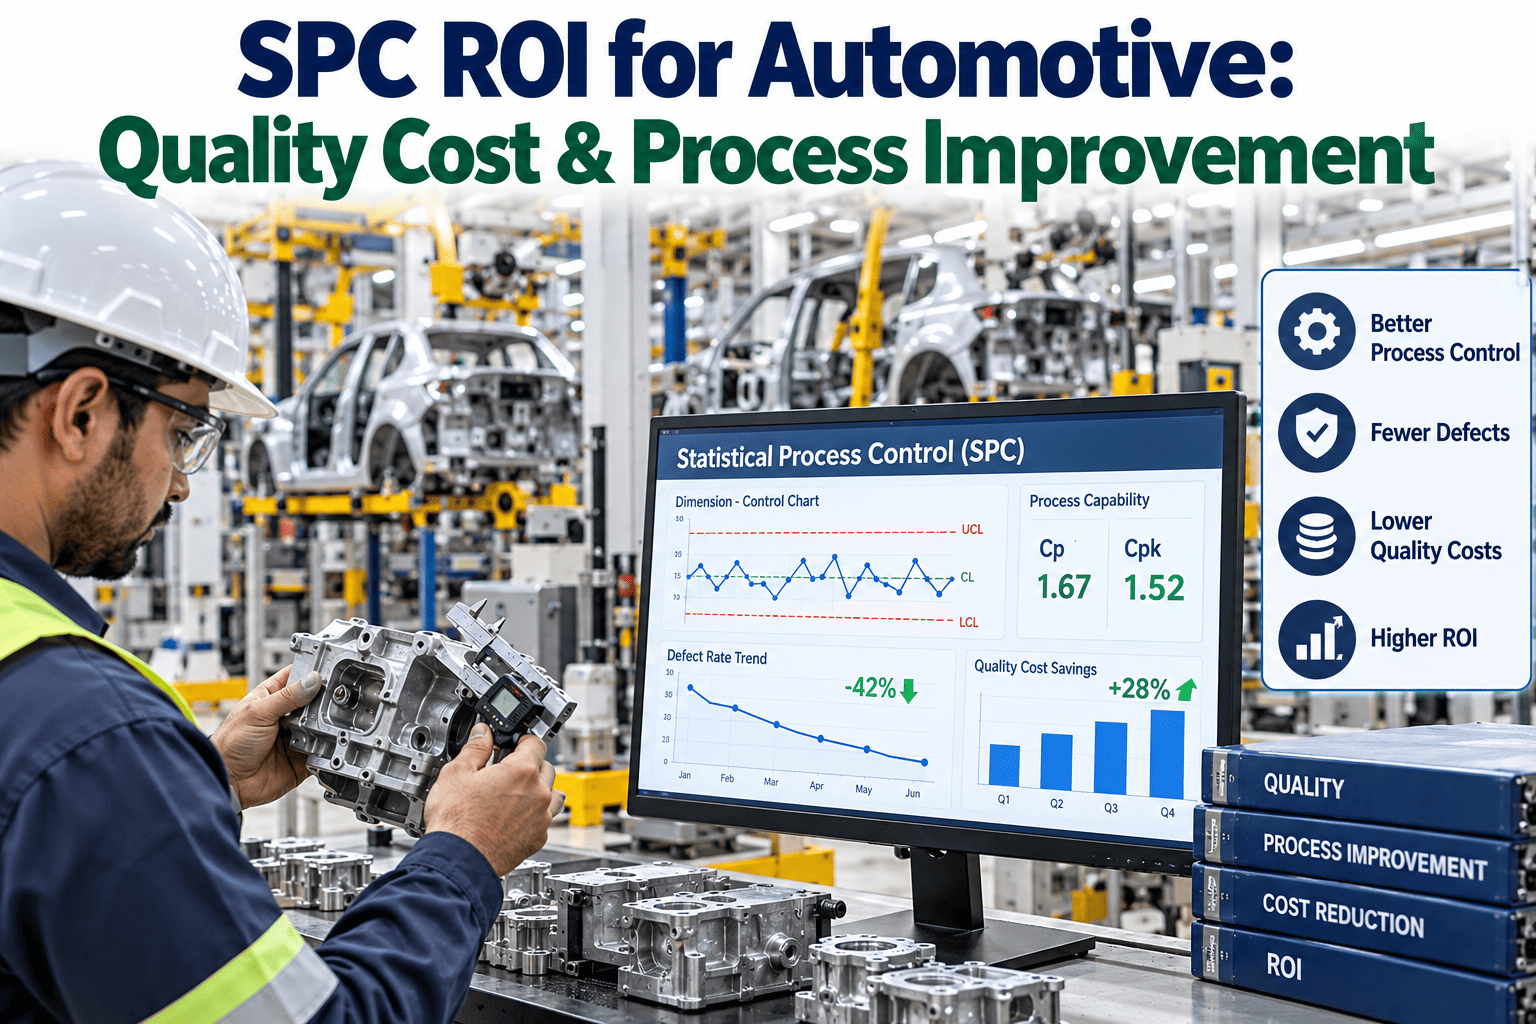
Yes — trend data and correlation reports export through standard integration methods into existing MES, SPC, and quality management platforms, so defect trend visibility sits alongside other production metrics your team already monitors rather than existing in a separate tool. This is particularly valuable for teams that already run statistical process control dashboards, since defect correlation data extends those existing views rather than replacing them. Reach out to iFactory Support for integration specifics on your platform.
Does this require replacing our current AI vision inspection system?
Not necessarily — if your current system already captures structured detection data with timestamps and defect classification, analytics can often be layered on top by connecting that data to production context from your MES or ERP. Deployments starting from scratch benefit from designing the analytics layer alongside the inspection system from day one, since data structure decisions made early make trend correlation significantly more reliable later.
How long does it take to see useful trend patterns after deployment?
Basic station and shift correlation typically becomes statistically meaningful within 2 to 4 weeks of production data, once enough detection volume has accumulated to distinguish real patterns from normal variation. Supplier material correlation can take longer to surface clearly if material lot changes are infrequent, since the analysis depends on having enough lot transitions to compare against. Most quality teams see their first actionable finding — a station, shift, or supplier pattern worth investigating — within the first month of live data.
Turn Your Inspection Log Into a Root Cause Engine
iFactory structures every AI vision detection with full production context, correlating defect trends against station, shift, model, and supplier data — so your quality team investigates causes, not symptoms.