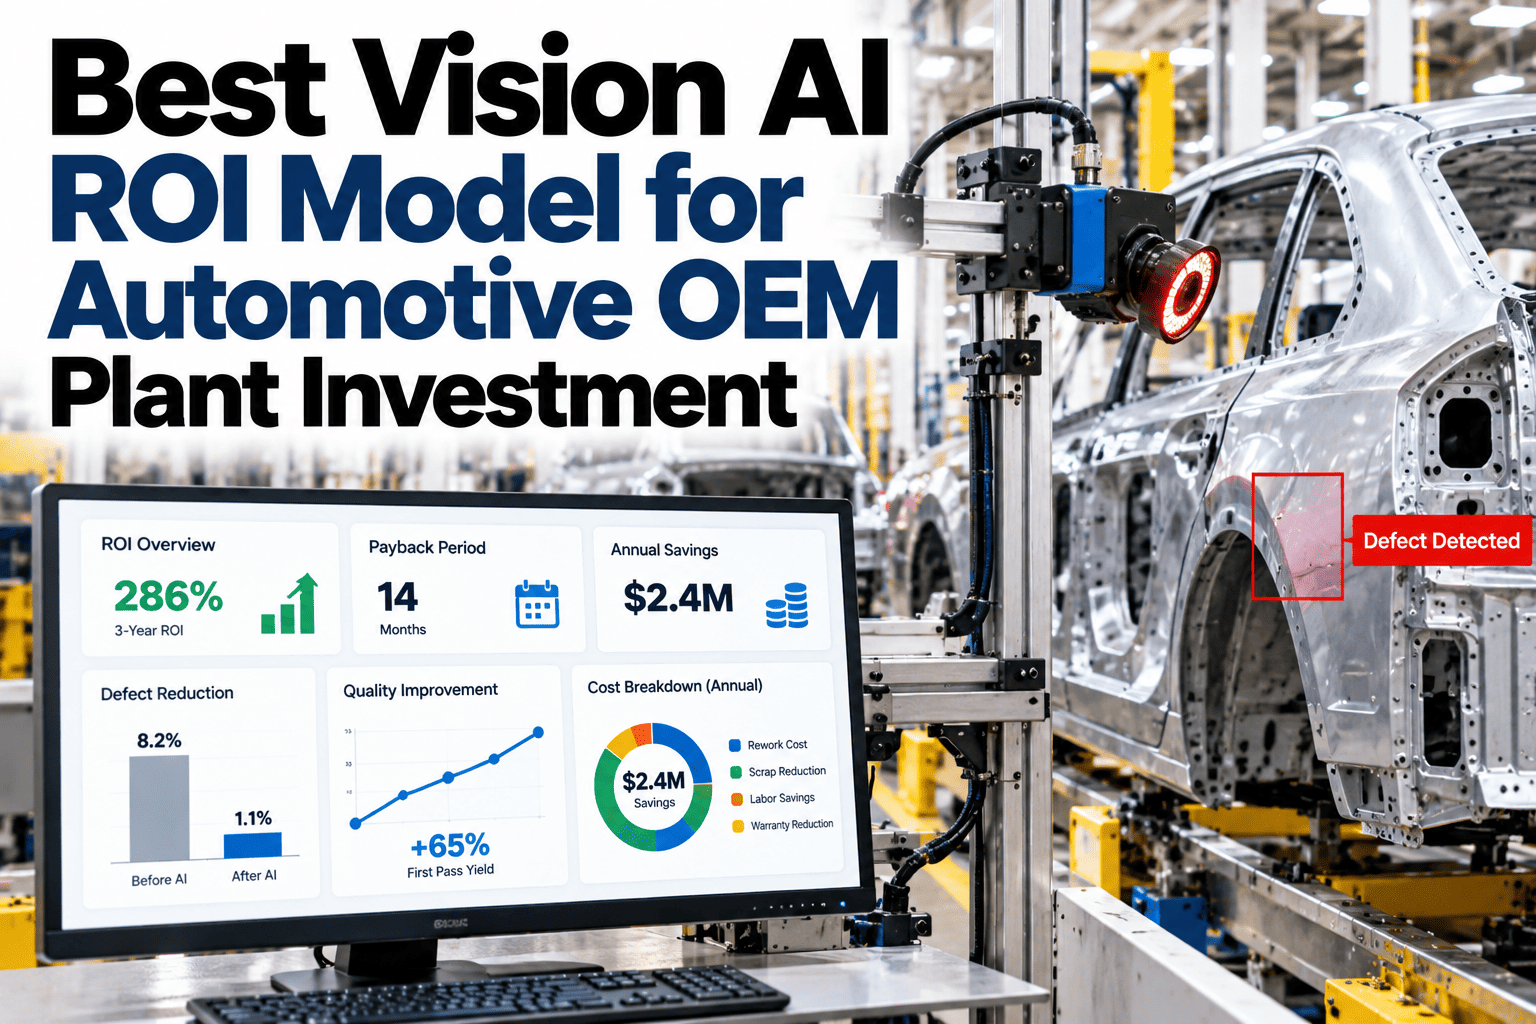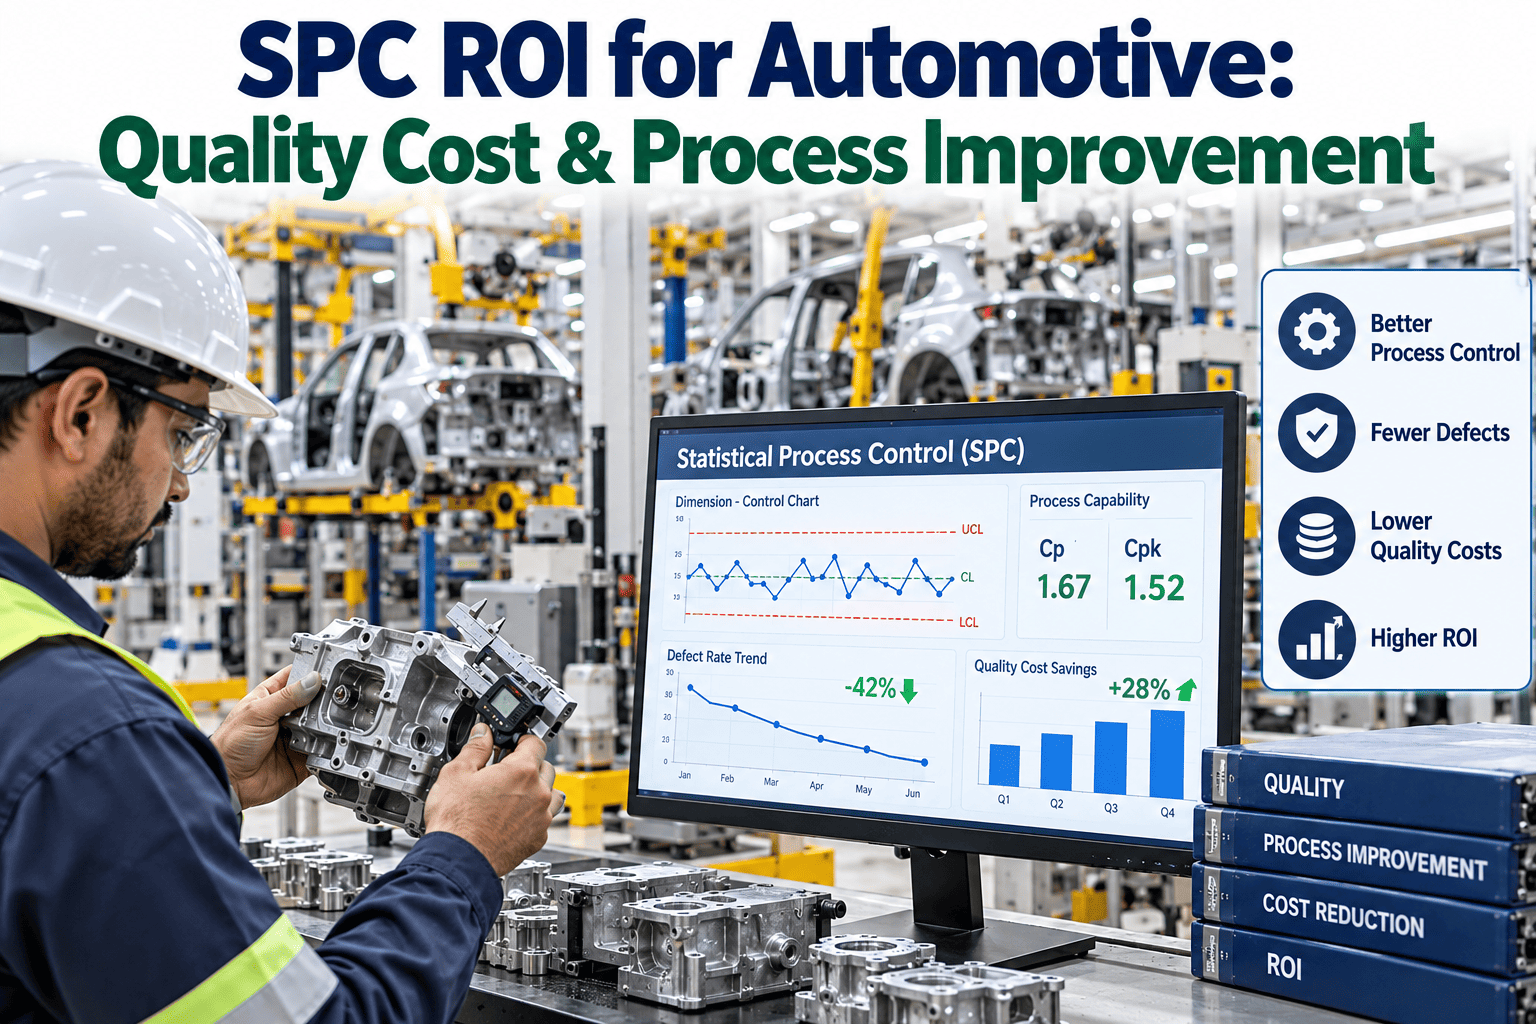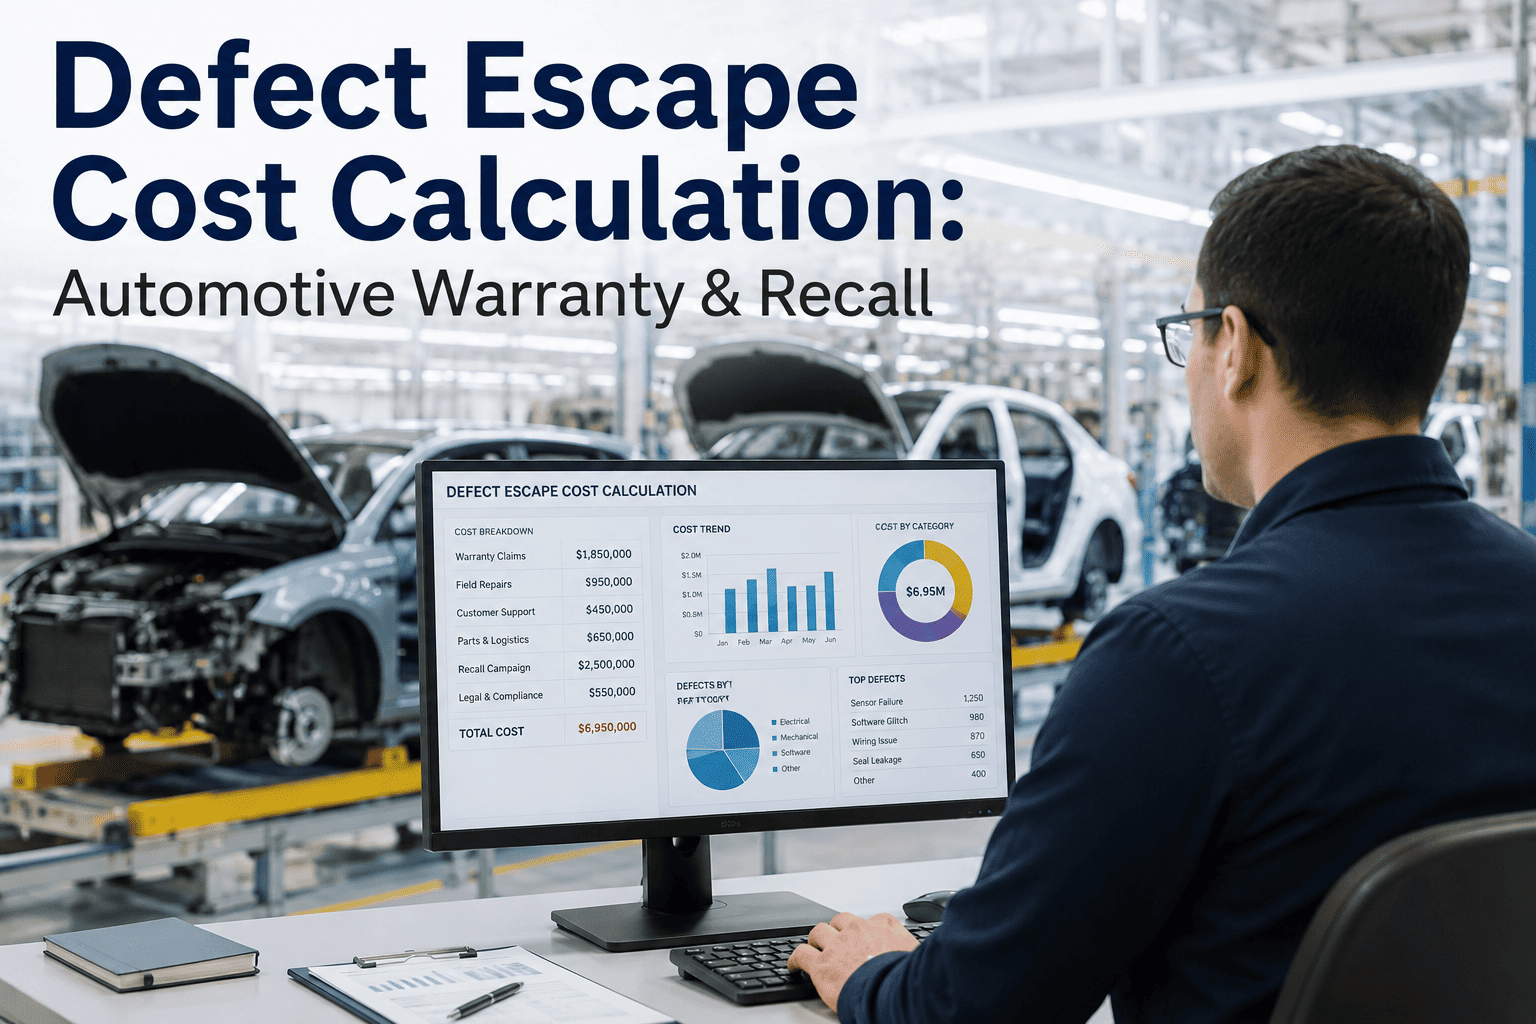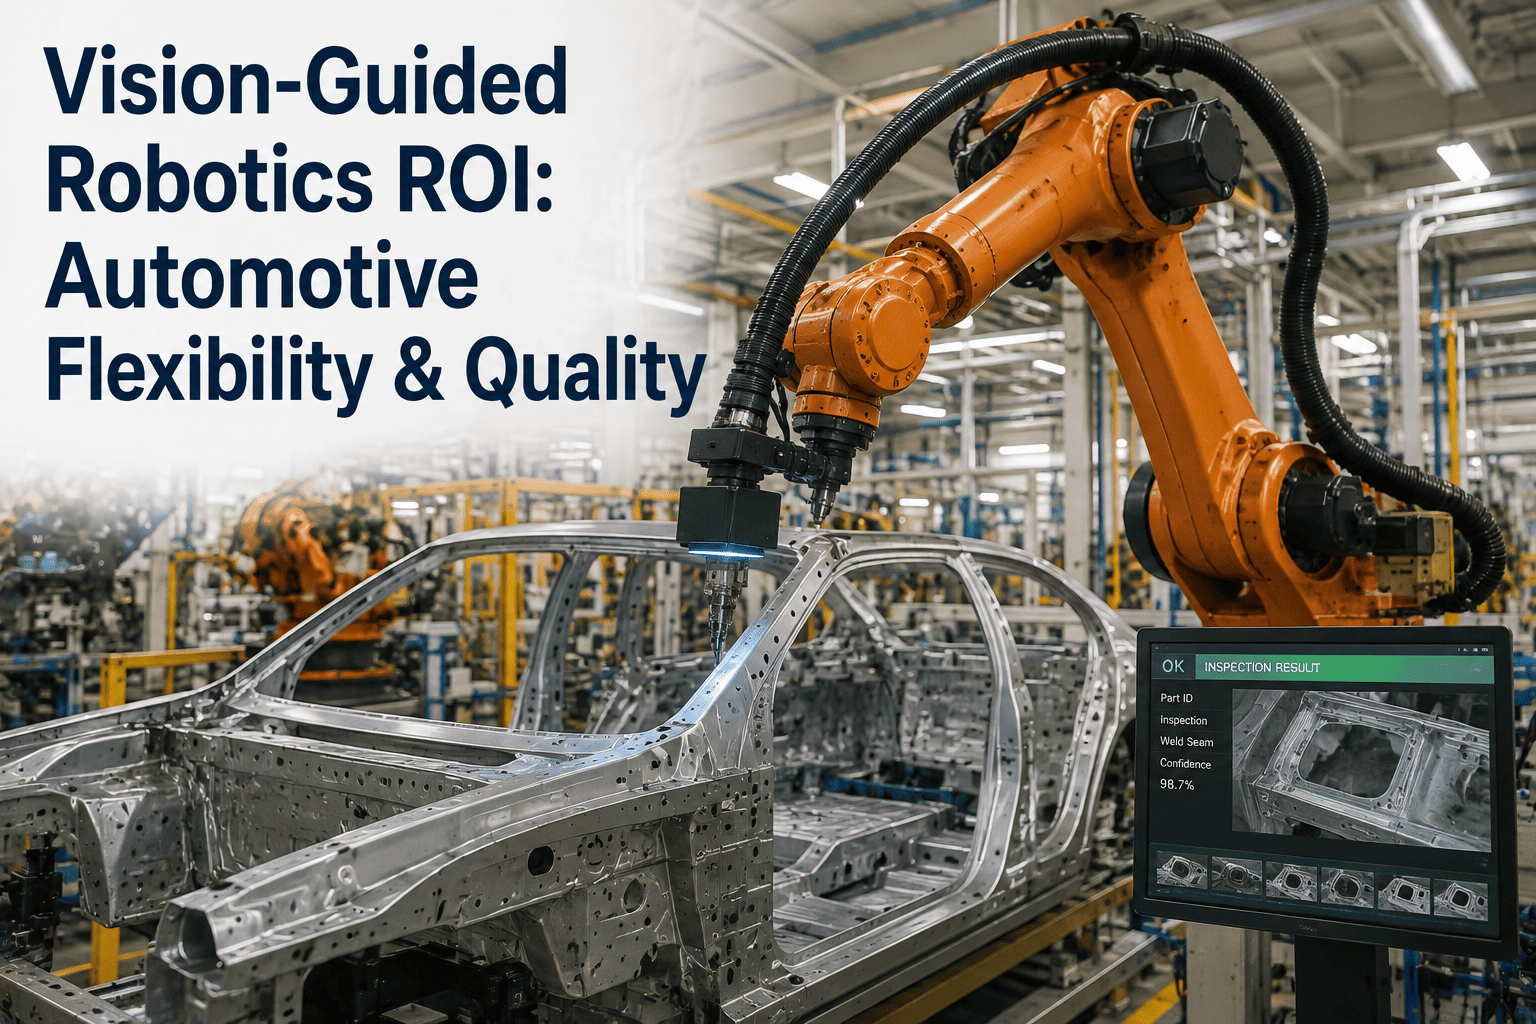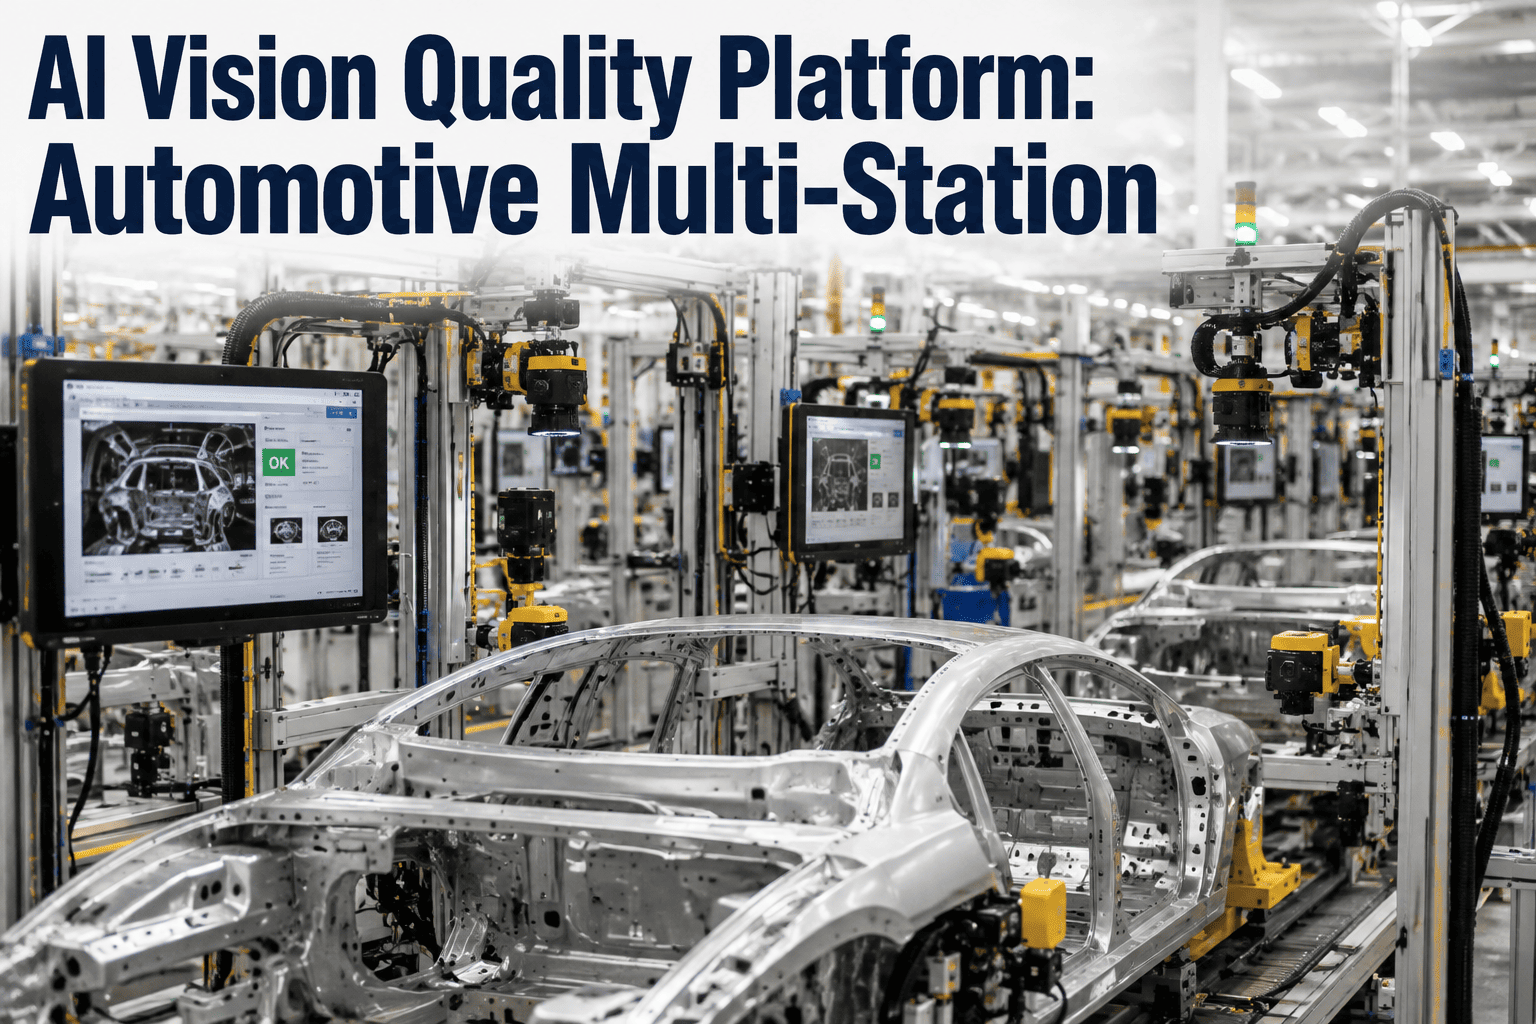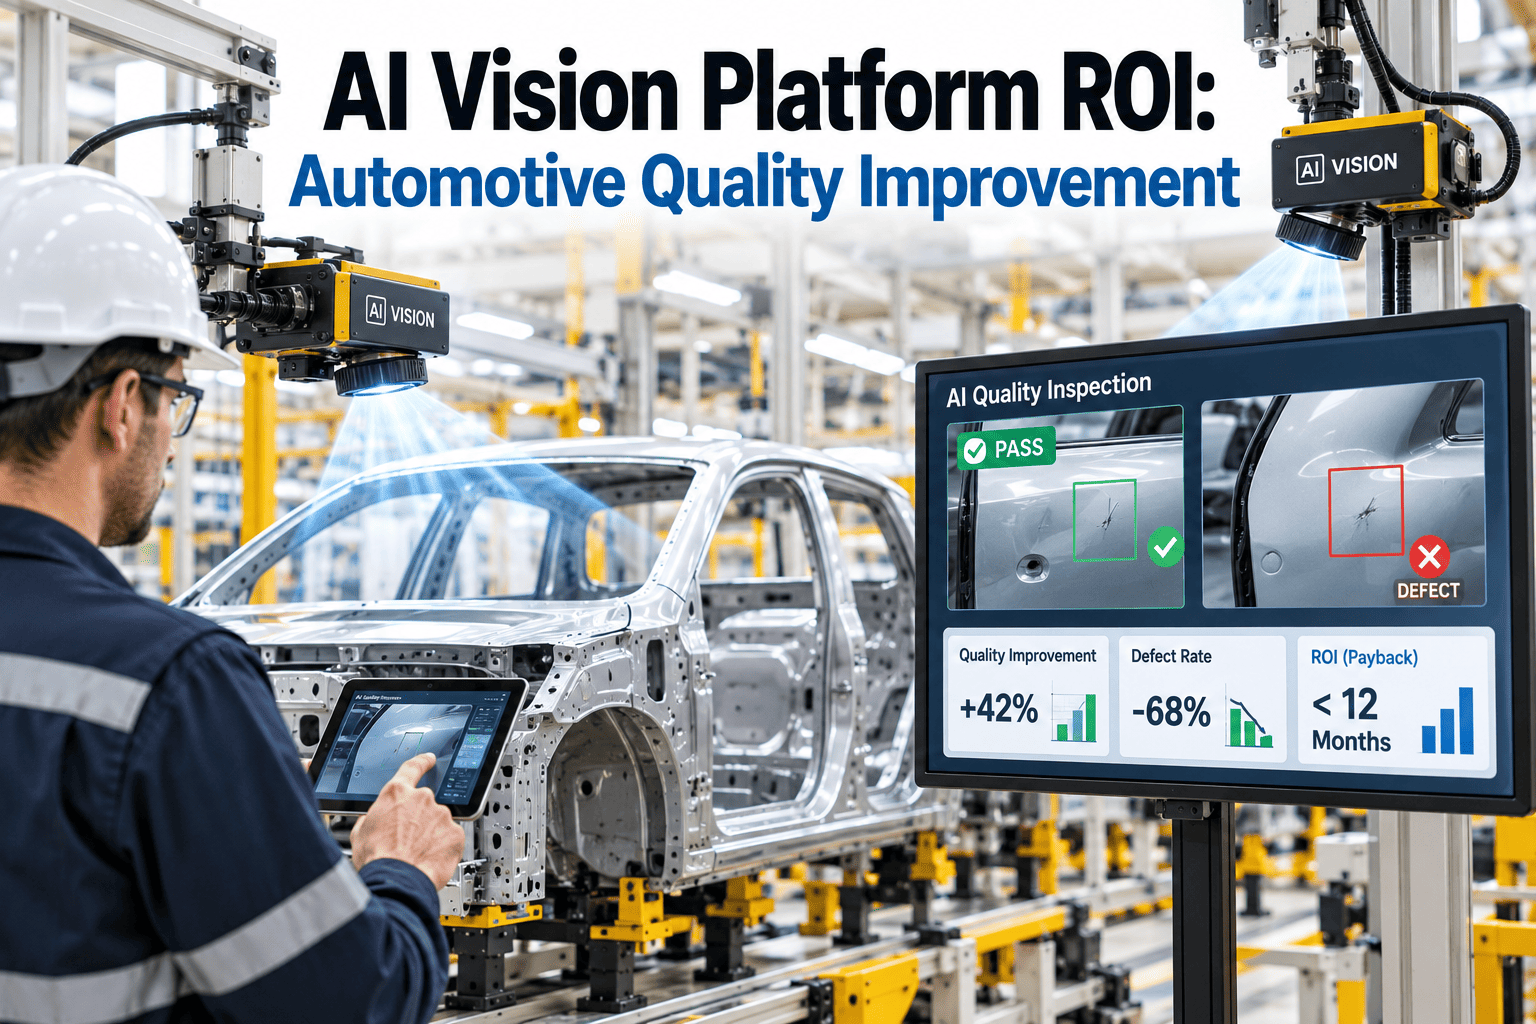
A single AI vision inspection station is relatively easy to justify: point it at one high-defect-rate process, measure the defect catch rate, and calculate payback against the camera and integration cost. The math gets more complicated once a plant has five, ten, or twenty vision stations spread across paint, weld, stamping, and final assembly, each justified individually but rarely evaluated as a connected platform. That fragmented view chronically understates the real return, because it misses the compounding value of shared infrastructure, cross-station defect correlation, and the labor reallocation that happens once inspection stops being a bottleneck at every single station. This page walks through how to calculate AI vision ROI at the platform level rather than station by station, what gets missed when stations are evaluated in isolation, and how to build a business case that finance actually finds convincing. You can book a demo to see how iFactory quantifies platform-level ROI across your existing and planned vision stations.
Single-Station ROI Math Misses Most of the Value a Vision Platform Actually Creates
iFactory calculates ROI across every connected vision station, capturing shared infrastructure savings and cross-station defect correlation that station-by-station math leaves out.
Four Value Streams That Only Show Up at the Platform Level
Justifying a single vision station typically focuses on one metric: did this station catch defects that would have otherwise escaped, and does that catch rate justify the hardware and integration cost. That's a reasonable starting question, but it's an incomplete one once multiple stations exist across a plant, because several of the largest value streams only become visible when stations are analyzed together rather than as isolated investments.
Networking, compute, model training pipelines, and integration expertise built for the first station reduce the marginal cost of every subsequent one, a saving that never appears in a single-station calculation.
A defect caught at final assembly can sometimes be traced back to a condition visible at an earlier station, but only if data from multiple stations is analyzed together rather than kept in separate station-level silos.
Freeing up inspection labor at one station has modest impact, but freeing it up consistently across many stations creates a meaningful pool of redeployable labor capacity worth quantifying together.
Aggregated defect data across every station gives quality leadership a plant-wide view that no individual station's data can provide on its own.
What to Include in a Platform-Level Calculation
A credible platform ROI model separates costs and benefits into categories that map to how a finance team actually evaluates capital investment, rather than presenting a single blended payback number that's hard to audit or defend under scrutiny.
| Category | Cost or Benefit | Platform-Level Consideration |
|---|---|---|
| Hardware and Integration | Cost | Marginal cost per additional station drops once shared infrastructure exists |
| Model Training and Maintenance | Cost | A shared retraining pipeline serves multiple stations more efficiently than isolated ones |
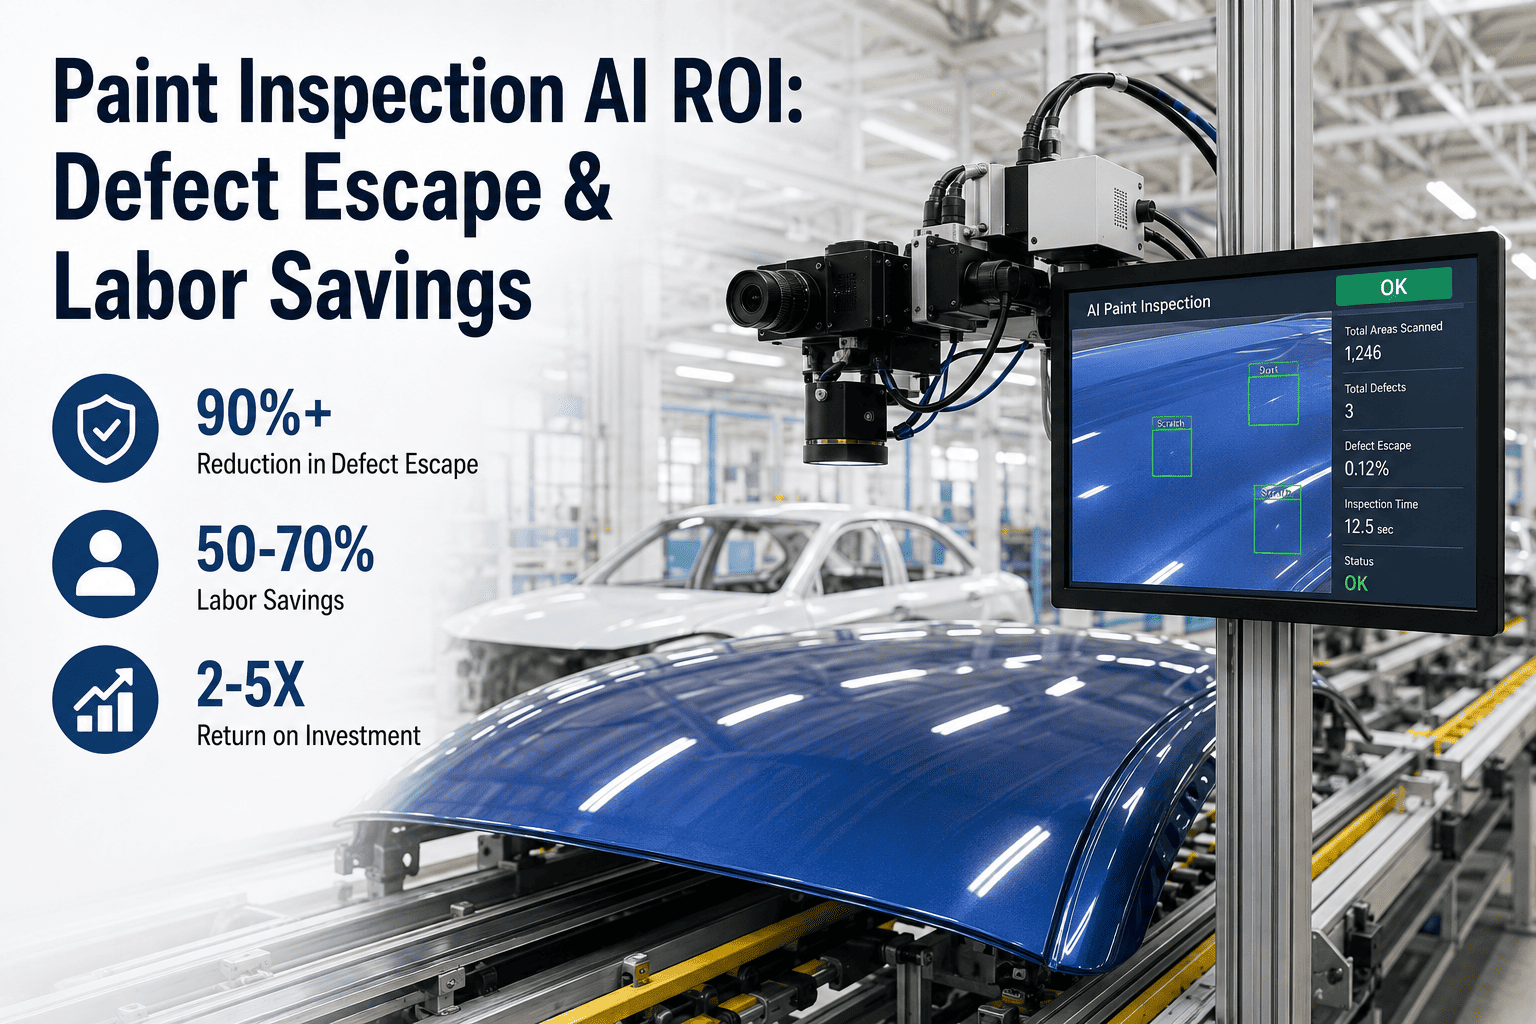
| Defect Escape Reduction | Benefit | Value compounds when escapes are prevented earlier, avoiding cost at every downstream step |
| Labor Reallocation | Benefit | Aggregate freed inspection hours across stations into a single redeployable capacity figure |
| Warranty and Field Cost Avoidance | Benefit | Requires linking vision inspection data to downstream warranty claims by VIN or lot |
Why Catching a Defect Earlier Is Worth More Than the Immediate Repair Cost
One of the most consistently underestimated variables in a vision ROI model is how much more expensive a defect becomes the further downstream it travels before being caught. A defect identified at the exact station where it occurs typically costs only the immediate rework. The same defect, if it escapes to a later station, then to final assembly, then to the customer, accumulates cost at every step, and by the time it surfaces as a warranty claim, the total cost can be many times the original in-station fix.
This escalation is why platform-level ROI models that connect vision inspection data to downstream warranty and field data tend to show a substantially stronger business case than models that only credit a station for defects it directly caught, since the true value includes every downstream cost that catch prevented.
Where Platform ROI Calculations Go Wrong
Ignoring the escalating cost avoidance of catching a defect early versus late understates the true value of each vision station substantially.
Treating every new station as a standalone investment double-counts integration and training costs that are actually shared across the platform.
Assuming freed inspection labor translates directly into headcount reduction, when in practice much of it gets redeployed to higher-value quality tasks rather than eliminated.
Leaving out warranty cost avoidance because the data connection is harder to build understates ROI on exactly the value stream that's often largest.
What It Takes to Actually See ROI at the Platform Level
Calculating platform-level ROI isn't just a matter of adding up individual station benefits on a spreadsheet, it requires the underlying data from each station to actually be connected in a way that supports cross-station analysis. Without that connection, the theoretical value streams described above remain theoretical, since no one can actually trace a final assembly defect back to an earlier station's inspection result, or link a specific vision catch to a warranty claim that didn't happen.
Every station's inspection result needs to be tagged with a common vehicle or component identifier so results from different stations can be joined together for the same unit.
A shared defect classification system across stations makes it possible to correlate related defect types found at different points in the process rather than treating each station's findings in isolation.
Connecting inspection records to downstream warranty claims by VIN closes the loop needed to credit vision stations with the full downstream cost avoidance of each catch.
A single reporting view spanning all stations, rather than separate dashboards per station, is what actually lets quality and finance teams see the platform-level picture rather than reconstructing it manually.
Framing the ROI Model the Way Finance Actually Evaluates Investment
A quality-driven ROI presentation and a finance-driven capital evaluation don't always speak the same language, and bridging that gap matters for getting platform expansion actually approved rather than stalling in review. Finance teams typically want to see costs broken into clear categories, a defensible payback period calculation, and a clear-eyed acknowledgment of which benefits are highly confident versus more speculative.
Separating the ROI model into a conservative case, built only on directly measurable defect catch and labor reallocation data, and an expanded case that includes warranty cost avoidance and cross-station correlation benefits, tends to land better with finance stakeholders than presenting a single blended number that mixes highly confident and more speculative benefits together without distinction. The conservative case alone is often still compelling, and framing the expanded case as meaningful upside rather than a required assumption builds more credibility for the overall proposal.
It also helps to present the marginal cost curve explicitly, showing how the cost of each additional station declines as shared infrastructure absorbs more of the fixed investment, since this is often the single clearest way to demonstrate why platform-level thinking produces a stronger business case than evaluating each station in isolation.
A Practical Path to Platform-Level ROI Tracking
Document every current vision inspection station, what it checks, and what data it currently captures as the starting point for a platform-level view.
Confirm every station tags results with a shared VIN or build identifier so cross-station correlation becomes possible.
Build the link between inspection records and downstream warranty claims to credit stations with full downstream cost avoidance.
Present both a conservative, directly measurable ROI case and an expanded case including cross-station and warranty benefits for finance review.
Recalculating ROI Once Three Stations Were Viewed as One Platform
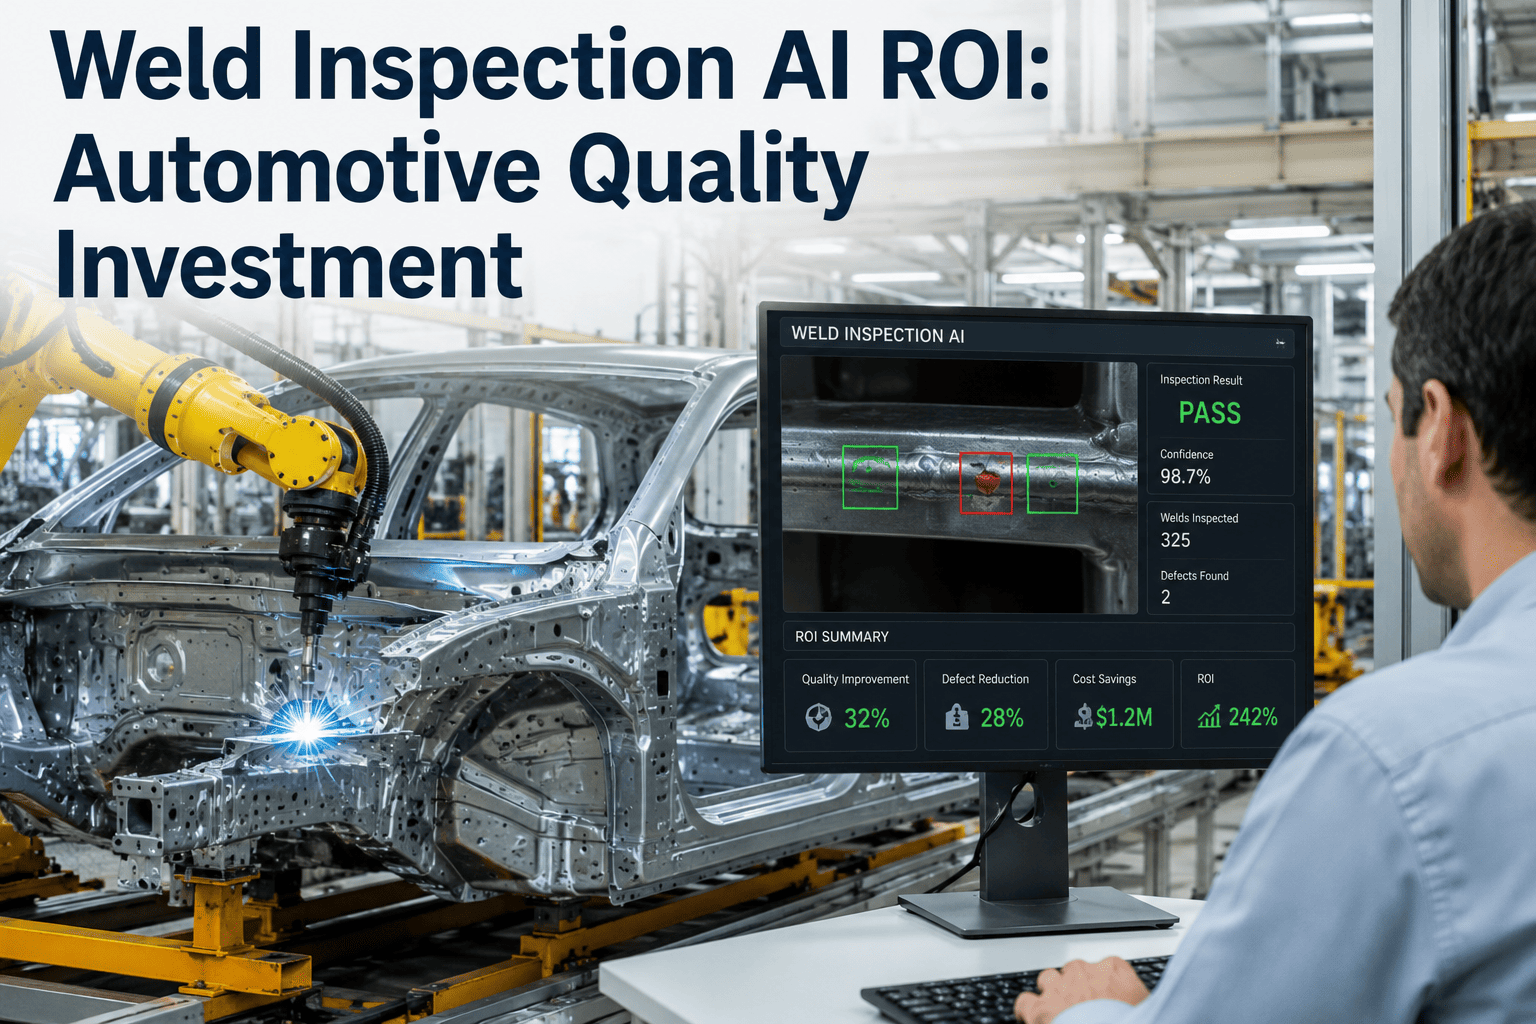
Three separate vision stations across paint, weld, and final assembly had each been individually justified based on direct defect catch rate alone, with each showing a modest but acceptable payback period on its own.
Once analyzed together, shared model training infrastructure reduced the effective cost of the third and any future station significantly, and cross-station correlation revealed that a subset of final assembly defects traced back to an upstream weld condition the earlier station's data could flag. Combined with warranty data showing the true downstream cost of escapes, the platform-level payback period was substantially shorter than any individual station's calculation suggested.
Why Sequencing Station Deployment Matters for ROI
The order in which vision stations get deployed across a plant meaningfully affects both the total investment required and how quickly the platform starts generating cross-station value. Deploying stations at points in the process where defects are most costly to catch late, rather than simply the easiest stations to implement first, tends to produce a stronger early ROI signal that builds momentum and credibility for continued platform investment.
There's also a practical sequencing argument for building shared infrastructure, networking, compute, and a model training pipeline, ahead of or alongside the first couple of stations rather than treating each station as a fully standalone build. Plants that architect for platform expansion from the start, even if only two stations exist initially, tend to see meaningfully lower marginal costs for stations three through ten than plants that built each earlier station without anticipating future expansion.
Finally, it's worth sequencing warranty and cross-station data integration work in parallel with hardware deployment rather than as an afterthought tackled once several stations are already running. Retrofitting that data connectivity after the fact is generally more expensive and time-consuming than building it in from the start, and delaying it means the platform-level ROI case can't be fully realized until that integration work is eventually completed.