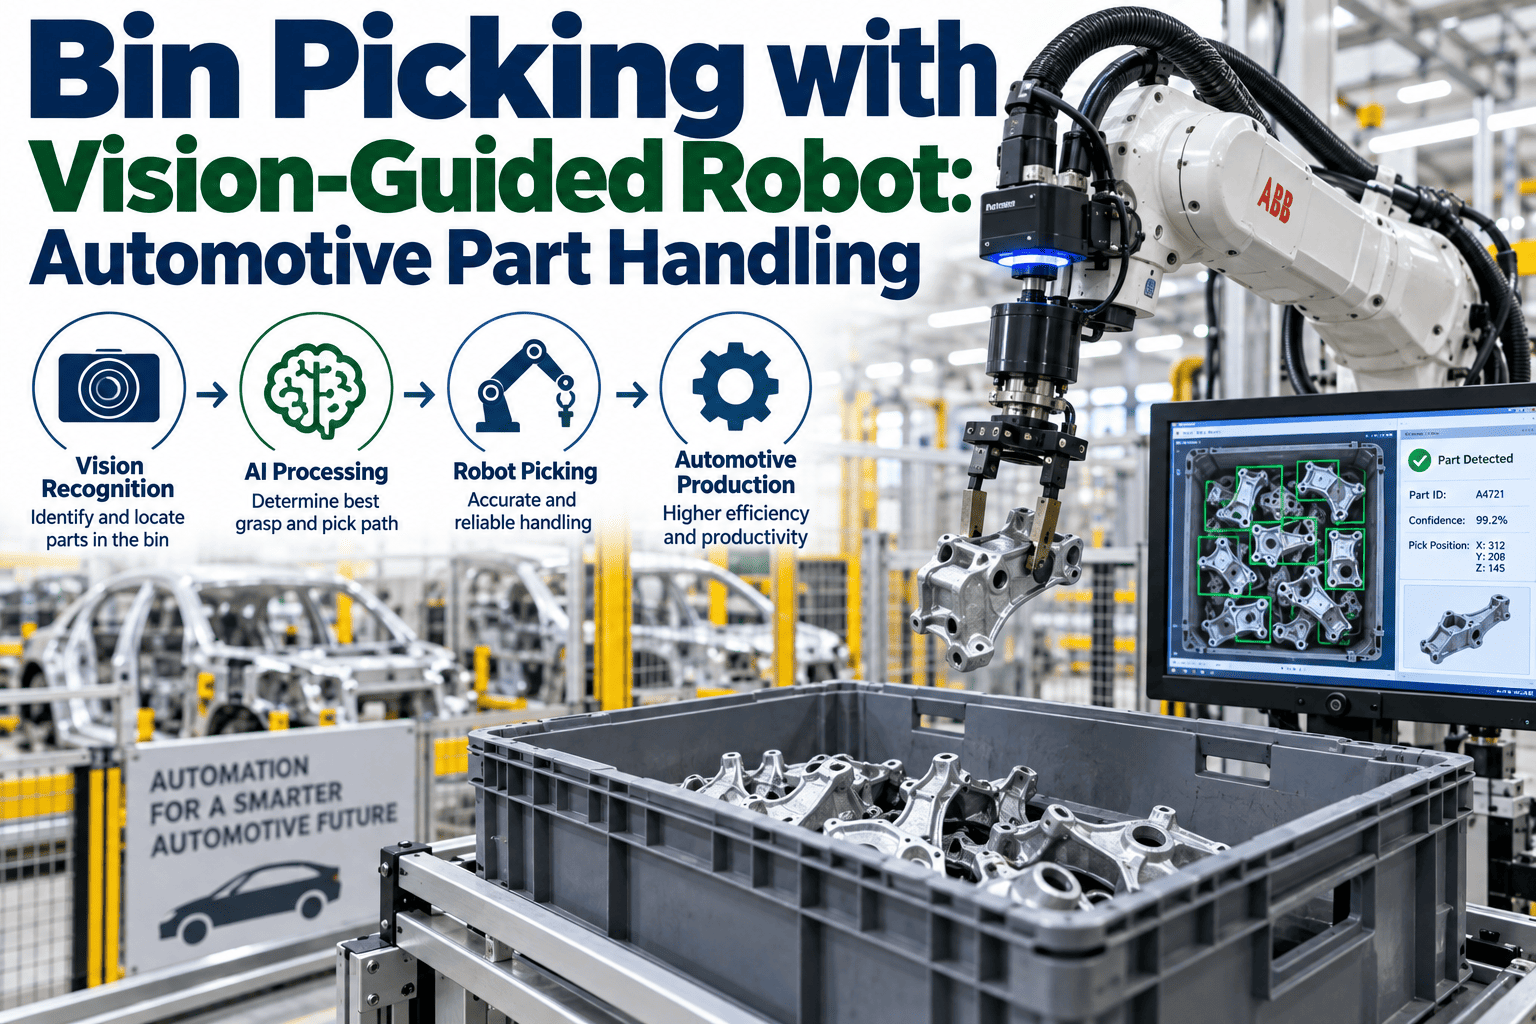
Every capital request for vision-guided robotics on an automotive line eventually lands on the same finance committee question: what does this actually return, beyond the vague promise of "better automation"? Fixed-path robots have a well-understood ROI story built almost entirely around labor displacement and cycle time. Vision-guided robots earn their premium cost through a different mechanism — they keep running correctly when the part shifts, when the model changes, when the tolerance stack drifts — and that value is real but harder to put a number on than a simple headcount reduction. Automotive engineering teams that have tried to build this business case from scratch know the frustration of a spreadsheet that captures labor savings cleanly and then goes vague exactly where the flexibility and quality benefits should be. iFactory's applications engineering team works through this calculation with plants regularly enough to have a structured way of making the flexibility and quality value concrete rather than aspirational.
Calculating Vision-Guided Robotics ROI Through Flexibility and Quality, Not Just Labor
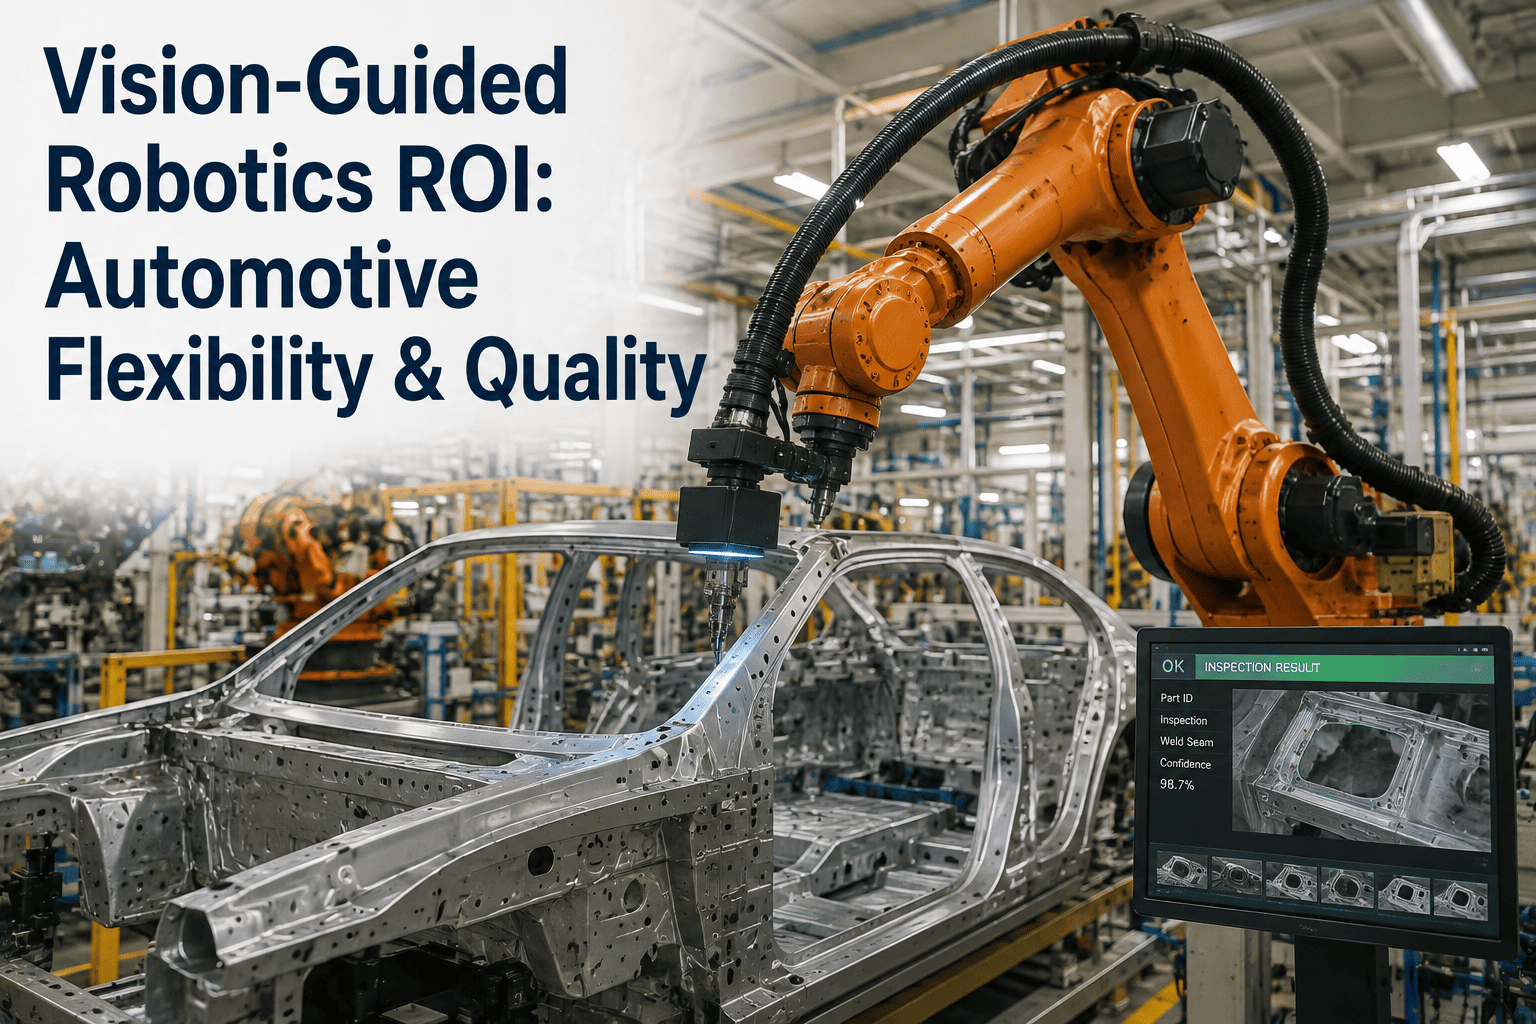
The strongest ROI case for vision-guided robotics in automotive assembly usually isn't the labor line — it's the flexibility to handle part variation without hard tooling changes and the quality improvement from catching what fixed automation would have missed. This page breaks down how to quantify both.
Labor Displacement Alone Undervalues Vision-Guided Robotics
The traditional robotics business case is straightforward: count the operators the robot replaces, multiply by fully loaded labor cost, compare against the robot's installed cost, and calculate payback in months. That model works reasonably well for fixed-path pick-and-place automation doing a repetitive task with tightly controlled part presentation. It systematically undervalues vision-guided robotics, because vision guidance isn't primarily solving a labor problem — it's solving a part-variation and quality problem that fixed-path automation can't touch at all, regardless of how many operators it might otherwise displace.
A plant that installs a vision-guided robot expecting only the labor-displacement return from the standard model is measuring the wrong thing. The real return shows up in fewer line stops from part misalignment, fewer quality escapes from a fixture that's drifted out of tolerance without anyone noticing, and the ability to run a mixed-model line without a separate hard-tooled station for every part variant. None of those benefits appear on a headcount reduction line, and all of them are frequently worth more than the labor savings that got the project approved in the first place.
This isn't an argument against including labor savings in the model — it's an argument against stopping there. A finance committee reviewing a robotics capital request is comparing it against every other capital request competing for the same budget, and a business case that only captures one of three or four real value categories is systematically underselling the investment relative to how it will actually perform once installed. The plants that get the strongest internal support for vision-guided robotics tend to be the ones that build the complete multi-category model up front, rather than the ones that get the project approved on a labor-only case and then have to explain after the fact why the quality and flexibility benefits weren't part of the original justification.
Where Vision Guidance Converts Part Variation Into Line Uptime
Flexibility value is real money, but it only shows up in the calculation once you've defined what fixed-path automation would have needed instead — usually a hard-tooled fixture per part variant, a changeover procedure between variants, and a tolerance for the resulting downtime. The tiles below outline the specific mechanisms where vision-guided robotics converts that fixed cost into ongoing flexibility.
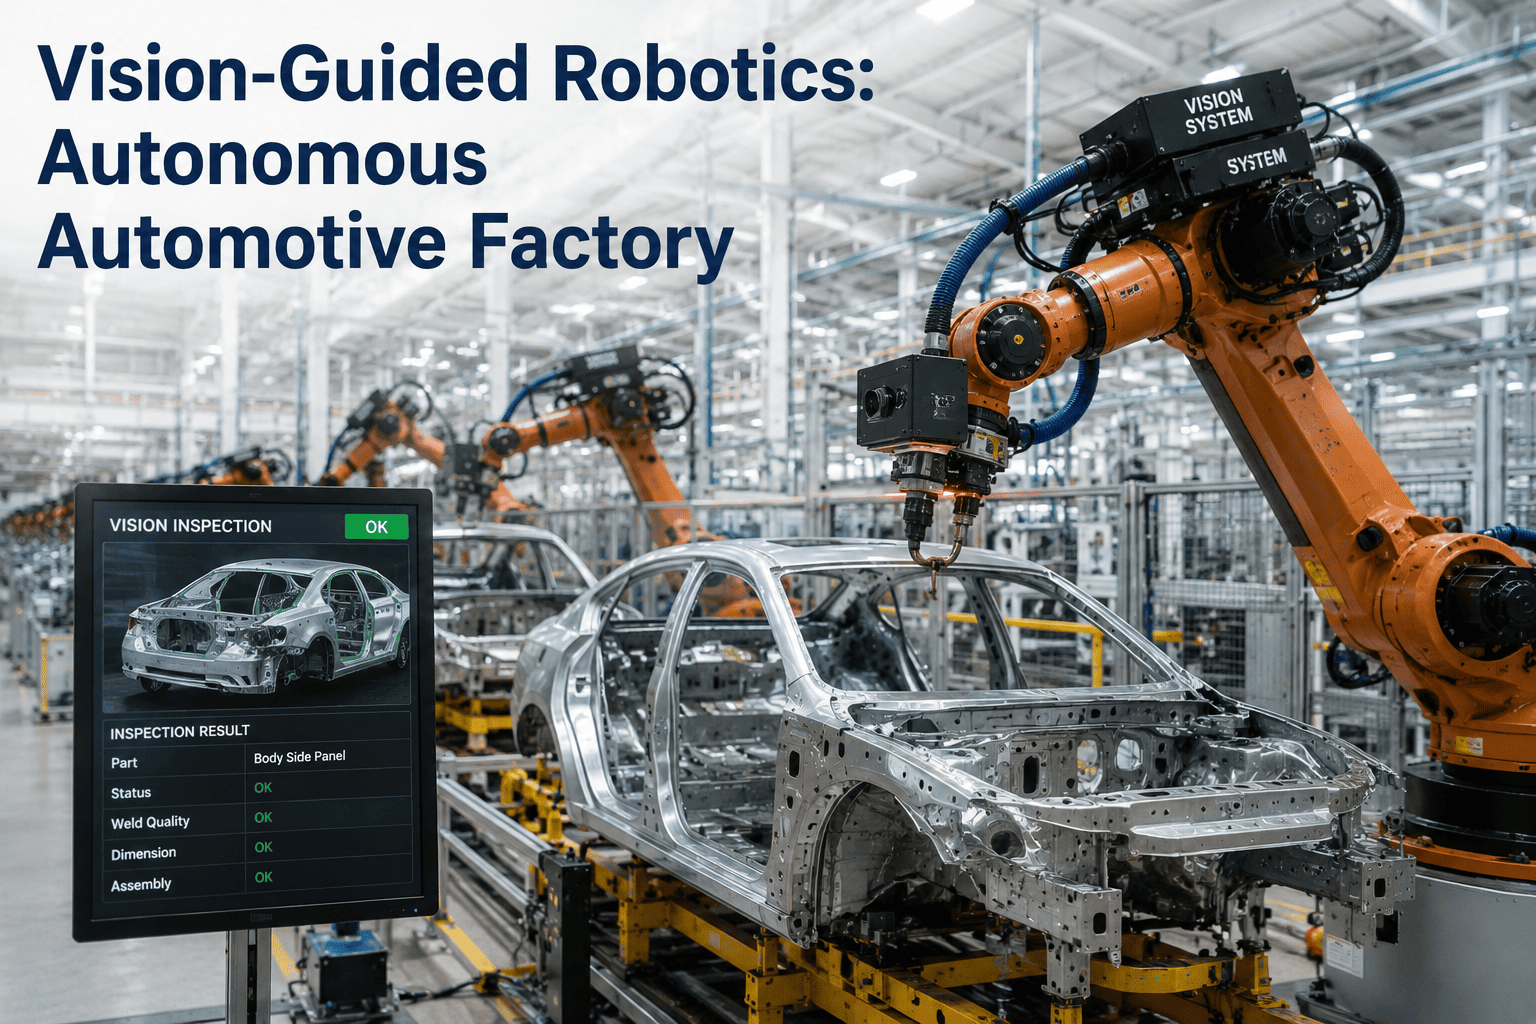
The line item most finance reviewers miss is the avoided capital cost of parallel hard-tooled stations. A plant running four body variants through a fixed-path welding cell often needs four separate fixture sets and, in some layouts, four separate stations to hit volume — vision-guided robotics collapses that into one flexible cell that adapts to whichever variant arrives next, and the avoided tooling and floor space cost belongs in the ROI calculation as concretely as any labor line does.
Turning Missed Defects Into an Avoided Cost Line
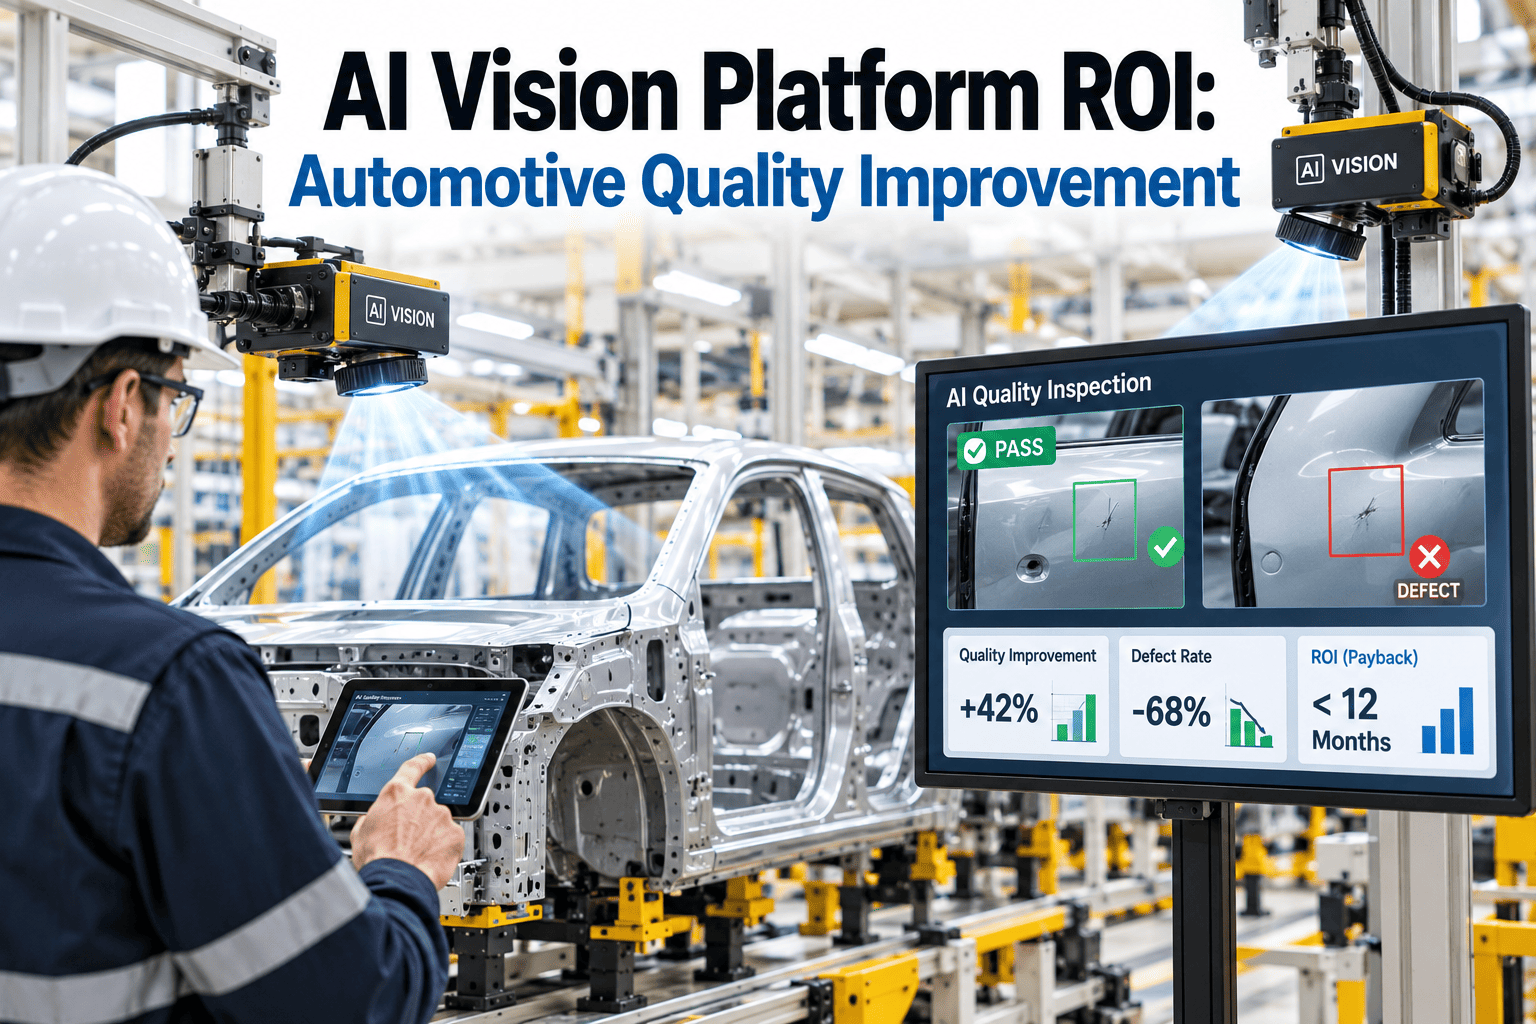
Quality value is the harder of the two categories to estimate before deployment, because it requires an honest accounting of what fixed automation or manual inspection was actually missing — a number most plants don't have precisely until they compare it against what vision-guided inspection catches during a pilot run. The bar comparison below reflects the general pattern iFactory sees across automotive pilot deployments, using relative scale rather than a single universal figure since actual defect rates vary significantly by process and part.
The mechanism behind that gap matters more than the specific percentages: fixed-path automation applies the same inspection or process action regardless of where the part actually sits within tolerance, so a part at the edge of its position tolerance band gets the same treatment as one dead center — and if the fixed path was tuned for the centered case, the edge case is where defects slip through. Vision guidance adjusts its action to the part's actual measured position on every single cycle, which is precisely why it closes gaps that neither manual inspection consistency nor fixed automation precision can close on their own.
Walk Through a Flexibility and Quality ROI Calculation for Your Line
iFactory's applications engineers can build a plant-specific ROI model using your actual part variant count, current defect escape rate, and labor structure — bring your production data and we'll work the numbers together.
Combining Labor, Flexibility, and Quality Into One Payback Calculation
A complete ROI model for vision-guided robotics stacks three distinct value categories rather than relying on any single one to carry the entire justification. Each category has a different confidence level and time horizon, which is worth stating explicitly to a finance reviewer rather than blending everything into one number that looks more certain than it actually is.
Vision-Guided vs. Fixed-Path Automation on the Metrics That Drive ROI
| Factor | Fixed-Path Automation | Vision-Guided Robotics |
|---|---|---|
| Upfront cost | Lower per station | Higher per station |
| Part variant support | One station per variant | One cell across variants |
| Position tolerance | Requires tight fixturing | Absorbs wider variation |
| Changeover time | Days to weeks per variant | Minutes to hours per variant |
| Defect detection | Fixed regardless of part position | Adapts to measured position |
The comparison makes clear why the ROI conversation shifts depending on production context: a single-model line with tight part control and no planned variant changes may genuinely find fixed-path automation the more economical choice, while a mixed-model or frequently-changing line captures value from vision guidance across every row in that table simultaneously, which is exactly why the strongest vision-guided robotics business cases tend to come from plants running multiple body styles or trim levels through a shared line.
It's also worth noting that this comparison isn't static over a program's life. A line that launches with a single model and looks like a clean fixed-path candidate at program start often ends up adding a variant, a facelift, or an export-market difference partway through its production run, at which point the fixed-path decision either holds up because the change was genuinely minor, or it triggers an unplanned re-tooling project that the original business case never accounted for. Building the variant-flexibility question into the initial equipment decision, even for a program that looks single-model today, is a more defensible planning approach than assuming the current part mix will stay fixed for the equipment's full service life.
Common Mistakes That Skew a Vision-Guided Robotics ROI Case
The teams that end up disappointed with a vision-guided robotics investment usually aren't disappointed with the technology itself — they're disappointed because the business case that justified the purchase was built on assumptions that didn't hold once the cell was running production. The patterns below show up repeatedly across automotive ROI reviews and are worth checking against before a model goes in front of a capital committee.
Running the model with a conservative case and an expected case side by side, rather than presenting a single optimistic number, tends to hold up much better under finance committee scrutiny — and it also sets more realistic internal expectations for what the plant floor should actually see in the first two quarters after go-live, which matters for how the project gets judged internally regardless of what the spreadsheet said beforehand. Teams that skip this step tend to face a harder internal conversation the second time they ask for capital, since a single overstated project makes every subsequent business case from the same team face more scrutiny than it otherwise would have.
Which Assumptions Actually Move the Payback Number
Not every input in a vision-guided robotics ROI model carries equal weight, and understanding which assumptions the payback calculation is most sensitive to helps focus the limited time available for data gathering before a capital request goes forward. In most automotive applications, the calculation is far more sensitive to the defect escape cost assumption and the part variant count than it is to small variations in the robot's own installed cost, because the escape cost and variant multiplier compound across every unit produced over the equipment's life, while the installed cost is a single fixed number known with reasonable precision from the vendor quote.
A practical approach is to run the model three times — once with the current best-estimate inputs, once with the defect escape cost and variant count each reduced by a conservative margin, and once with them increased to reflect an optimistic scenario — and present the resulting payback range rather than a single point estimate. This range-based presentation does more to build finance committee confidence than a single precise-looking number, precisely because it demonstrates the team has already stress-tested the assumptions that matter most rather than presenting a number that looks more certain than the underlying data actually supports.
One additional variable worth flagging separately in the sensitivity analysis is the discovery stage of quality escapes. A defect caught at final inspection costs meaningfully less to remedy than the same defect discovered as a warranty claim months after the vehicle is in a customer's hands, and a defect that triggers a field recall costs an order of magnitude more again. Because vision-guided robotics tends to catch defects earlier in the process than either manual inspection or fixed automation would, part of its quality value comes not just from catching more defects overall but from shifting the discovery point earlier in the cost curve — a distinction worth making explicit in the model rather than folding into a single blended escape-cost figure.
Frequently Asked Questions
See What Flexibility and Quality Are Actually Worth on Your Line
iFactory's applications engineering team builds ROI models that separate labor, tooling, quality, and changeover value so your business case reflects what vision-guided robotics actually returns, not just what a fixed-path automation spreadsheet would capture. Book a demo to walk through the calculation with your own production data.