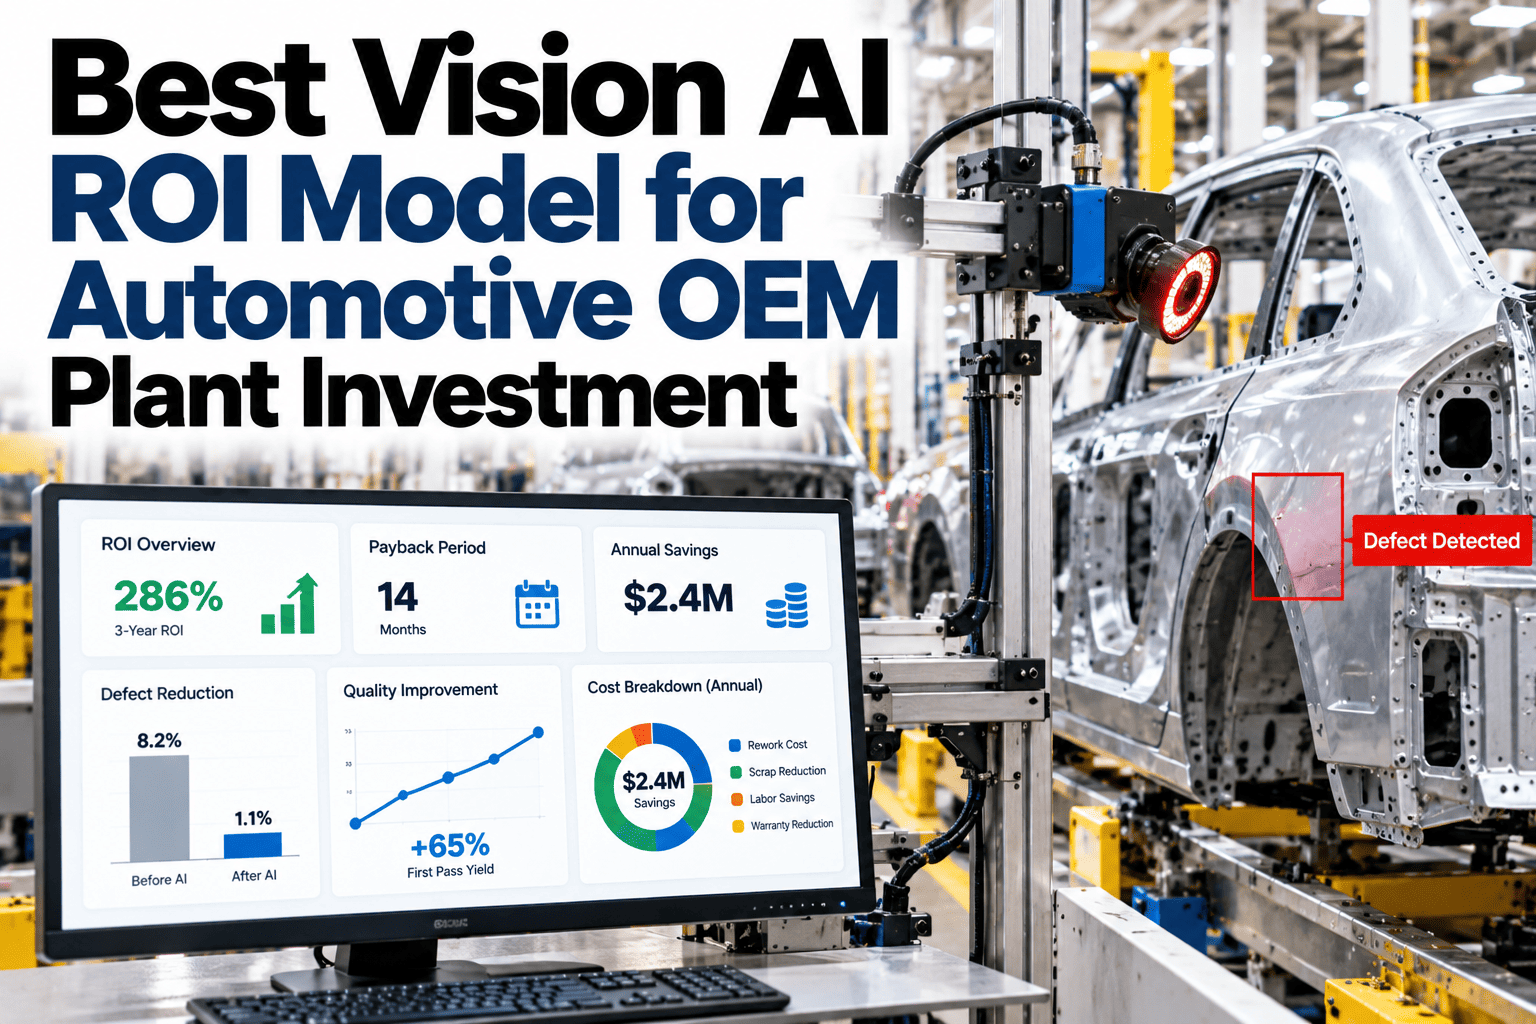
A vision AI pitch to an automotive OEM plant rarely fails on technology. It fails when the business case cannot survive a CFO asking where the numbers actually come from. Labor savings alone almost never justify the investment on their own, yet many proposals lean on headcount reduction as the entire story and leave quality-cost avoidance and downtime reduction as an afterthought. A defensible ROI model stacks all three together, with each number traceable back to a real cost the plant already tracks. Getting this right turns a vague efficiency pitch into a three-year number a finance team will actually sign off on. Plant leaders building a business case can walk through a sample three-year ROI model with iFactory AI's team before presenting to finance.
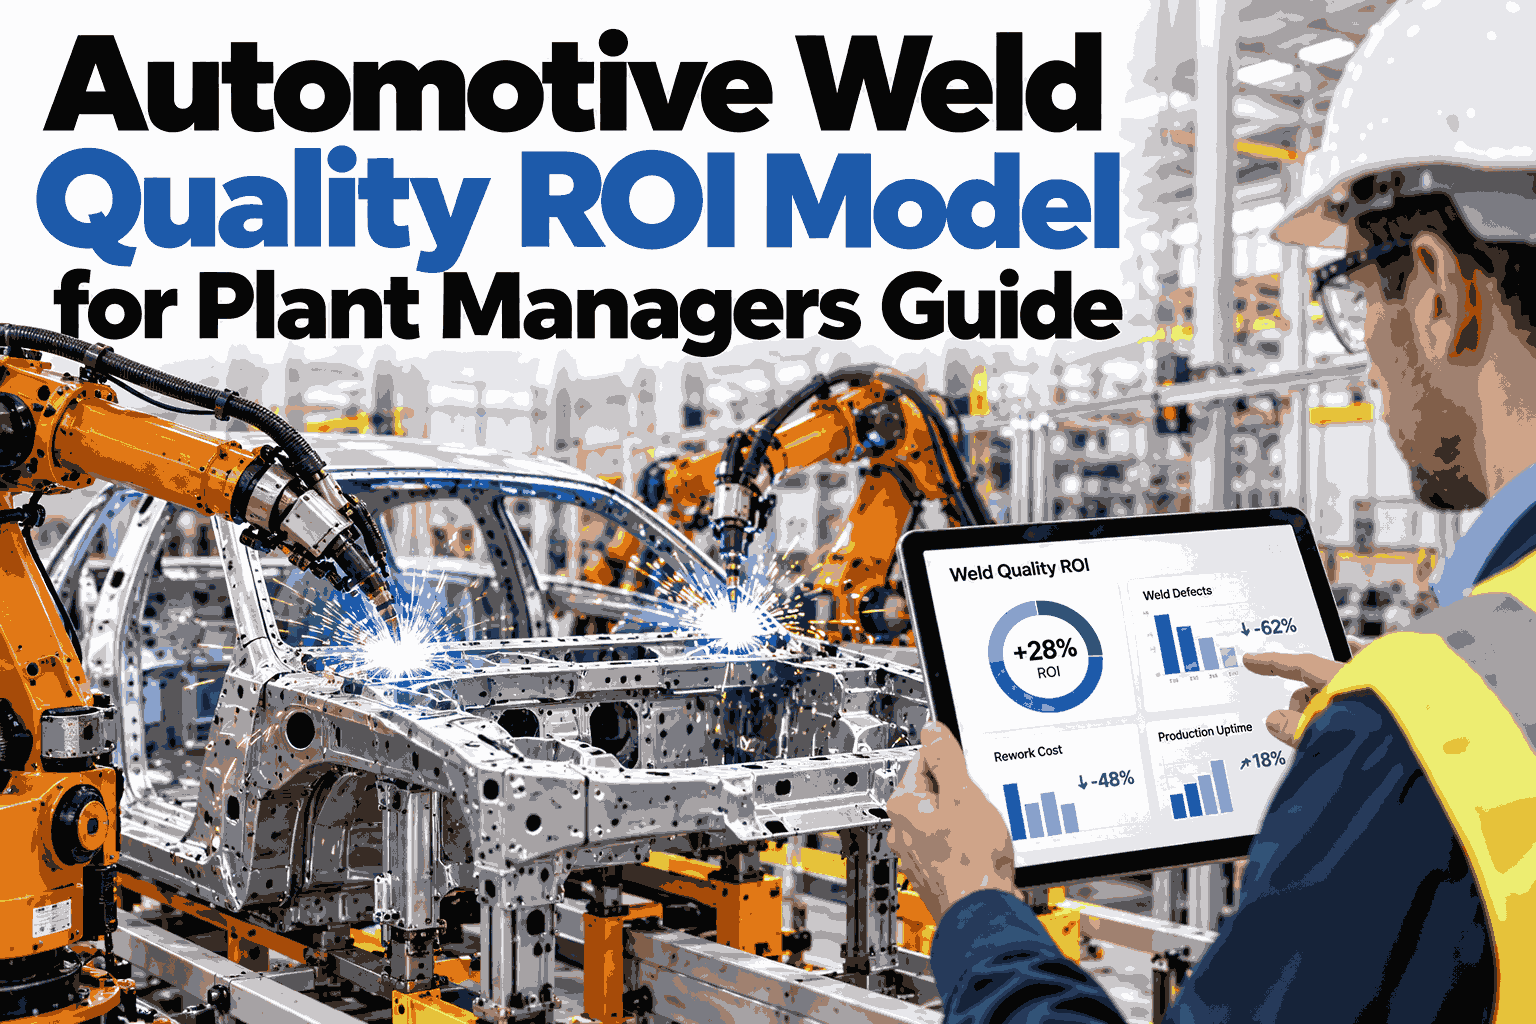
Best Vision AI ROI Model for Automotive OEM Plant Investment
Labor savings, quality-cost avoidance and downtime reduction stacked into a defensible three-year case.
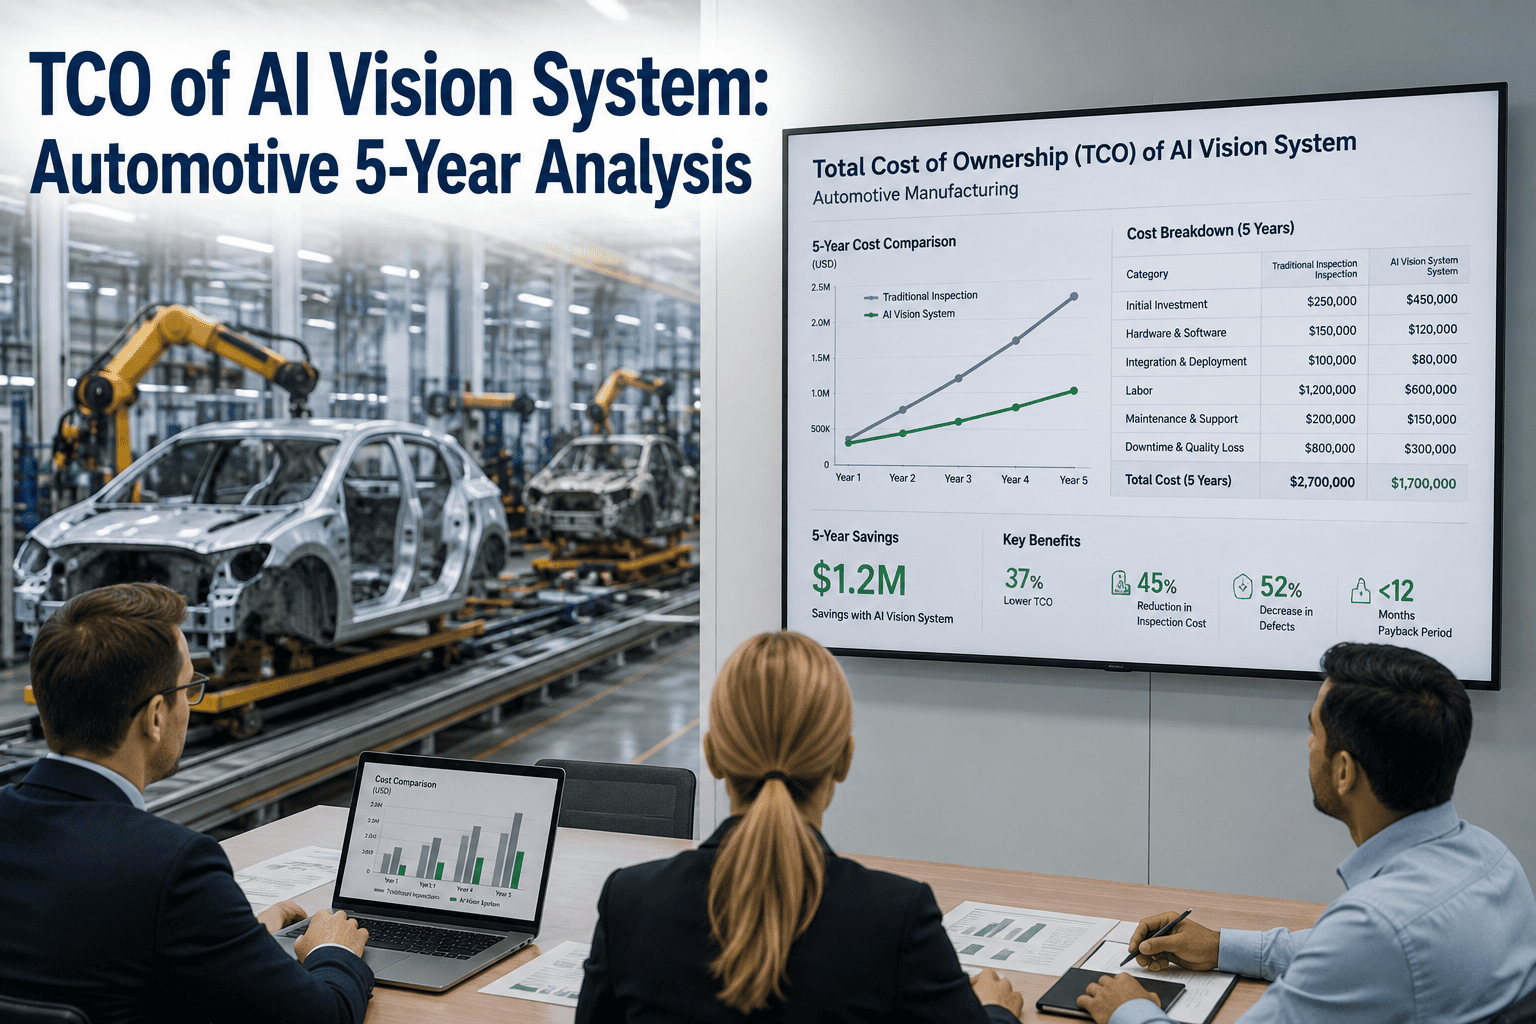
Illustrative savings mix: downtime reduction, quality-cost avoidance and labor savings, growing year over year
Why Labor Savings Alone Don't Hold Up
A business case built on one input is easy to challenge. Three gaps show up when labor is the only number in the pitch.
Headcount reduction alone understates the real value of catching defects before they ship.
A single-input case collapses if finance questions the headcount assumption even slightly.
Downtime avoided by catching line-stopping defects early is rarely counted at all.
A model built on three independent inputs survives scrutiny on any one of them far better than a model built on one.
The Three Inputs That Make a Case Defensible
Each input should trace back to a cost the plant already tracks, not an assumption invented for the pitch.
| Input | Source of the Number | Typical Share of ROI |
|---|---|---|
| Labor savings | Inspection hours reallocated or reduced | 25 to 35% |
| Quality-cost avoidance | Scrap, rework and warranty cost history | 35 to 45% |
| Downtime reduction | Cost per minute of line stoppage history | 25 to 35% |
Build Your Own Case With Your Plant's Numbers
Book a 30-minute session and bring your scrap, downtime and labor cost history. iFactory AI will help build a three-year model you can take to finance.
How the Three-Year Curve Typically Shapes Up
ROI rarely peaks in year one. Deployment and calibration costs are front-loaded while savings build as the model matures.
What iFactory AI Supports
The ROI model is built using the plant's own historical data, not generic industry averages.
Historical Cost Mapping
Scrap, rework and downtime cost history are pulled in to anchor every input to a real number.
Phased Savings Projection
A year-by-year curve shows how savings build as deployment expands and accuracy improves.
Finance-Ready Export
The model exports in a format built for presenting directly to a finance review.
Post-Deployment Tracking
Actual savings are tracked against the original model once the system goes live.
iFactory AI ships on a pre-configured NVIDIA server, racked and ready with software pre-loaded. Scope covers cost-history mapping, ROI model build, deployment and 24x7 remote monitoring.
Expert Review
The business cases that survive a finance review are almost always the ones built on the plant's own scrap and downtime history rather than industry benchmarks. A number finance can trace back to their own ledger is far harder to argue with than a vendor-supplied average.
Front-loading deployment cost into year one and letting savings ramp through year two and three is not a weakness in the model, it is how the technology actually performs. Presenting it that way tends to build more trust than promising an unrealistic first-year payback.
Frequently Asked Questions
What if we don't have clean downtime cost data?
Most plants have enough downtime history in their MES or maintenance logs to build a reasonable estimate, even if it is not perfectly clean. The model can start with a conservative estimate and be refined once better data is available. Waiting for perfect data before building a case usually delays the project unnecessarily. Bring what data you have to a working session.
How is quality-cost avoidance actually calculated?
It starts from historical scrap, rework and warranty cost tied to the defect types the vision AI system is expected to catch, then applies an expected catch rate based on similar deployments. This keeps the number grounded in costs the plant already tracks rather than an invented efficiency percentage. Ask support for a sample calculation walkthrough.
Should the model include software licensing and maintenance cost?
Yes, a defensible ROI model nets savings against the full cost of ownership, including hardware, software licensing, maintenance and any internal staff time required. Leaving these out makes the case look stronger than it actually is and tends to get caught in a finance review. Request a full cost-of-ownership template.
How often should actual savings be checked against the model?
A quarterly review against the original projection is usually enough to catch whether the deployment is tracking ahead or behind plan, without creating excessive reporting overhead. This also gives early warning if accuracy or adoption issues are holding back expected savings. Contact support to set up a tracking cadence.
Can this model be adapted for a multi-plant rollout?
Yes, the same three-input structure applies per plant, with each plant's own cost history feeding its own model. A multi-plant group typically builds the first plant's model as a template, then adapts it for each additional site. Book a session on scaling the model across multiple plants.
Take a Three-Year Number Finance Will Actually Sign Off On
iFactory AI builds the ROI model from your own scrap, downtime and labor cost history. Book a working session to build yours.