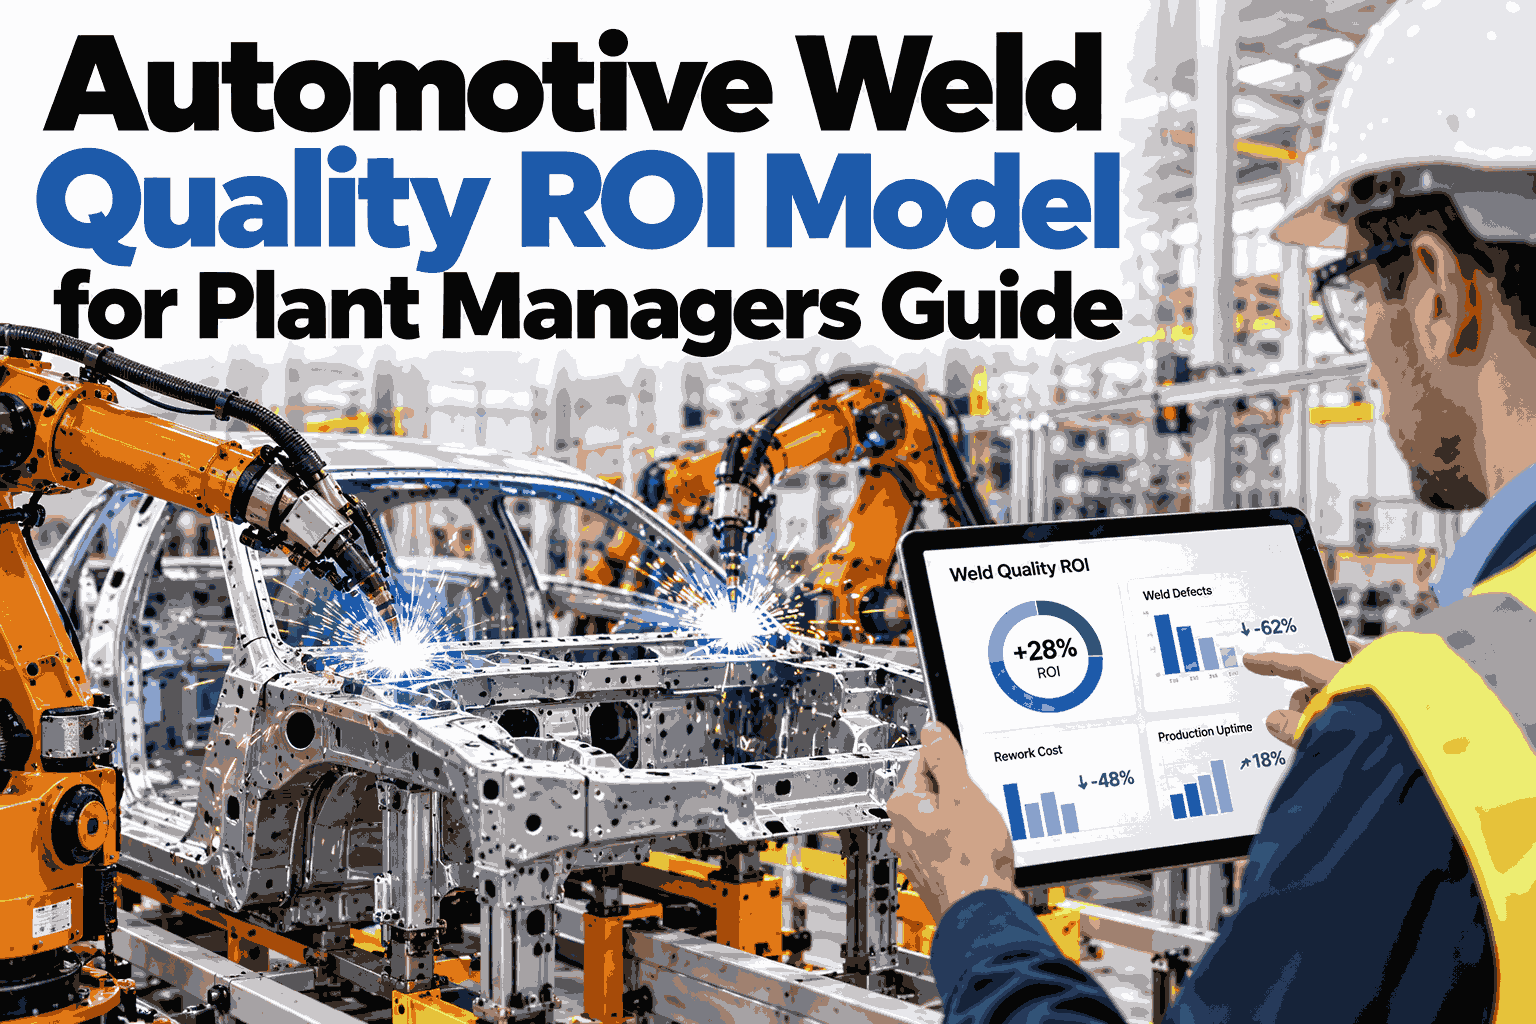
Automotive Weld Quality ROI Model for Plant Managers Guide

By James Smith on October 8, 2026

automotive-weld-quality-roi-model-for-plant-managers-guide

Plant managers rarely get budget for better inspection, they get budget for lower cost, and weld quality hides some of the biggest cost lines in the building. Rework loops, containment, warranty exposure and slow PPAP cycles each look like a separate problem, which is why no single line item seems large enough to justify new technology. Stacked together, though, they form a business case that finance can test with the plant's own numbers instead of vendor claims. To build that case with your own scrap, rework and approval data, work through the model line by line with an iFactory specialist.

P1 · AUTOMOTIVE WELD QUALITY PREDICTION AND INSPECTION

Automotive Weld Quality ROI Model for Plant Managers

Stack avoided rework, lower warranty exposure and faster PPAP cycles into one defensible number your finance team can challenge and approve.

Avoided Rework
+
Warranty Savings
+
Faster PPAP
−
Program Cost
=
Net Value
THE VALUE STACK

Three Value Streams That Build Into One Net Number

Each stream is modest alone, but together they climb past the program cost faster than most teams expect.


Rework

Warranty

PPAP

Gross Value

Program Cost

Net Value

Bar heights are illustrative only, because every plant's figures differ.

STREAM ONE · AVOIDED REWORK

Pricing the Welds You Fix Twice

Rework Value Worksheet
A
Welds reworked per month
B
Average labor, consumable and line-time cost per rework
C
Share of rework that earlier prediction could prevent
Monthly value = A × B × C

Use your own repair-station counts for A and B, and keep C conservative until a shadow-mode trial shows the real number.

Fill in the worksheet with your plant's numbers

iFactory can pre-load your rework and scrap history so the first value estimate comes from your data, not an average.

STREAM TWO · WARRANTY EXPOSURE

Why a Weld Escape Gets More Expensive at Every Step

At the Station
Fix in seconds
At Audit
Sort and contain a batch
At the Customer Plant
Line disruption and charge-backs
In the Field
Warranty claims and possible recall scope

Warranty value is hard to promise and easy to overlook, so treat it as upside until your claims history supports a figure.

STREAM THREE · PPAP ACCELERATION

Shortening the Approval Cycle With Evidence Built In

Manual evidence
Collect
Compile
Resubmit
Automatic records
Collected as you run
Export

Segment lengths are illustrative of relative effort, not guaranteed durations.

MODEL INPUTS

What Your Finance Team Will Ask You to Source

InputWhere to Find ItUsual OwnerConfidence Needed
Rework volumeRepair station logs, MES defect codesQuality leadHigh
Cost per reworkLabor rates, consumables, line downtimePlant financeHigh
Escape historyCustomer returns, containment recordsQuality managerMedium
PPAP effortPast launch timelines and engineering hoursLaunch managerMedium
Program costSoftware, integration, trainingPlant managerHigh
SENSITIVITY

Three Scenarios Every Board Presentation Should Show

Cautious
Counts rework savings only
Warranty and PPAP held at zero
Longest ramp assumed
Expected
Rework plus partial PPAP savings
Warranty counted at a low share
Ramp based on shadow-mode results
Stretch
All three streams counted
Faster launches on new programs
Rollout extended to more lines
ANTICIPATE THE PUSHBACK

Objections You Will Hear and How the Model Answers Them

Our scrap rate is already low.
Count hidden cost too: repair labor, re-inspection and containment.
Warranty savings are speculative.
Agreed, so the cautious scenario sets them to zero.
Integration will disrupt production.
Shadow mode runs beside current checks before anything changes.
PAYBACK PATH

When Value Starts Showing Up After Go-Live

1
Baseline
Costs measured, no savings claimed yet.
2
Shadow Mode
Predictions tested against real rework.
3
First Savings
Early catches reduce repair-station load.
4
Compounding
Records speed up PPAP on new launches.
FREQUENTLY ASKED QUESTIONS

What Plant Managers Ask Before Signing Off an ROI Case

How long until the investment pays back?
Payback depends on current rework volume, cost per repair and how many lines you start with, so any single number would be a guess. Shadow-mode results usually replace assumptions with plant data early. Estimate your own payback window with a specialist using your inputs.
Which value stream should we count first?
Start with avoided rework because it is the easiest to measure from existing logs. Add PPAP and warranty once you have evidence to support them. Sequence the three streams for your approval meeting with a guided session.
Do we need new sensors to build the case?
Not to build the case, since it uses data from your controllers and quality systems. Hardware is only considered later where it adds detection value. Check which of your current data sources already qualify before spending anything.
Can the model cover multiple plants?
Yes, each plant is modeled with its own inputs and then rolled into a group view. Differences in labor rates and defect history stay visible rather than averaged away. Plan a multi-plant business case with the iFactory team for leadership review.
What if the results come in below the estimate?
The cautious scenario is built for that, so the case still holds when only the most measurable savings appear. Ongoing tuning then closes gaps over the first months. Stress-test the downside case with our specialists before you commit.
A BUSINESS CASE BUILT ON YOUR OWN NUMBERS

Turn Weld Quality Into a Line Item Finance Will Approve

Bring your rework, warranty and PPAP data and leave with a model you can defend in the next capital review.

Share This Story, Choose Your Platform!