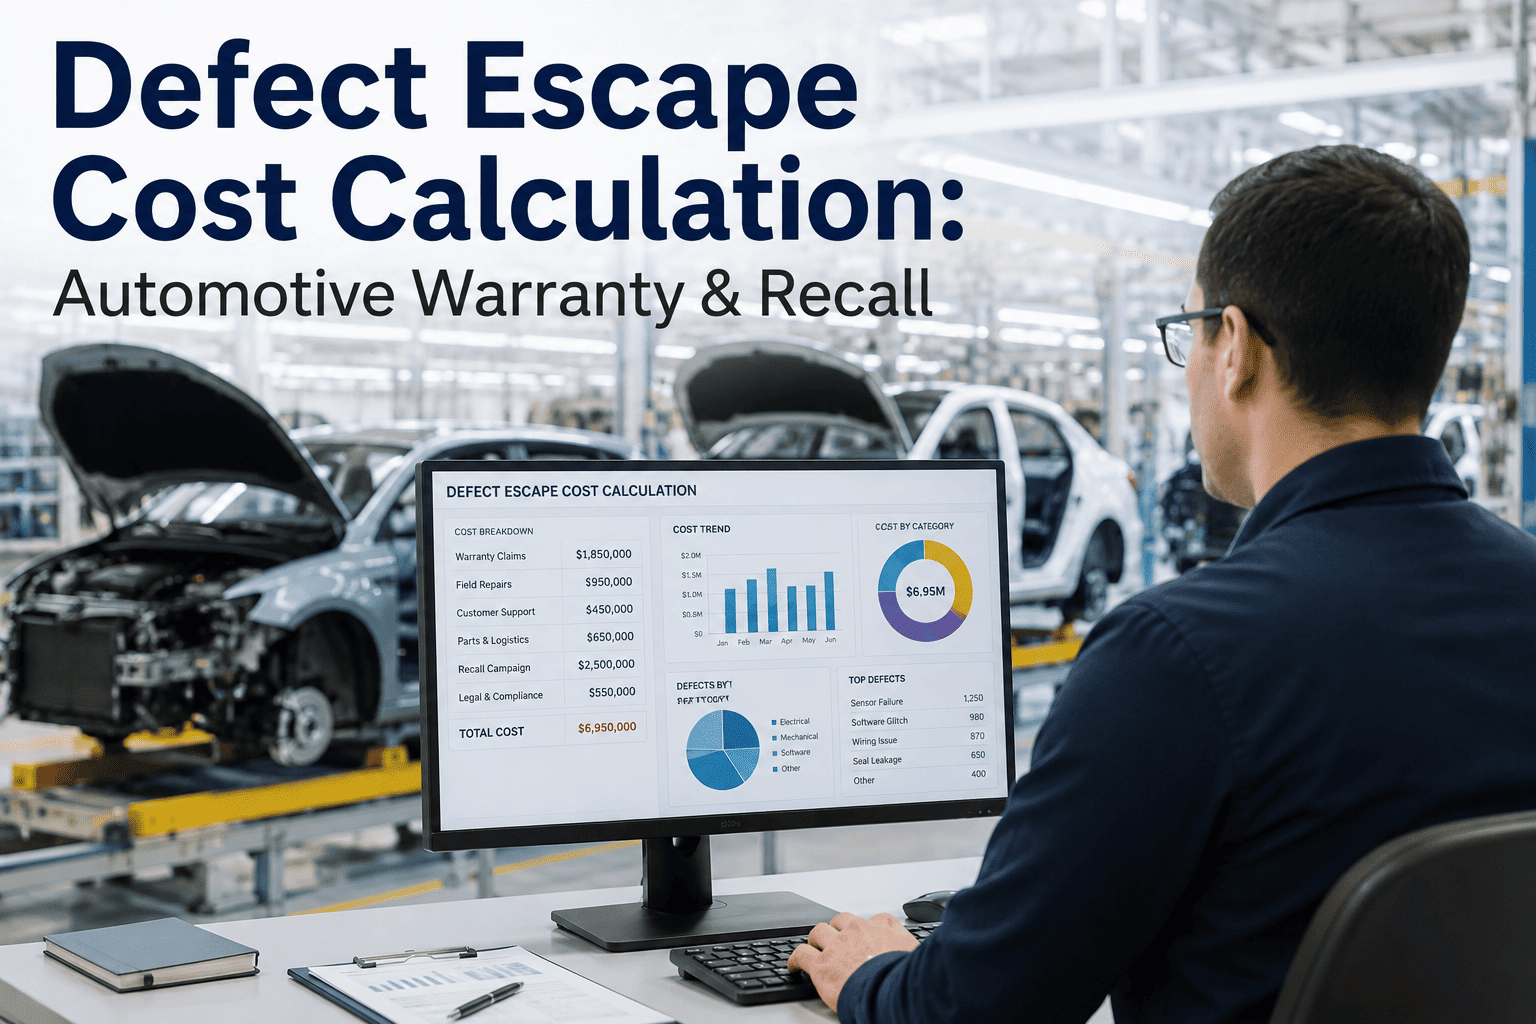
A stripped bolt thread on a bracket costs a few cents to catch at the workstation where it happens, the same defect costs measurably more if it makes it to end-of-line testing, jumps again if a customer discovers it during the warranty period, and becomes an entirely different order of cost if it triggers a recall. Most quality teams know this pattern intuitively but struggle to put a real number on it when they need to justify an inspection investment to finance. This article walks through how to actually calculate defect escape cost at each discovery stage, so an inspection business case is built on your own numbers rather than a rounded industry rule of thumb. You can book a demo to build this calculation against your own defect and warranty data.
AI INSPECTION ROI · AUTOMOTIVE
What a Defect Actually Costs Depends Entirely on Where It Is Caught
The same defect can cost cents or millions depending on whether it is caught at the workstation, at end-of-line, in a warranty claim, or in a recall. Here is how to calculate that cost at every stage.
WHY DISCOVERY POINT IS THE WHOLE STORY
The Defect Does Not Change, the Cost Around It Does
A defect escape cost calculation is not really measuring the defect itself, it is measuring everything that happens around a defect the further it travels through the supply chain before someone catches it: additional labor, logistics, customer goodwill, administrative overhead, and in the worst cases, legal and regulatory exposure. Building a credible number means pricing each of those layers separately rather than reaching for a single industry-average multiplier that may not reflect your actual part or program.
10x
A commonly cited order-of-magnitude cost increase moving from in-station catch to end-of-line catch
100x+
Typical escalation range once a defect reaches a customer as a warranty claim rather than a plant-caught issue
Program-Wide
Recall costs scale with the affected population, not the individual part, making them the least predictable stage
THE COST ESCALATION LADDER
Four Stages, Four Very Different Cost Structures
Mapping a defect's journey through these four discovery points is the starting point for any real calculation, since the cost components that need to be priced are different at each step.
In-Station Catch
Rework labor and part cost only
End-of-Line Catch
Adds disassembly, diagnosis, retest time
Warranty Claim
Adds dealer labor, part shipment, admin overhead
Recall
Adds notification, remedy, and regulatory cost across the population
Run This Calculation Against Your Own Defect History
Bring your recent warranty claim and rework data. We will walk through what your actual per-stage multiplier looks like.
BUILDING THE CALCULATION
What Goes Into Each Stage's Number
A defensible escape cost figure is built from specific, itemized components at each stage rather than a single lump estimate, which also makes the resulting number much easier to defend to finance.
WHAT CHANGES THE MULTIPLIER
Not Every Defect Escalates at the Same Rate
The ladder above describes a typical pattern, but several factors push the actual multiplier for a specific defect meaningfully higher or lower than the general case.
Safety-Critical Classification
Defects tied to safety-critical systems carry regulatory and liability exposure that dwarfs the direct repair cost alone.
Supplier Tier and Contract Terms
Chargeback and liability terms with Tier 1 or Tier 2 suppliers shift who actually absorbs each stage's cost.
Distribution Stage at Discovery
A defect caught in transit or at a dealer before sale avoids the customer-facing costs a post-sale discovery incurs.
Population Size Affected
A defect traced to a single shift versus an entire model year changes the recall cost by orders of magnitude.
FREQUENTLY ASKED QUESTIONS
Questions Finance and Quality Teams Ask Together
What is a reasonable starting multiplier if we do not have our own historical escape cost data yet?
In the absence of internal data, industry-cited ranges of roughly 10x moving from in-station to end-of-line, and considerably higher moving to warranty, are a reasonable starting point for a rough business case, though they should be replaced with your own figures as soon as possible since program-specific factors vary widely. Treat any industry-average number as a placeholder, not a final answer.
Book a demo to start building your own stage-specific figures.
How do we separate the cost of the defect itself from the cost of the customer relationship damage?
Direct costs like labor, parts, and administration can be itemized fairly precisely, while relationship and brand impact are harder to quantify directly and are often handled as a separate qualitative factor presented alongside the hard cost figure rather than folded into it. Combining both into one number tends to make the calculation less credible, not more persuasive.
Contact our support team to discuss how to present both cost types in one business case.
Should recall cost be averaged across all past recalls or calculated per specific defect type?
Per-defect-type calculation is considerably more useful for an inspection investment case, since averaging across a fleet-wide safety recall and a minor cosmetic recall together produces a number that does not represent either scenario accurately. Segmenting recall history by defect category and severity gives a much more defensible per-defect figure.
Book a demo to segment your own recall history by defect type.
How often should this escape cost calculation be updated?
An annual review is a reasonable minimum cadence, though the calculation should also be revisited any time warranty administration costs, supplier contract terms, or labor rates change meaningfully, since those inputs directly move the final number. A stale calculation built on outdated labor or claims costs can understate the case for inspection investment considerably.
Contact our support team to set up a recurring review cadence.
Does this calculation change if the defect is caught by AI inspection versus a manual inspector?
The discovery-stage cost ladder itself does not change based on who or what catches the defect, but AI inspection's value case comes from shifting more defects toward the cheaper, earlier discovery stages consistently, which is the actual mechanism behind most inspection investment paybacks. The calculation in this article is what makes that shift's value measurable in the first place.
Book a demo to see how earlier-stage catch rates translate into avoided cost.
Turn This Calculation Into an Approved Inspection Business Case
iFactory helps quantify avoided escape cost against your own warranty and recall history, giving finance a number they can actually approve. Book a demo to build it together.