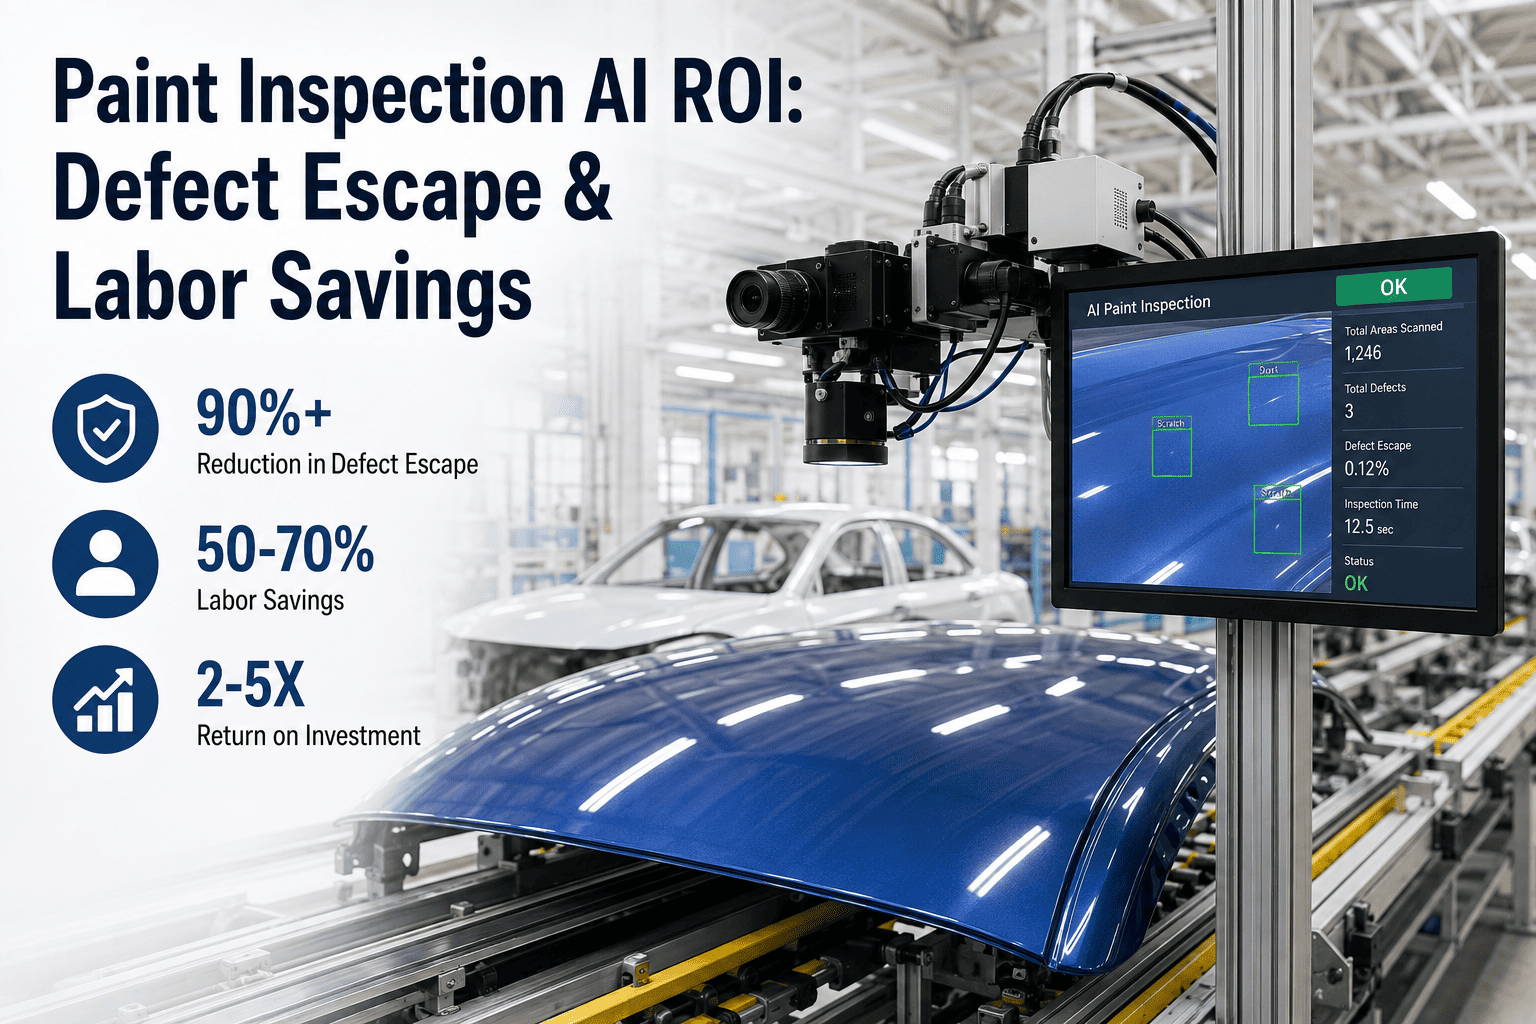
An AI inspection system that catches more defects is easy to demo and hard to price into a capital request, because the value it creates shows up scattered across several different budget lines — fewer defect escapes, fewer inspection labor hours, less rework, fewer warranty claims — and none of those lines belong to the same manager who has to sign off on the purchase. Automotive quality engineers who have tried to build this case know the problem isn't a lack of value, it's the absence of a single number that pulls the scattered value together into something a plant controller can actually approve. iFactory's applications team builds that number with plants regularly enough to have a repeatable structure for it, broken down below into the four cost categories that make up a complete AI inspection ROI calculation.
Building an AI Inspection ROI Calculator for Automotive Cost Savings
A defensible AI inspection ROI case pulls together four separate cost categories — defect escape, labor, rework, and warranty — into one calculation. This page walks through each input, how to estimate it from data most plants already have, and how the pieces combine into a payback figure.
Four Inputs That Combine Into a Complete ROI Figure
Rather than a single formula, a complete AI inspection ROI calculation is really four smaller calculations added together, each pulling from a different part of the plant's existing data. Treating them separately, rather than trying to estimate one blended savings number, makes each piece easier to defend individually and easier to update as better data becomes available.
Summed together, A through D against the AI inspection system's total installed and operating cost produces the payback period. The sections below cover how to source a defensible estimate for each of the four inputs, since the quality of the ROI case depends entirely on the quality of these underlying numbers rather than the arithmetic combining them.
Quantifying What a Missed Defect Actually Costs
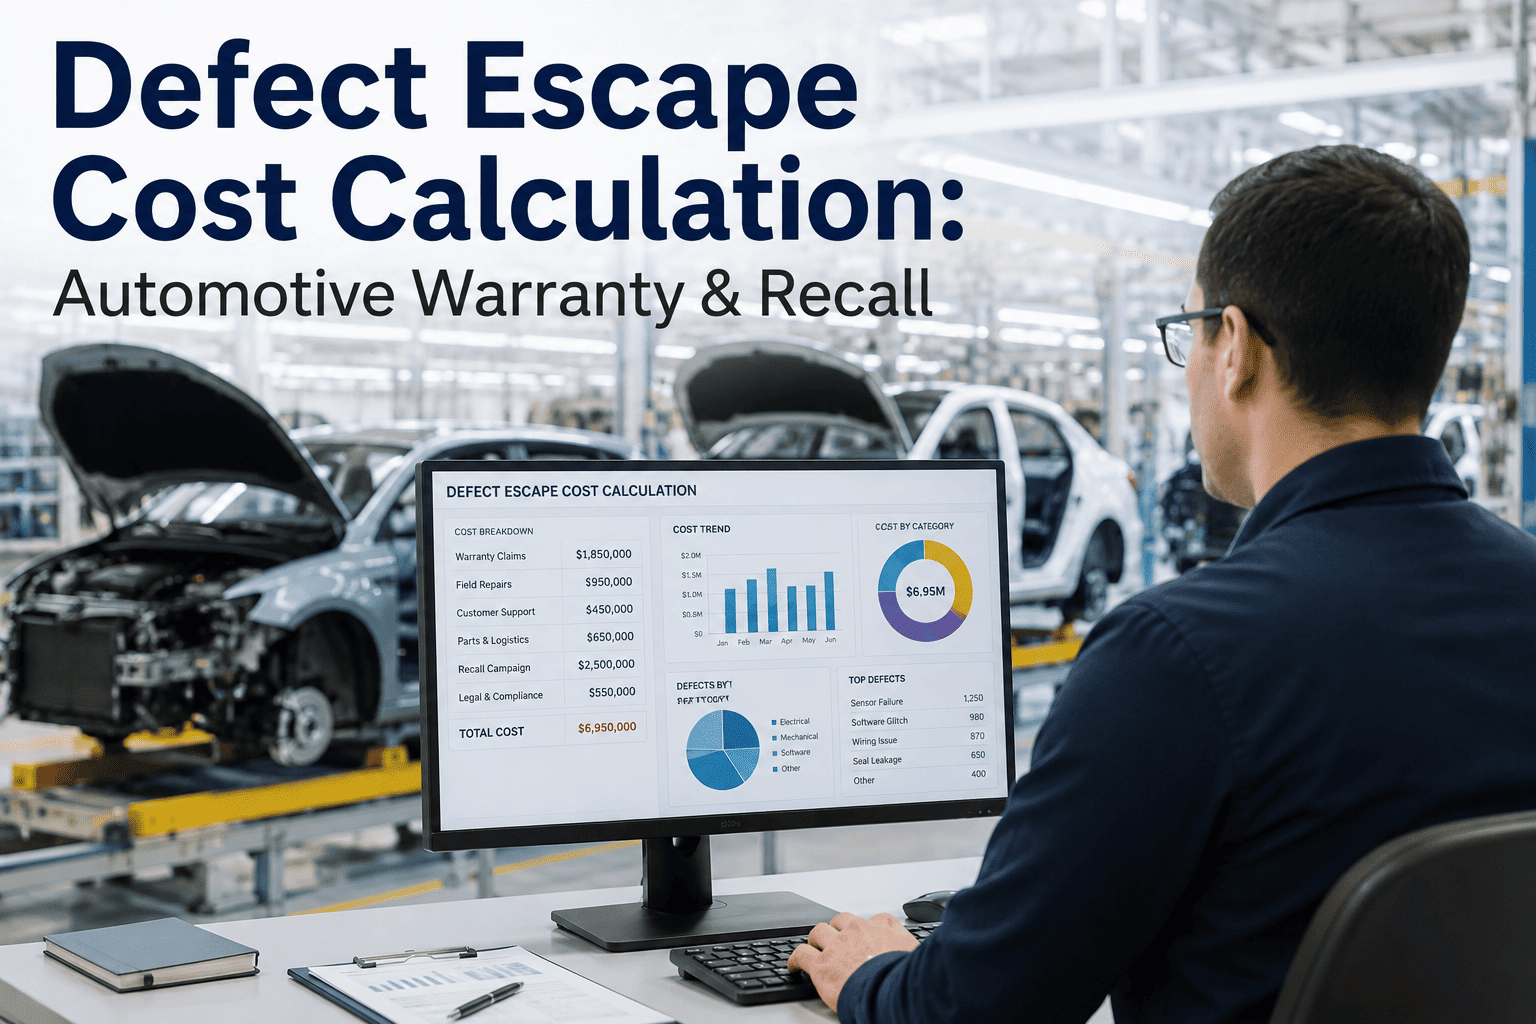
Defect escape cost is usually the largest single number in the calculation and the hardest to estimate precisely, because it depends on where in the production and distribution chain a defect is eventually caught, and most plants don't have that discovery-stage cost broken out cleanly in existing reporting. The escalating cost pattern below reflects the general relationship automotive quality teams see across discovery stages, though the specific multipliers vary by plant and defect type.
Building a realistic estimate starts with pulling the current split of defects across these discovery stages from existing quality records, then applying whatever internal cost figures the plant already tracks for rework labor, dealer prep credits, and warranty claim payouts. Where a specific number isn't available — recall cost is the hardest to estimate since most plants fortunately have limited recall history to draw from — a conservative placeholder based on published industry figures for comparable defect severity is a reasonable substitute, clearly flagged as an estimate rather than measured data, until better information becomes available.
Run This Calculation Against Your Actual Production Data
iFactory's applications engineers can work through all four inputs with your current defect, labor, and warranty data to produce a plant-specific ROI figure rather than an industry estimate.
Estimating Displaced and Redeployed Inspection Hours
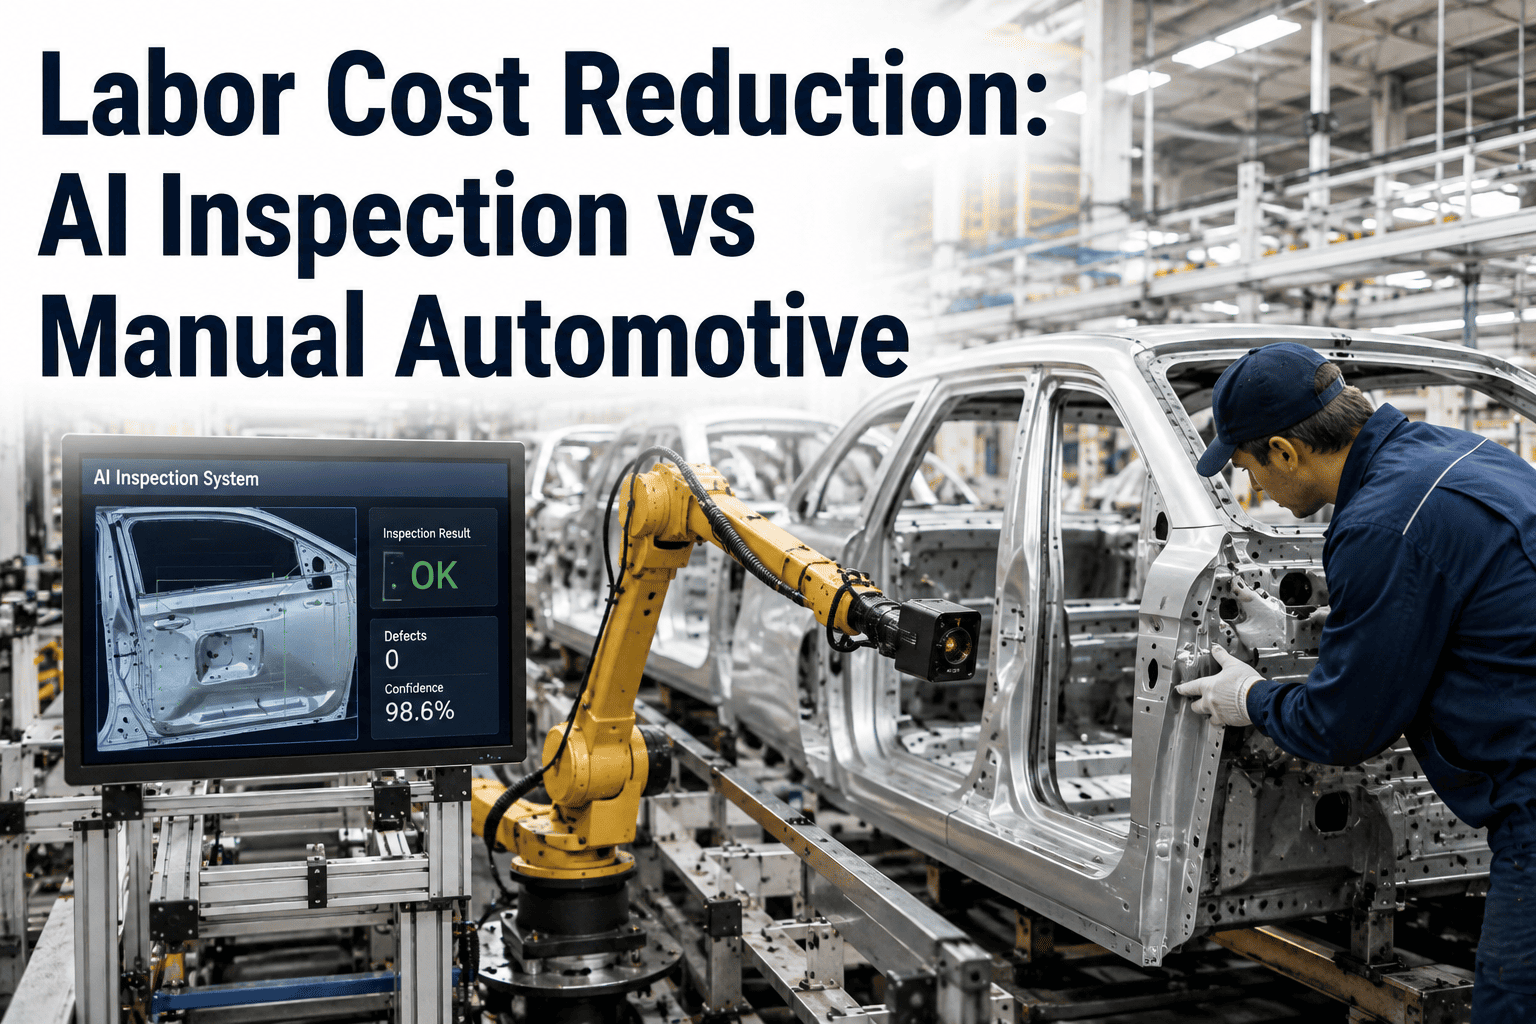
Labor savings is usually the most straightforward of the four inputs to estimate, because most plants already track inspector headcount and hours against specific stations, but it's also the input most prone to overstatement if the model assumes full displacement when the realistic outcome is partial redeployment. The distinction matters both for the accuracy of the ROI case and for how the project is communicated internally to the affected workforce.
The most defensible labor input identifies which of these three patterns actually applies to the specific station under evaluation, since a plant using a full-displacement figure to justify a project that will actually result in partial redeployment sets up an ROI case that won't match what finance sees in the labor budget line a year later.
Connecting Detection Improvement to Downstream Cost Categories
Rework and warranty savings are calculated similarly to defect escape avoidance but deserve separate treatment because they draw from different data sources and carry different confidence levels. Rework data usually exists in reasonably reliable form from station-level scrap and rework tracking, while warranty data requires connecting a current claim rate back to a specific defect type and process, which is a harder analytical link to make cleanly.
| Input | Typical Data Source | Confidence Level |
|---|---|---|
| Rework incidents avoided | Station scrap/rework logs | High — direct plant data |
| Cost per rework cycle | Labor and material cost accounting | High — direct plant data |
| Warranty claims avoided | Claims database by defect code | Moderate — requires defect linkage |
| Average claim cost | Warranty accounting | High — direct plant data |
Presenting the confidence level alongside each input, as reflected in the table, is worth doing explicitly in the final business case rather than blending everything into a single number that implies uniform certainty. A reviewer who sees that the labor and rework inputs are high-confidence direct data while the warranty input carries more estimation uncertainty can weigh the overall case appropriately, which builds more credibility than a single polished total that obscures which parts of it are solid and which are estimates.
A Worked Example Structure
The illustrative structure below shows how the four categories combine, using round, illustrative figures rather than any specific plant's actual data, to demonstrate the calculation pattern a plant would populate with its own numbers.
The payback period that results from dividing total installed cost by this annual value figure is the number most capital committees actually want to see, but the four-category breakdown behind it is what makes that final number defensible under scrutiny rather than a black-box estimate nobody can trace back to underlying data.
Frequently Asked Questions
Turn Scattered Savings Into One Defensible ROI Case
iFactory's applications engineering team builds the full four-category ROI model with your actual defect, labor, rework, and warranty data, so your business case reflects real plant performance rather than an industry average. Book a demo to walk through the calculation together.