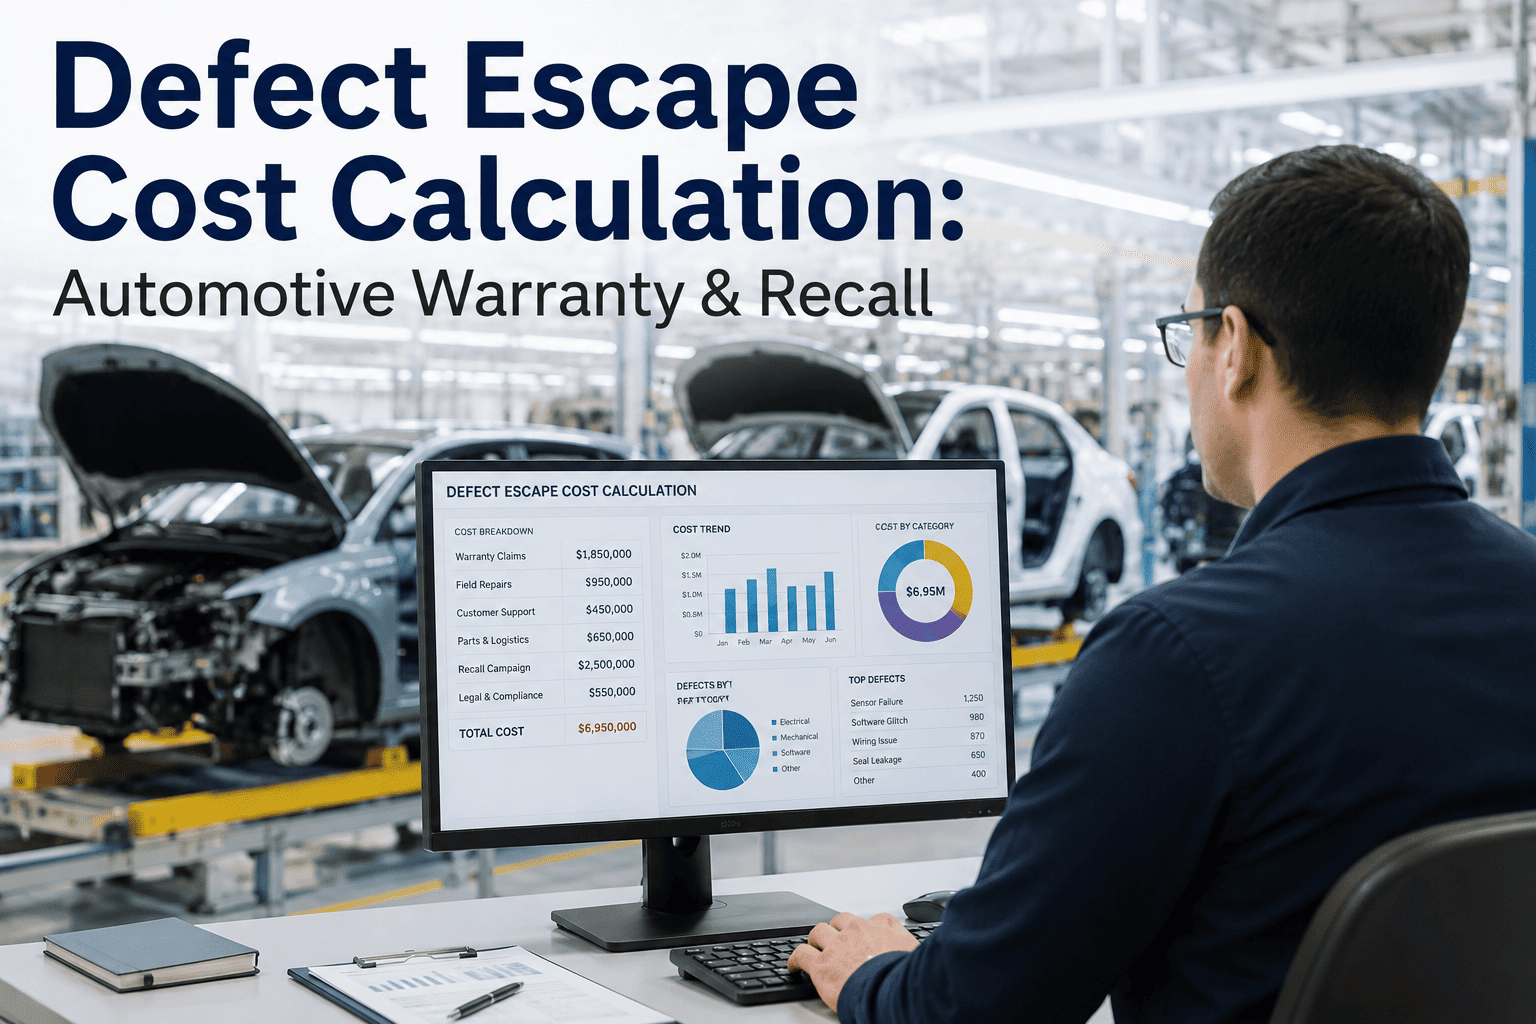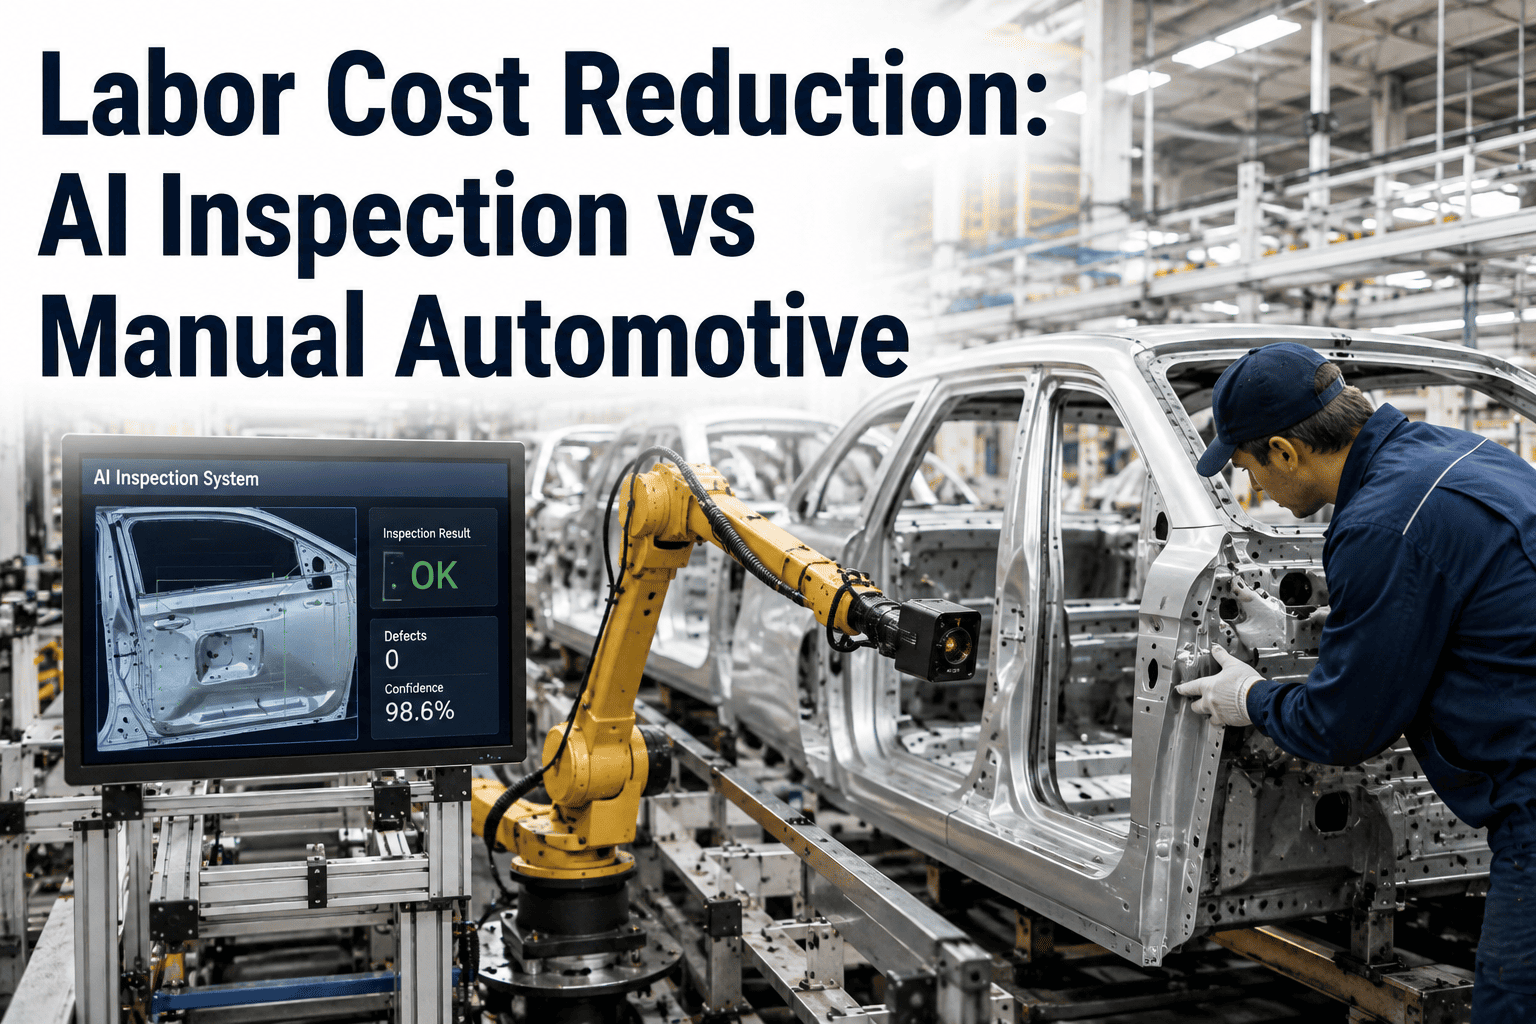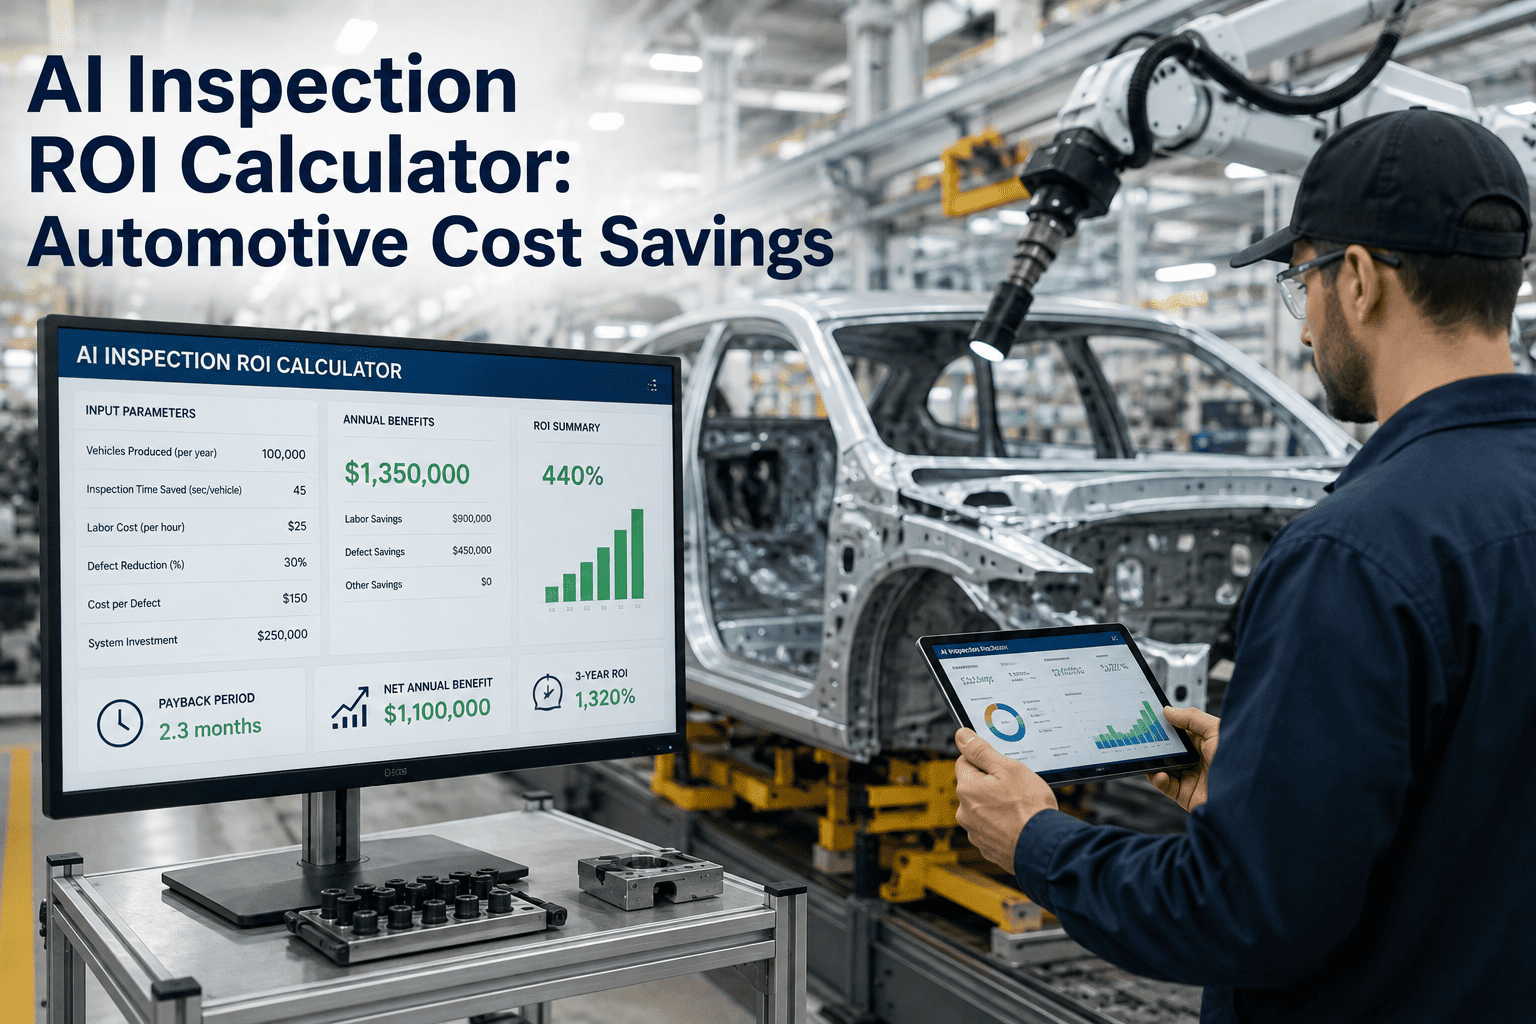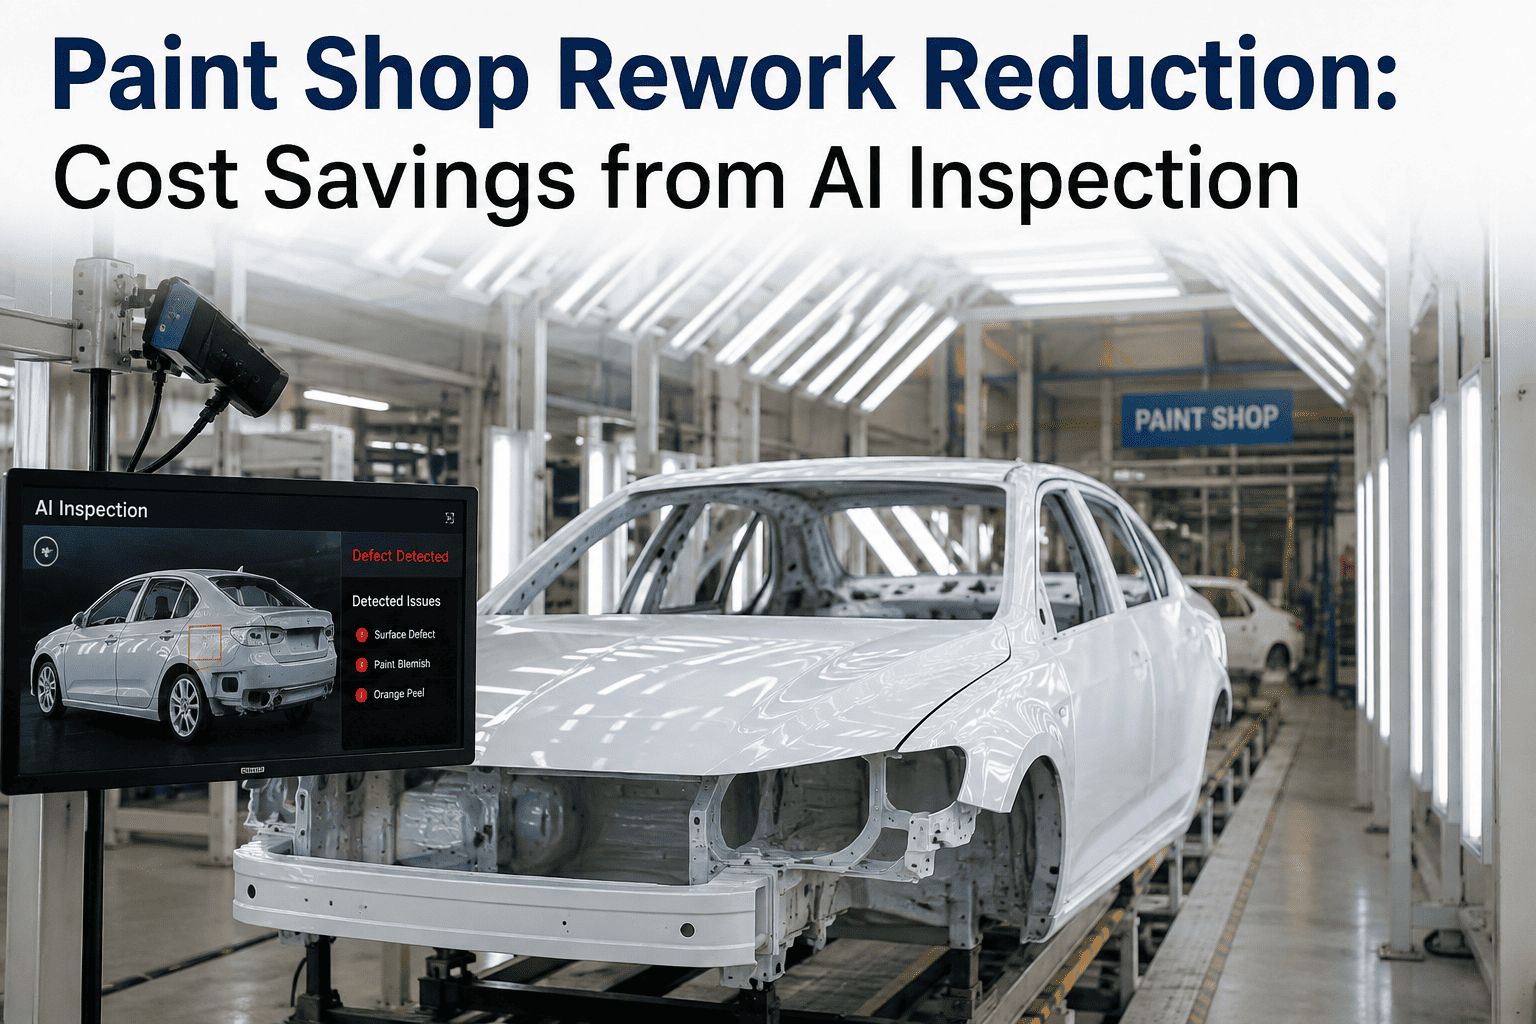
A single paint defect that escapes final inspection and reaches a dealer lot rarely costs what it would have cost to catch on the line, it costs many times more once you add the warranty claim, the rework labor, the shipping, and the dent it puts in a customer's first impression of a brand-new vehicle. Most paint quality teams already sense this intuitively, but when a plant controller asks for a number to justify a vision inspection investment, intuition does not clear a capital committee. What clears a capital committee is a defensible model that ties defect escape reduction, labor reallocation, rework avoidance, and warranty prevention to a single payback figure, and that is exactly the kind of model iFactory builds from your own plant's inspection and quality data, which you can see built out on a demo call using numbers close to your own line.
The Paint Inspection AI Business Case, Built From Your Own Line's Numbers
iFactory quantifies exactly where an AI paint inspection deployment pays for itself, breaking the return into defect escape reduction, labor optimization, rework savings, and warranty prevention so the number you bring to a capital request actually holds up.
Why One Escaped Paint Defect Costs So Much More Than It Looks Like
A defect caught at the paint booth costs a touch-up and a few minutes of line time. The same defect caught at final inspection costs a trip back through rework. The same defect missed entirely and shipped to a dealer costs a warranty claim, a transportation charge, a dealer relations issue, and in the worst cases a repeat repaint that never fully matches factory finish. The cost does not scale in a straight line, it compounds at every stage the defect survives undetected, which is the entire economic argument for catching more of them earlier and more consistently than a human inspector working a repetitive visual task for an eight-hour shift can manage.
Where Internally Built ROI Estimates Usually Fall Apart
Most plants have already tried to sketch a rough business case for paint inspection AI before bringing in outside help, and those first attempts usually run into the same handful of problems. Recognizing them early saves a round of rework once the model reaches finance review.
The first and most common mistake is treating defect escape reduction as the only source of return, which understates the case significantly, especially at plants where inspection labor and rework routing carry real cost of their own. The second is using an industry-average escape rate instead of the plant's actual figure, which either inflates or deflates the projected return depending on how the specific line compares to that average, and a controller will ask where the number came from the moment it looks unfamiliar. The third is failing to separate the conservative case from the expected case, presenting a single blended number that collapses the moment anyone questions one of the underlying assumptions. The fourth, and often the most damaging, is skipping the payback timeline entirely and presenting only an annualized figure, which leaves plant leadership with no way to judge when the investment actually starts paying for itself versus when the full-year number gets realized.
A model built with real data across all four streams, presented with both a conservative and expected case, and sequenced against a realistic payback timeline, tends to move through capital review markedly faster than one missing any of these pieces, simply because it answers the questions a reviewer would otherwise have to ask.
Where the ROI Actually Comes From, Broken Into Four Measurable Streams
A single "ROI number" hides more than it reveals, because it blends savings that behave very differently and show up on very different timelines. iFactory's ROI model separates the return into four streams that a controller can independently verify against your own cost data, rather than asking anyone to take a bundled figure on faith. Each stream is tied to a specific line item a plant already tracks in some form, warranty administration, labor scheduling, and rework routing, which means the model does not require building new data collection infrastructure before it can be trusted.
What Actually Changes When Detection Moves From Eyes to Cameras
A trained paint inspector is genuinely good at spotting defects, but the task itself works against consistency over a shift. Staring at moving, reflective surfaces under booth lighting for hours produces fatigue that no amount of training eliminates, and detection rates measurably drop in the final hours of a shift, on Friday afternoons, and on the units that roll through right after a break. An AI vision system does not experience that decay, it applies the same detection threshold to the first unit of the shift and the last one, which is the single biggest reason the escape rate gap between manual and AI-assisted inspection tends to widen as line speed increases rather than narrow.
This does not mean the inspector's judgment becomes worthless, it means the judgment gets applied differently. Instead of scanning every unit for every defect type, inspectors review what the system flags, confirm true positives, catch the rare edge case the model has not seen before, and feed that edge case back into retraining. That shift from primary detector to verification and improvement role is where the labor optimization stream in the ROI model actually comes from, and it is worth stating plainly to plant leadership so the investment is not misread internally as a headcount reduction plan when that is not how most deployments actually run.
See These Four Streams Modeled Against Your Own Plant Data
Bring your current escape rate, inspection labor cost, and rework volume to the call, and iFactory will build the payback model live using your own numbers instead of industry averages.
What a Capital Committee Actually Wants to See in the Model
Capital committees do not reject vision inspection proposals because the technology does not work, they reject them because the financial model behind the request does not survive questioning, and the gap between a technically sound proposal and an approved one is almost always a gap in the supporting financial data rather than the underlying case for the equipment itself. The table below outlines the inputs a defensible model needs and where each one typically comes from inside a plant that already tracks quality data. Gathering these four inputs is usually a matter of pulling existing reports rather than starting a new measurement program, which is part of why plants that come prepared with this data tend to move through the approval process noticeably faster than those building the case from scratch.
| Model Input | Typical Source | Why It Matters to the Case |
|---|---|---|
| Current Escape Rate | Warranty claims tagged to paint defects, dealer PDI reports | Sets the baseline the AI system's detection rate is measured against |
| Inspection Labor Cost | Current headcount and shift structure on final inspection | Defines the labor reallocation portion of the return, not a headcount elimination claim |
| Rework Volume and Cost | Rework routing data, paint shop MES | Shows how many units move from full rework to simple touch-up once detection happens earlier |
| Warranty Cost Per Claim | Warranty administration or finance reporting | Converts avoided escapes directly into dollars a controller already tracks |
Once these four inputs are in hand, the model becomes a straightforward calculation rather than a projection built on assumptions, which is exactly what makes it survive scrutiny in a capital review. The most common mistake plants make when building this case internally is estimating one or two of these inputs instead of pulling them from actual records, and a controller reviewing the proposal will usually find the soft spot immediately, which stalls the approval and forces a second pass with better data anyway. Starting with real numbers the first time, even imperfect ones pulled from warranty and rework systems that were not designed for this purpose, produces a stronger case than a cleaner-looking model built on assumptions.
It also helps to present the model with a conservative case and an expected case side by side rather than a single point estimate. The conservative case assumes only the defect escape reduction stream, which is the easiest to verify and the hardest to argue with, while the expected case layers in labor optimization, rework savings, and warranty prevention once those streams start showing up in the data. This structure lets a capital committee approve on the conservative number alone if they want to be cautious, while still seeing the full upside the deployment is likely to produce over its first year.
How the Return Typically Unfolds Across the First Year
The four savings streams do not arrive on the same schedule, and understanding the sequence helps set realistic expectations with plant leadership rather than promising an immediate step-change the day the system goes live.
Plants that expect an immediate, dramatic drop in warranty spend in month one are usually looking at the wrong stream first, since warranty claims lag the actual defect by the time it takes a vehicle to reach a customer and for an issue to surface. The escape rate improvement is real and immediate, but its effect on the warranty ledger takes longer to show up simply because of that natural reporting lag, and setting that expectation correctly up front avoids a false impression in month two that the deployment underperformed.
Plant Conditions That Shorten the Time to Positive Return
Not every plant sees the same payback speed, and knowing which conditions accelerate it helps prioritize where a first deployment should happen inside a multi-plant network. For organizations running several paint shops, this prioritization question often matters as much as the technology decision itself, since a first deployment chosen well builds the internal case study that makes every subsequent line easier to approve.
None of these conditions are prerequisites for a positive return, they simply describe where the payback tends to arrive fastest and where the model tends to carry the least uncertainty. A plant lacking clean historical data can still build a credible case, it just needs a longer parallel-run period before the numbers firm up, which is worth factoring into the timeline expectations set with plant leadership at the outset rather than discovering it mid-deployment.
What Automotive Paint Shops Report After Deployment
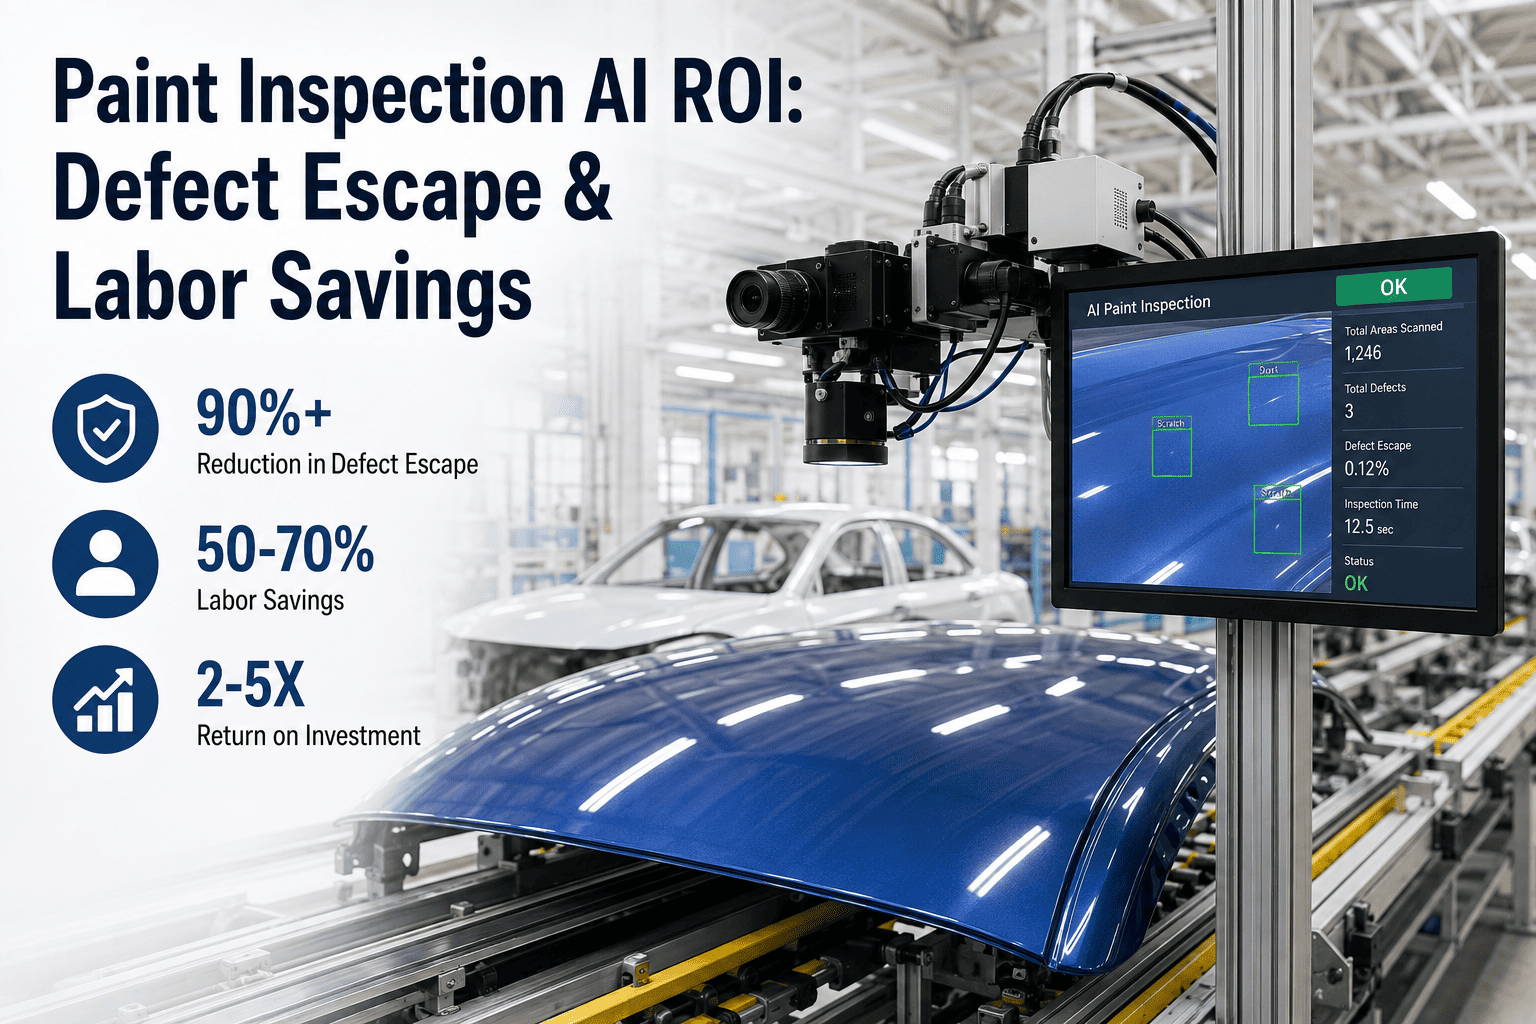
These figures reflect outcomes reported by automotive paint shops after moving from manual final inspection to AI-assisted paint defect detection, aggregated across a range of line speeds, shift structures, and vehicle programs rather than drawn from a single best-case deployment.
These are reported outcomes rather than guarantees, and the actual figures for any given plant depend heavily on the four model inputs covered earlier in this article. What is consistent across nearly every deployment is the direction of each of these metrics, escape rate down, rework mix shifted toward cheaper fixes, and a documented record on every unit that did not exist before, which is the combination that ultimately gets a capital request approved and then re-approved for the next line.
Questions Finance and Quality Teams Ask Before Approving the Investment
What the First Conversation With iFactory Actually Covers
A first call is not a sales pitch built around slides, it is a working session where the four ROI inputs get pulled together against your own plant's numbers, gaps in available data get identified, and a rough payback range gets sketched before the call ends. Most quality and finance teams walk away with enough of the model built that they can take it to their own capital review process within the same week rather than waiting on a lengthy proposal cycle.
Where data is incomplete, the conversation shifts toward what a short parallel-run period would need to look like to fill the gaps, so the model can be finished with real numbers from your own line rather than industry benchmarks standing in permanently for figures your plant could measure directly. Either path, complete data today or a brief measurement period first, ends at the same place, a business case built specifically for your paint shop rather than a generic template with your logo on it.
Bring Your Numbers, Leave With a Defensible Payback Model
iFactory builds the paint inspection ROI case from your plant's own escape rate, labor cost, and rework data, not industry averages. Book a demo and see the four-stream model built live.