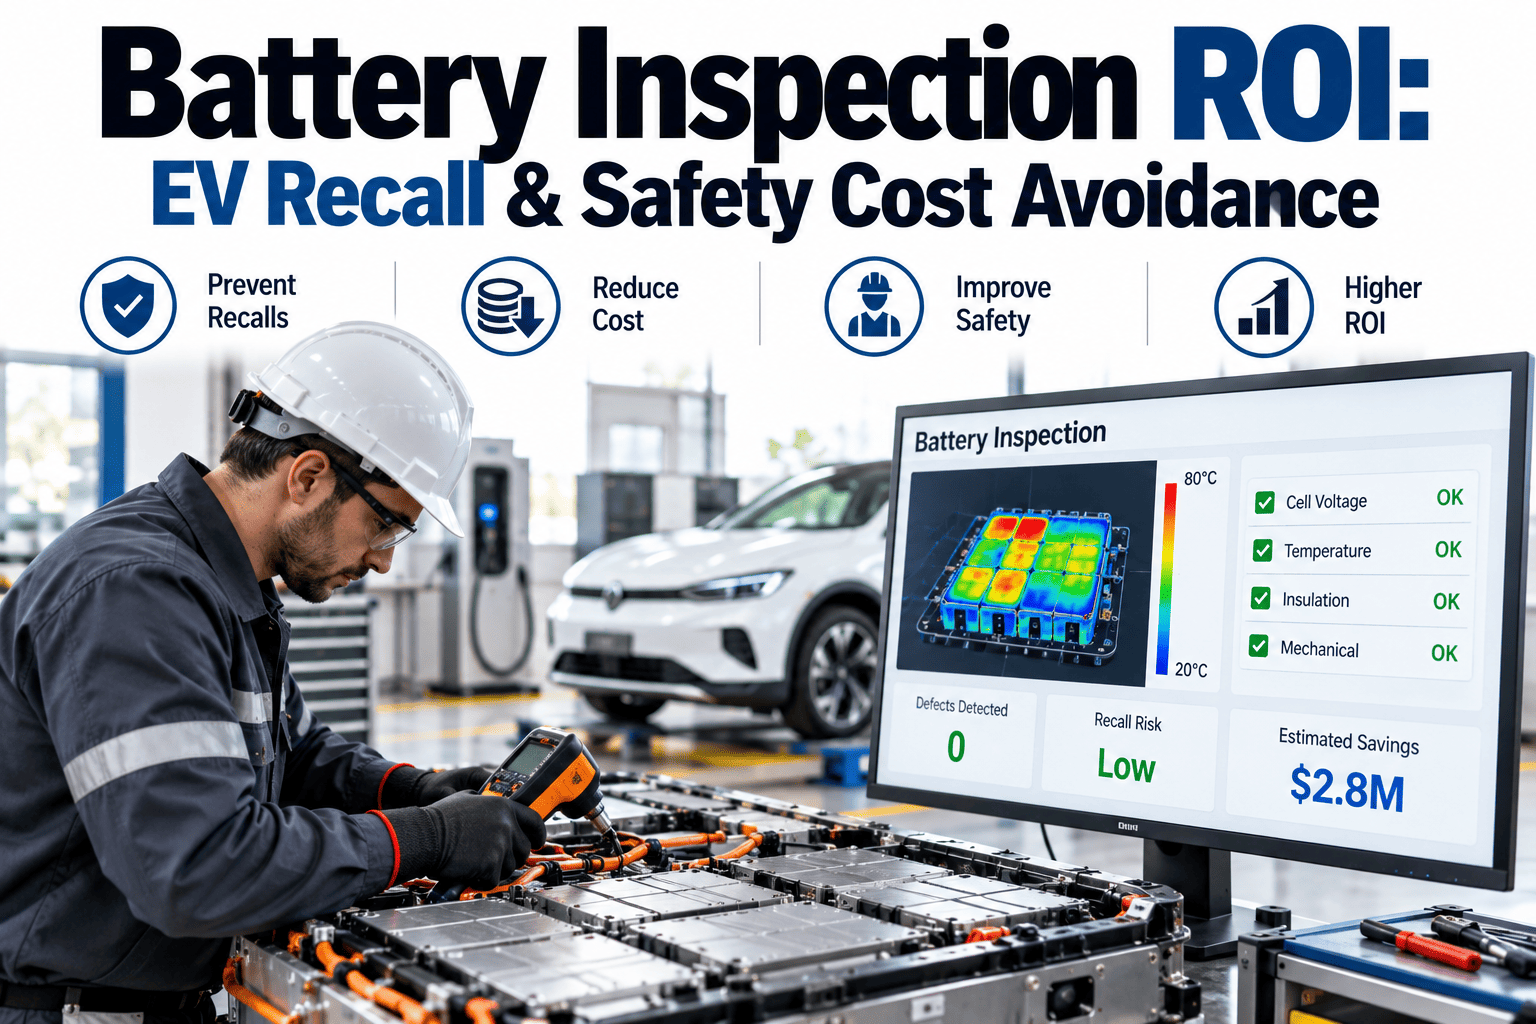
A battery pack recall on a mid-volume EV program can erase years of margin in a single announcement, and the safety incidents that trigger the worst recalls almost always trace back to a defect that inspection should have caught before the pack ever left the plant. Calculating the return on battery inspection investment is not the same exercise as justifying a typical quality system upgrade, because the downside being avoided is not scrap cost or rework labor — it is recall cost, safety liability, and warranty exposure that can run into tens of millions of dollars for a single defect class discovered after vehicles are already on the road. Manufacturers building this business case can start with a conversation with iFactory support about modeling it against their own program's numbers.
The Defect You Catch on the Line Costs Cents. The One You Miss Costs Millions.
Recall prevention, safety incident avoidance, and warranty claim reduction quantified into a single investment case for battery inspection.
Why Battery Inspection ROI Cannot Be Modeled Like Ordinary Quality ROI
Most manufacturing quality investments are justified against scrap reduction, rework labor, and throughput gains — numbers that are visible weekly on a plant floor dashboard and easy to track. Battery inspection ROI has to account for a category of cost that is largely invisible until it happens: a thermal runaway incident, a field fire, or a recall triggered by a defect that passed every inspection station in place at the time. These costs are rare in any given month but catastrophic in scale when they occur, which means a model built only on visible, weekly scrap savings will systematically understate the true value of the investment.
The other complicating factor is that a battery defect frequently does not fail immediately. A marginal weld, a slightly misaligned separator, or a contamination particle introduced during cell assembly can sit dormant for months or years before a specific combination of charge cycles, temperature, and vibration triggers a failure. This latency is exactly why traditional end-of-line functional testing, which checks a pack's performance at the moment it leaves the factory, cannot catch everything an upstream vision or X-ray inspection system can catch during cell and module assembly, before the defect is sealed inside a finished pack.
The Three Cost Categories a Complete Model Has to Capture
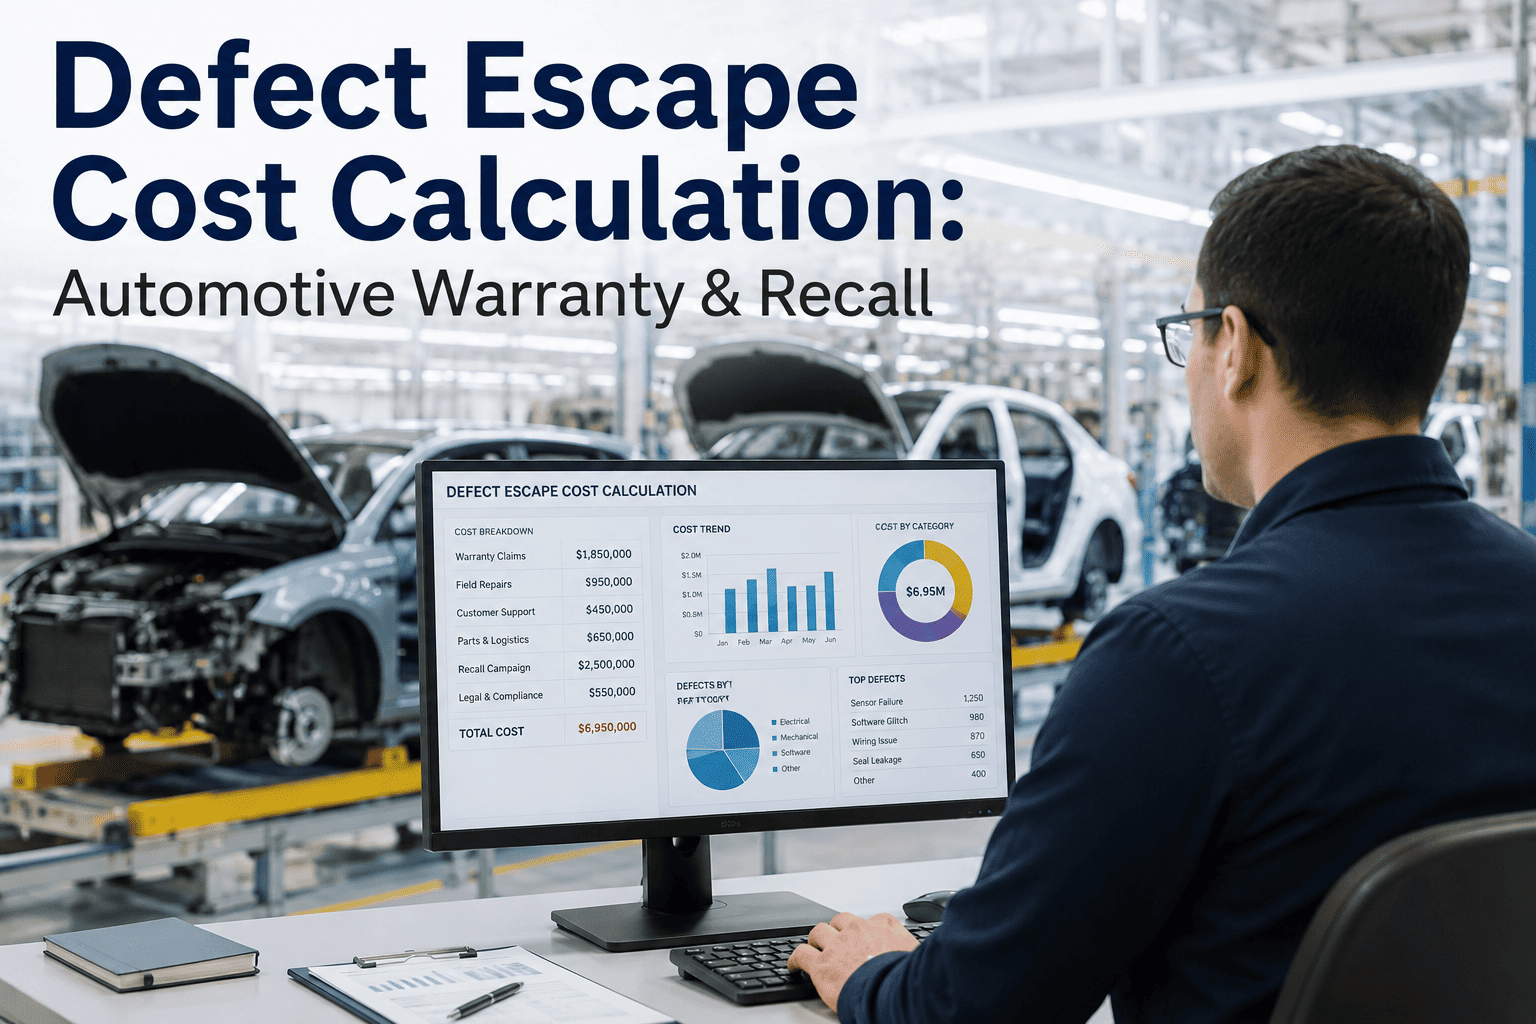
A defensible ROI model treats recall cost, safety incident cost, and warranty claim cost as three distinct line items, each with its own probability and its own typical magnitude, rather than collapsing them into a single vague "risk avoidance" number that is hard to defend to a finance team.
Field Retrofit, Logistics, and Brand Impact
Includes the direct cost of retrofit parts and labor across every affected vehicle, dealer logistics coordination, and the harder-to-quantify but very real brand and resale-value impact that follows a publicized battery recall.
Liability, Litigation, and Regulatory Exposure
Covers potential litigation exposure, regulatory investigation cost, and the liability tail that follows a thermal event tied to a manufacturing defect, which can extend for years after the incident itself.
Pack Replacement and Diagnostic Labor
Accounts for the direct cost of replacing packs under warranty, the diagnostic labor to confirm a defect pattern, and the elevated claim rate that a systemic manufacturing issue produces compared to normal field attrition.
Model Recall and Warranty Cost Avoidance for Your Program
Book a 30-minute walkthrough and we will build a cost-avoidance model using your program's actual pack volume and historical claim data.
Mapping Defect Type to Cost Category
Not every defect type carries the same downstream cost profile, and understanding which defects tend to drive recalls versus warranty claims versus safety incidents helps prioritize where inspection investment delivers the fastest return.
| Defect Type | Typical Detection Point | Dominant Downstream Cost | Inspection Method That Catches It |
|---|---|---|---|
| Separator misalignment | Cell assembly | Safety incident / recall | AI vision + X-ray at cell stacking |
| Weld porosity or void | Module assembly | Warranty claim / recall | AI vision on weld inspection station |
| Foreign particle contamination | Cell assembly | Safety incident | X-ray and vision at electrode inspection |
| Electrolyte fill variance | Cell finishing | Warranty claim | Sensor-based fill verification |
| Busbar connection defect | Pack assembly | Warranty claim / safety incident | AI vision at final pack assembly |
A Composite Scenario: The Recall That Cost Less Because It Never Reached Volume
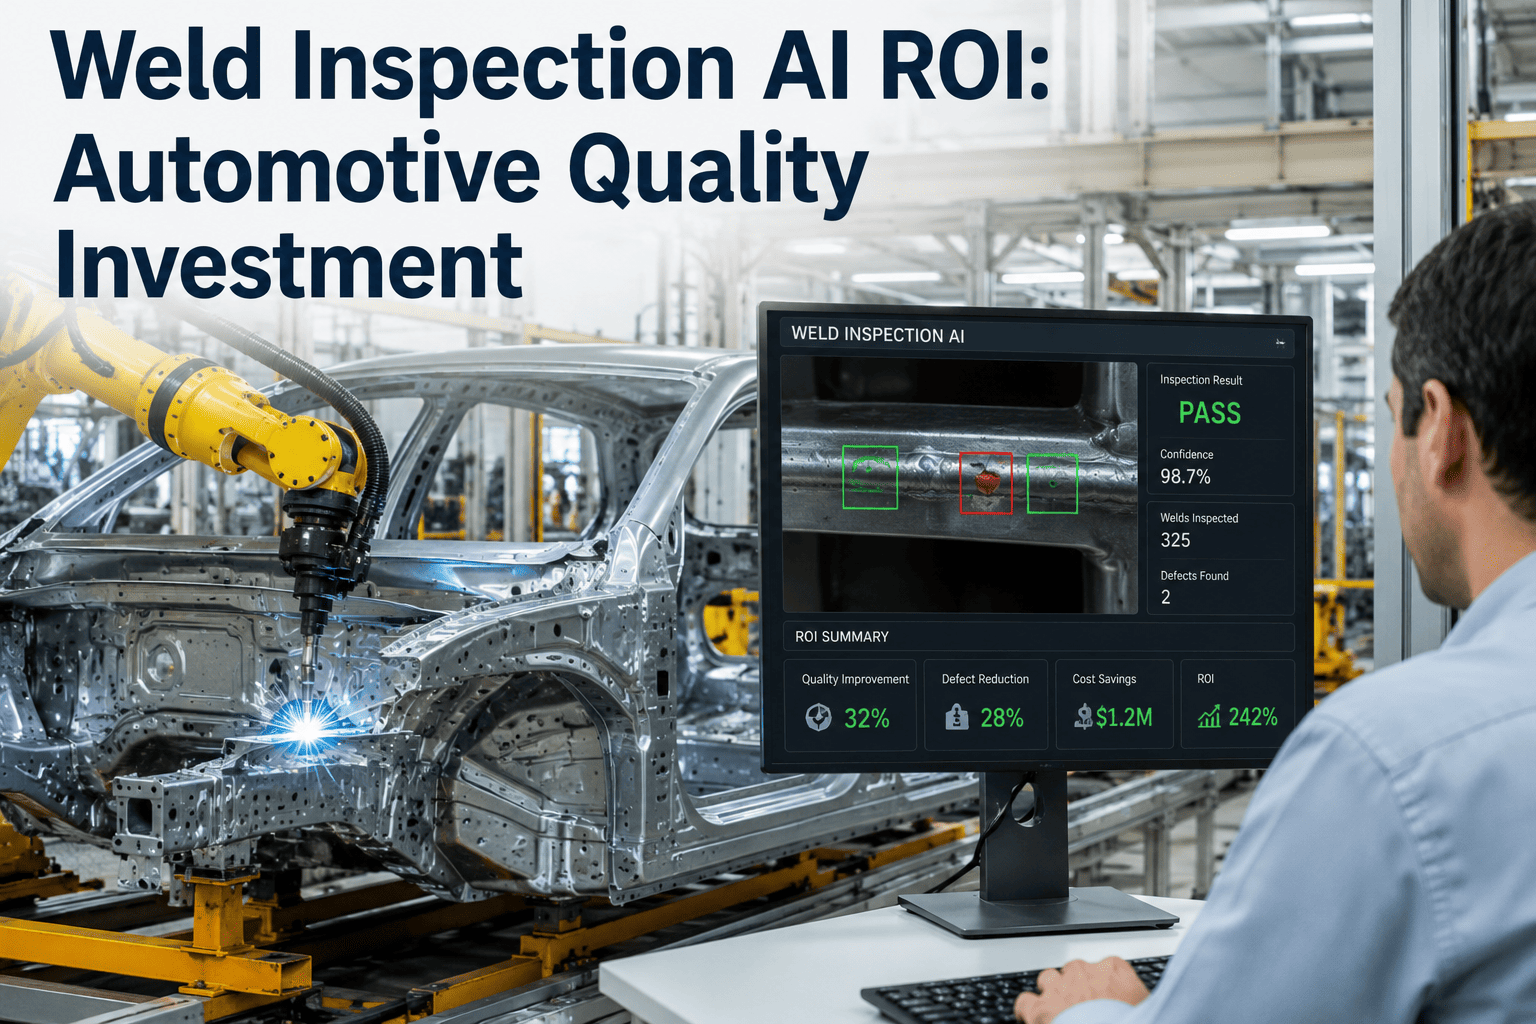
An EV manufacturer running a mid-volume battery pack line detected a weld porosity pattern through AI vision inspection at the module assembly stage roughly six weeks into a new production ramp. The defect rate was small — under half a percent of modules — but the pattern was consistent enough across a specific weld head that the system flagged it for engineering review well before the affected packs reached final vehicle assembly, let alone a dealer lot.
Root cause analysis traced the issue to a weld head calibration drift that had gone unnoticed under the previous manual sampling inspection process, which checked only a small percentage of welds per shift. Because the AI system inspected every weld rather than a sample, the defect was caught and corrected within days of onset rather than accumulating across months of production before a field failure pattern would have surfaced it. The manufacturer estimated that under the prior sampling-based process, a comparable defect would likely have gone undetected until warranty claims began appearing roughly eight to twelve months later — well after tens of thousands of affected packs had already shipped.
Common Mistakes That Undersell the Business Case
Modeling Only Scrap and Rework Savings
A model that ignores recall and safety cost avoidance dramatically understates the true value of battery-specific inspection, since those categories dwarf ordinary scrap cost when they occur.
Treating Recall Probability as Negligible
Battery recalls have become common enough across the industry that a probability-weighted model, even a conservative one, produces a meaningfully different result than assuming the risk away entirely.
Ignoring the Cost Multiple Between Detection Points
The same defect costs vastly different amounts depending on where it is caught. A model that does not reflect this multiple undersells the case for catching defects as early in the process as possible.
Leaving Brand and Resale Impact Out Entirely
Even when hard to quantify precisely, brand and resale value impact from a publicized battery recall is real and belongs in the model as at least a conservative estimated range rather than an unstated afterthought.
Is Your Program Ready to Build This Model
You have historical warranty claim data on prior battery programs
Even data from a prior generation program provides a useful baseline claim rate to anchor the model, rather than relying on an industry-wide average that may not reflect your specific pack design and chemistry.
Engineering can estimate a rough per-incident cost range for a safety event
A conservative range, even a wide one, is more defensible in a model than omitting safety incident cost entirely because an exact figure is hard to pin down.
You know your current inspection coverage rate at each defect-prone process step
Knowing whether current inspection is 100% coverage or a sampling rate is the starting point for estimating how much undetected risk currently exists in the process.
Building the Model: A Step-by-Step Approach
A credible battery inspection ROI model is built in a specific sequence, starting with the baseline and moving toward the probability-weighted risk categories that are harder to estimate but carry the largest financial weight. Skipping steps or jumping straight to a headline recall-avoidance number without first establishing the baseline tends to produce a model that looks impressive but does not survive scrutiny from a finance team or a program review board.
The first step is establishing current defect escape rate — the percentage of defects that pass whatever inspection process is currently in place and reach either final vehicle assembly or the field. This number is often uncomfortable to face directly, since it requires acknowledging that a sampling-based inspection process, however well designed, is mathematically guaranteed to miss some percentage of defects simply by virtue of not checking every unit. Establishing this baseline honestly is what makes every subsequent step in the model defensible.
The second step estimates how a shift to full-coverage AI-based inspection would change that escape rate, typically based on validated performance data from comparable deployments on similar defect types and pack architectures. This step benefits enormously from a pilot program, since real defect-detection data from your own line is far more persuasive in a model than a vendor's general performance claims from other customers' programs.
The third and final step applies the cost categories described earlier — recall, safety incident, and warranty claim cost — against the reduction in escape rate, weighted by realistic probability ranges for each outcome given your specific defect types and production volume. The result is a range rather than a single number, which is both more honest and, in most cases, still compelling enough to justify the investment even at the conservative end of the range.
How This Differs From a Traditional Vision Inspection Business Case
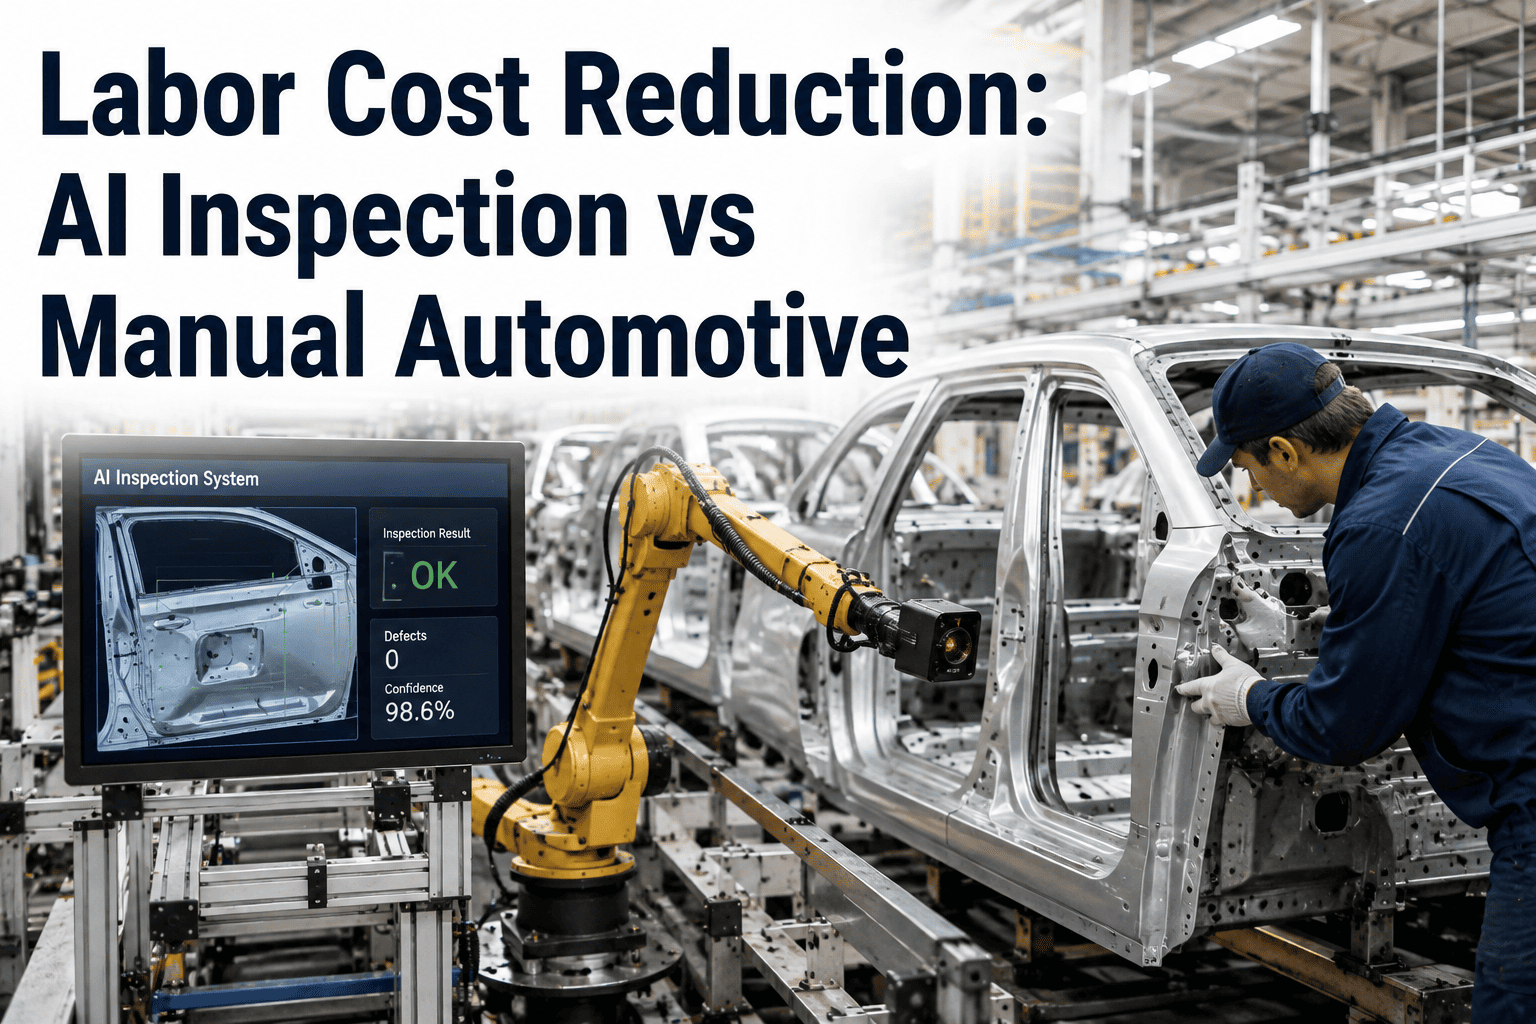
Manufacturers with experience justifying AI vision inspection investments in other contexts — stamping, welding, general assembly — sometimes assume the same business case template applies directly to battery production. The core mechanics are similar, but the weighting is very different. A stamping line inspection investment is justified almost entirely on scrap and rework savings, categories that are visible and easy to track weekly. A battery inspection investment draws most of its value from the recall and safety categories, which are rare but catastrophic, and this shift in weighting changes how the model should be presented and defended internally.
This distinction matters practically when presenting the model to a finance team that may be more familiar with the traditional vision-inspection business case. Framing battery inspection primarily as a productivity or scrap-reduction investment, rather than a risk-avoidance investment, tends to understate its true value and can lead to an inaccurate comparison against other quality investments with a fundamentally different risk profile. The strongest presentations make this distinction explicit up front, rather than forcing the audience to infer it.
Presenting the Model to Skeptical Stakeholders
A program manager or plant leader hearing a recall-avoidance argument for the first time often reacts with some version of "we have never had a recall on this program, so why would we start planning around one now." This reaction is understandable, since recall events are rare enough that any single program may genuinely never have experienced one directly, but it also reflects a common bias toward underweighting rare, high-severity risks relative to the frequent, visible costs that show up on a weekly scrap report. Addressing this reaction directly, rather than avoiding it, tends to produce a more productive conversation than hoping the model speaks for itself.
The most effective response draws on industry-wide recall data rather than any single program's history, since a program's own clean track record so far is not strong evidence that the underlying risk is actually low — it may simply reflect good fortune, a shorter field history, or a smaller fleet size that has not yet accumulated enough vehicle-years for a latent defect to surface. Presenting the model as an industry-calibrated risk assessment, rather than a prediction specific to this one program's fate, tends to land better with an audience that is otherwise inclined to dismiss the risk based on limited personal experience.
It also helps to present the model alongside the actual defect escape rate data gathered from a pilot deployment, since a concrete, current example of a defect that a legacy sampling process would have missed is far more persuasive than an abstract discussion of recall probability. Pairing the quantitative model with a specific, real example from the plant's own production data tends to shift a skeptical stakeholder's reaction from questioning whether the risk exists at all to discussing how quickly to move on addressing it.
Finally, framing the investment decision honestly as a choice under uncertainty, rather than promising a guaranteed outcome, tends to build more credibility than an overconfident pitch. No inspection system eliminates recall risk entirely, and acknowledging that directly while showing the model's estimated reduction in expected cost is a more defensible position than implying the investment makes a recall impossible.
Where This Fits Into a Broader Battery Quality Strategy
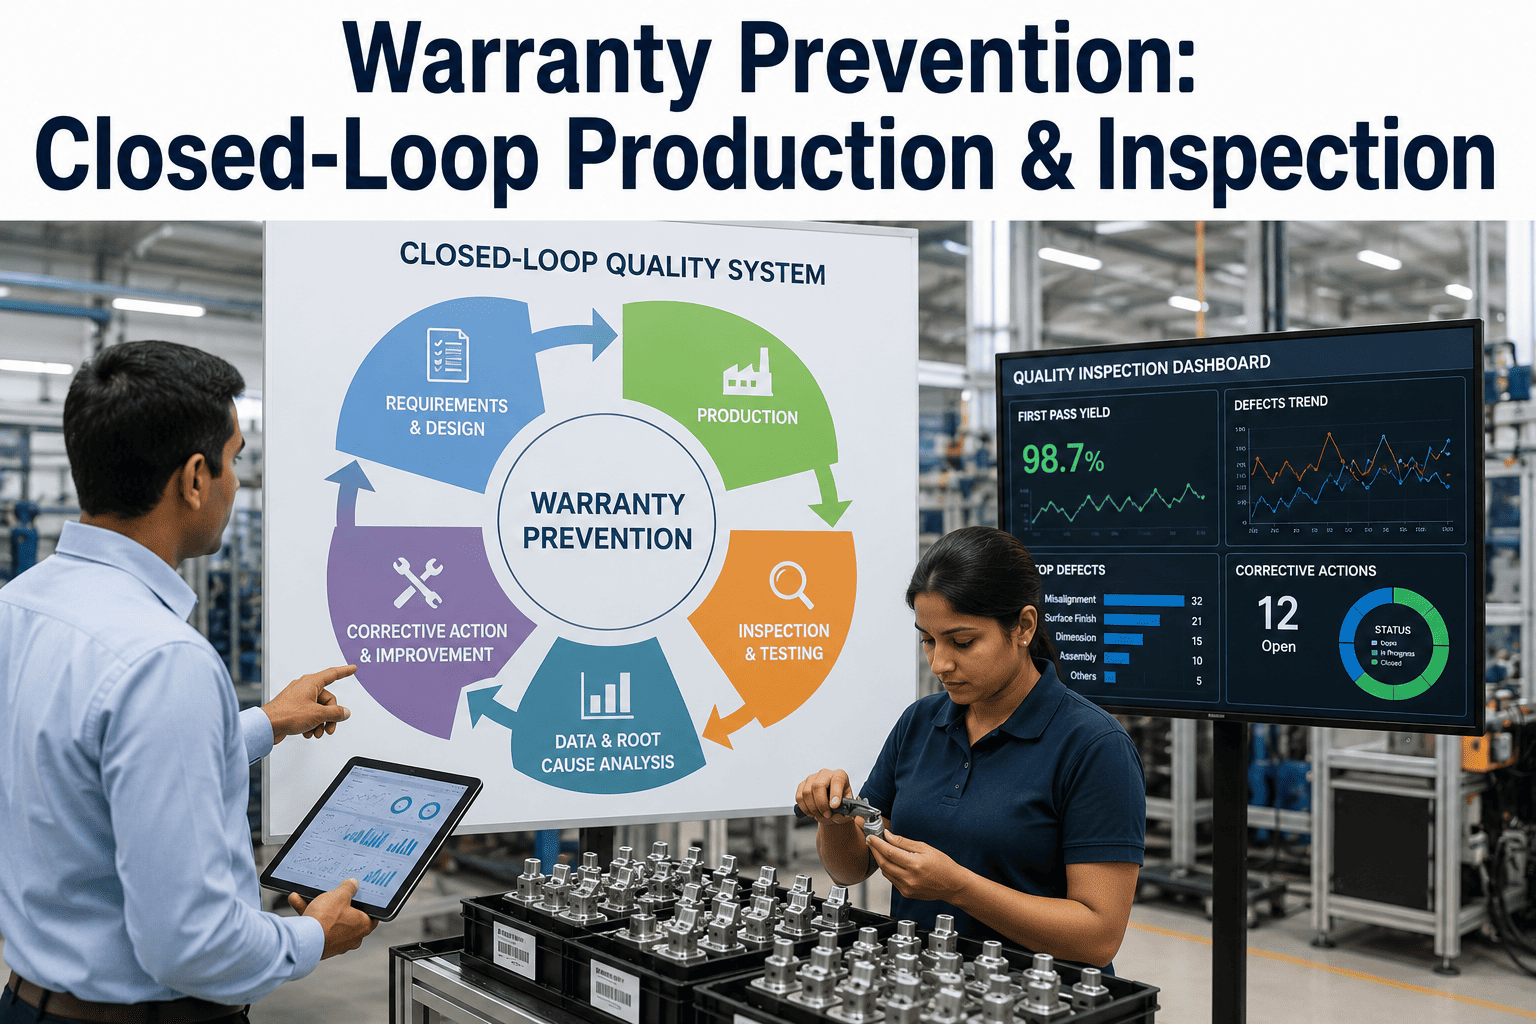
Inspection ROI is one piece of a larger battery quality strategy rather than a standalone initiative, and manufacturers get the most value from this model when it is built alongside a broader conversation about traceability, root cause analysis, and how defect data flows back into process control. A defect caught at inspection that is not traced back to its process origin will likely recur, which means the ROI of the inspection investment compounds significantly when it is paired with a feedback loop that actually closes the gap between detection and correction, as described in the gigafactory-scale weld example above.
Manufacturers building this model for the first time often find that the exercise itself, independent of whether it secures budget approval, surfaces gaps in defect tracking and cost visibility that are worth addressing regardless of the investment decision. Knowing your actual current escape rate, your historical warranty claim pattern, and your realistic exposure to a recall scenario are valuable inputs to quality strategy even outside the context of justifying a specific inspection technology purchase.
Frequently Asked Questions
How do you estimate the probability of a recall for a specific defect type?
Recall probability is best estimated by looking at published recall data for comparable defect categories across the EV industry, combined with your program's own historical defect rates and how consistently a given defect type has correlated with field failures on prior programs. A conservative model typically applies a probability range rather than a single point estimate, since actual recall triggers depend heavily on defect severity and how quickly a pattern is identified once vehicles are in the field. Teams building this model for a specific program can walk through the approach in detail by contacting iFactory support.
What is a reasonable estimate for the cost of a single battery pack recall?
Recall cost varies enormously based on the number of affected vehicles, the complexity of the retrofit required, and whether the defect requires a full pack replacement versus a more limited repair, but even a mid-volume recall affecting tens of thousands of vehicles has run into eight or nine figures across recent industry examples once retrofit labor, logistics, and administrative cost are included. Modeling a specific program's exposure requires knowing your production volume and the realistic retrofit complexity for your pack architecture.
Does earlier-stage inspection actually reduce recall risk, or does it just catch cost sooner?
Earlier-stage inspection does both. Catching a defect at cell or module assembly, before it is sealed inside a finished pack, prevents the defect from ever reaching the field in the first place rather than simply detecting it at a cheaper point in the process. This is a meaningful distinction from end-of-line functional testing, which can only catch defects that already manifest as a measurable performance issue at the moment of testing, missing latent defects that will only surface after months of field use.
How does warranty claim reduction get factored into the model separately from recall avoidance?
Warranty claims and recalls are modeled as distinct outcomes because most defects that pass initial inspection do not escalate into a full recall — they instead surface as elevated warranty claims over the vehicle's service life. A complete model estimates the reduction in expected warranty claim volume separately from recall probability, since the two represent different severity tiers of the same underlying defect risk and both carry real, quantifiable cost.
How quickly can a battery manufacturer expect to validate this ROI model against real production data?
Most manufacturers can validate the defect detection rate improvement within the first one to two months of production data once AI inspection is deployed, since that comparison only requires comparing detected defect rates against the prior inspection method's coverage. The recall and warranty cost avoidance portions of the model take longer to validate directly, since those outcomes play out over months or years of field service, which is why the model is built on probability-weighted estimates rather than waiting for an actual incident to prove the point. Book a demo to build a validation plan specific to your production timeline.
Quantify What a Missed Battery Defect Would Actually Cost
iFactory helps battery manufacturers build a defensible ROI model covering recall avoidance, safety incident risk, and warranty claim reduction. Book a walkthrough to see it built around your program.