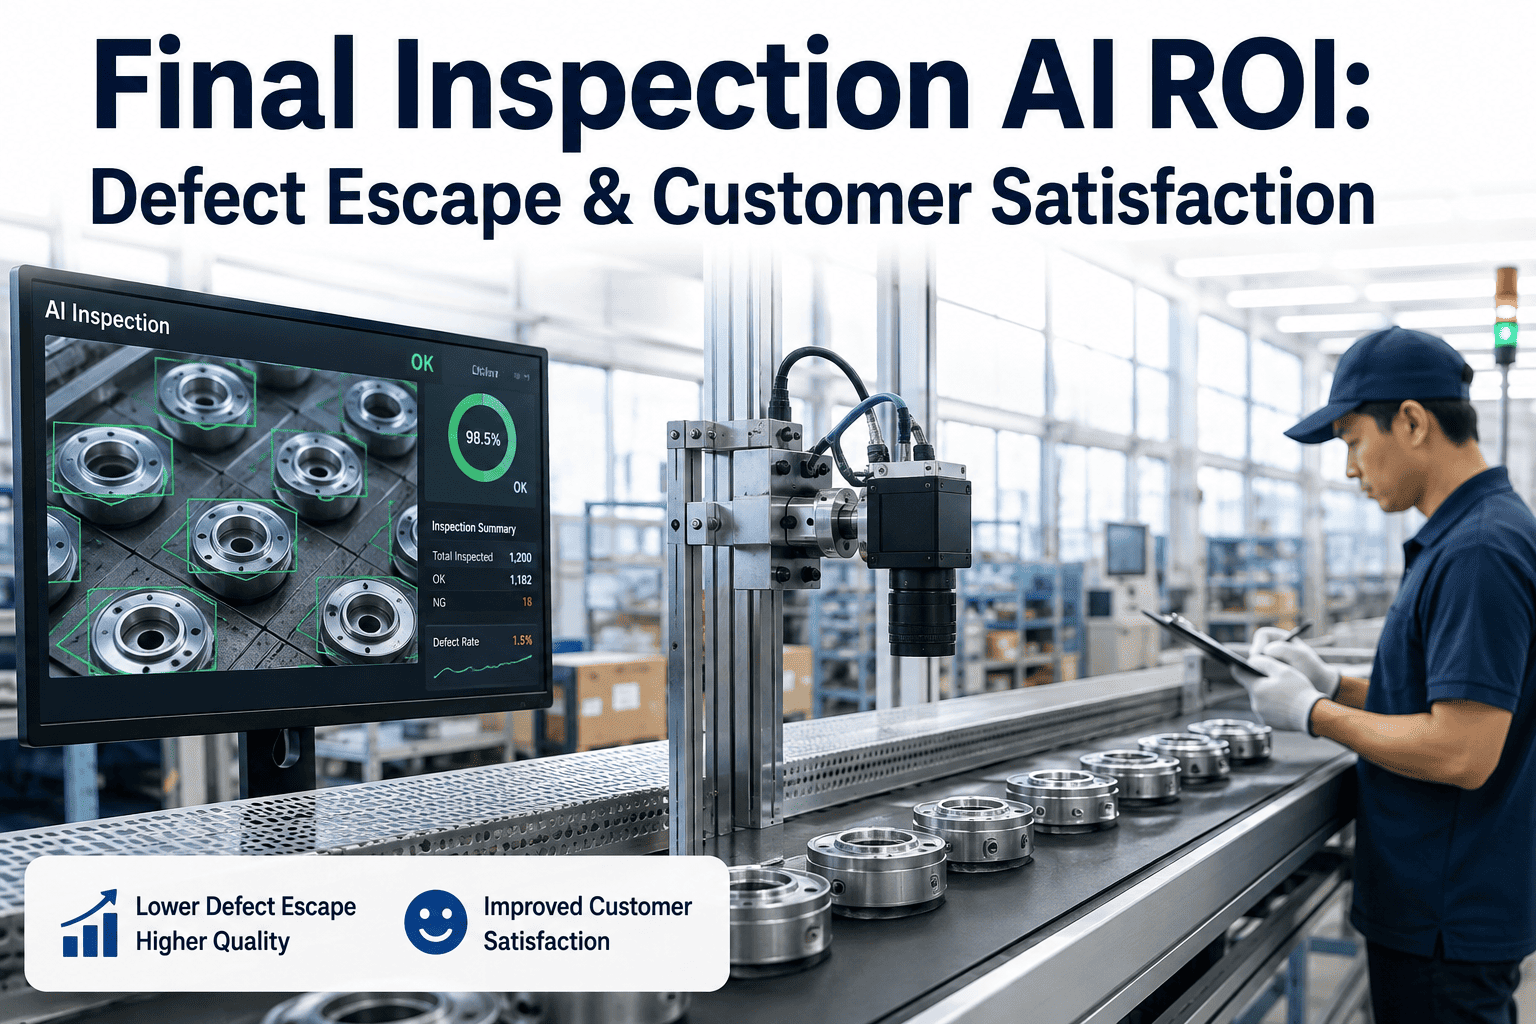
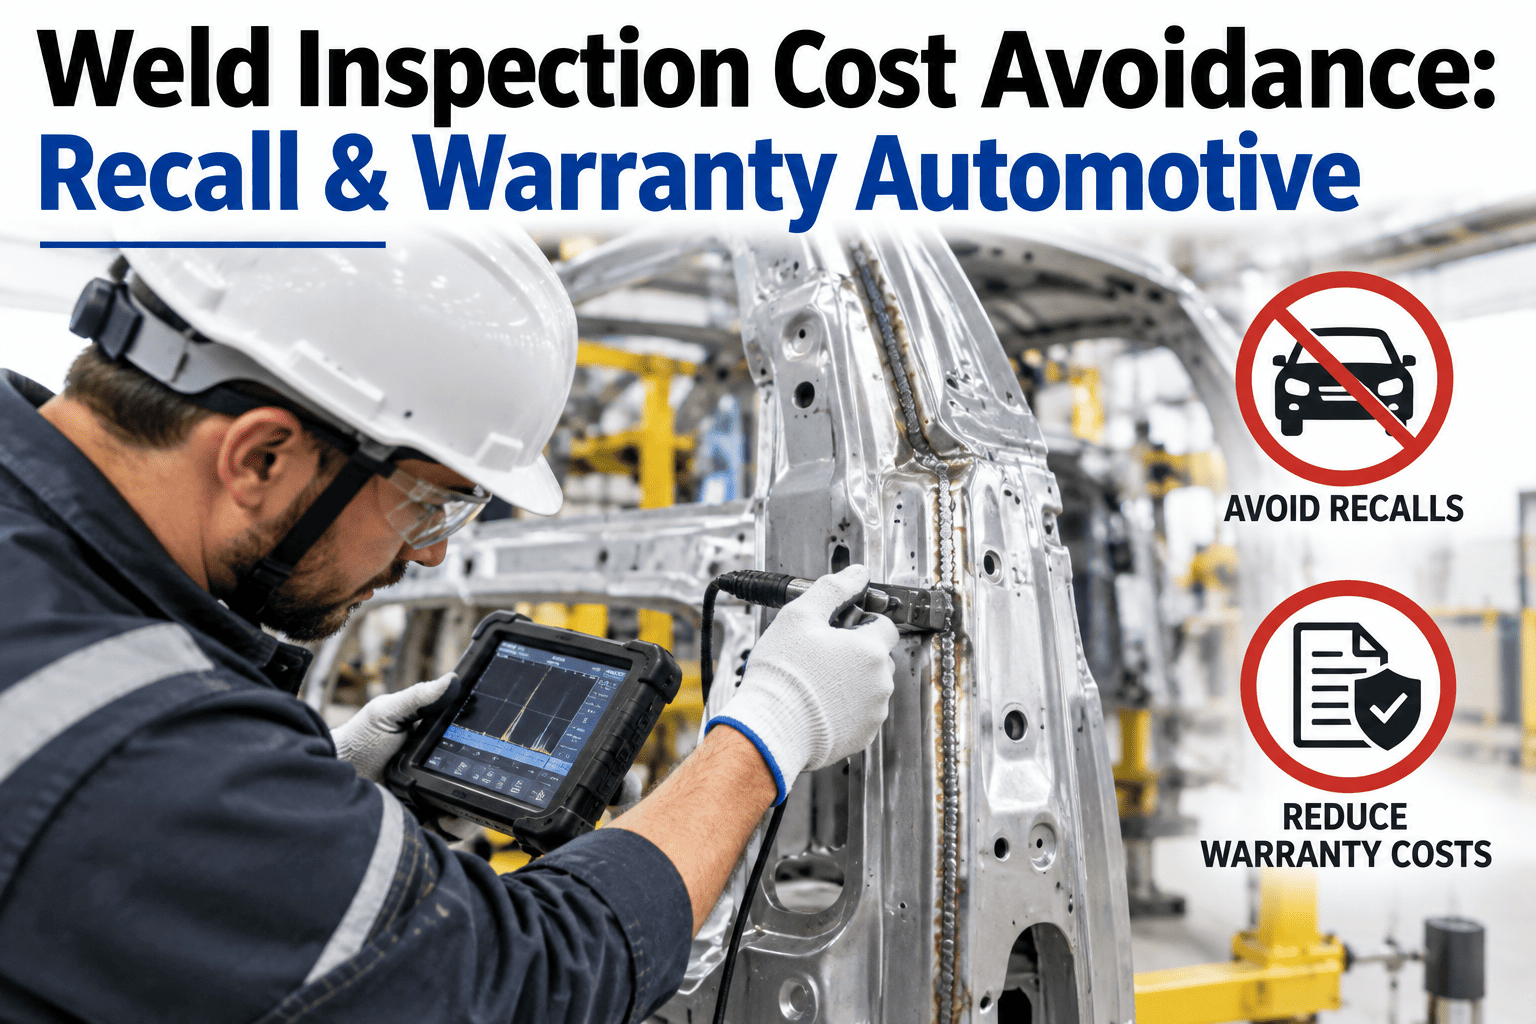
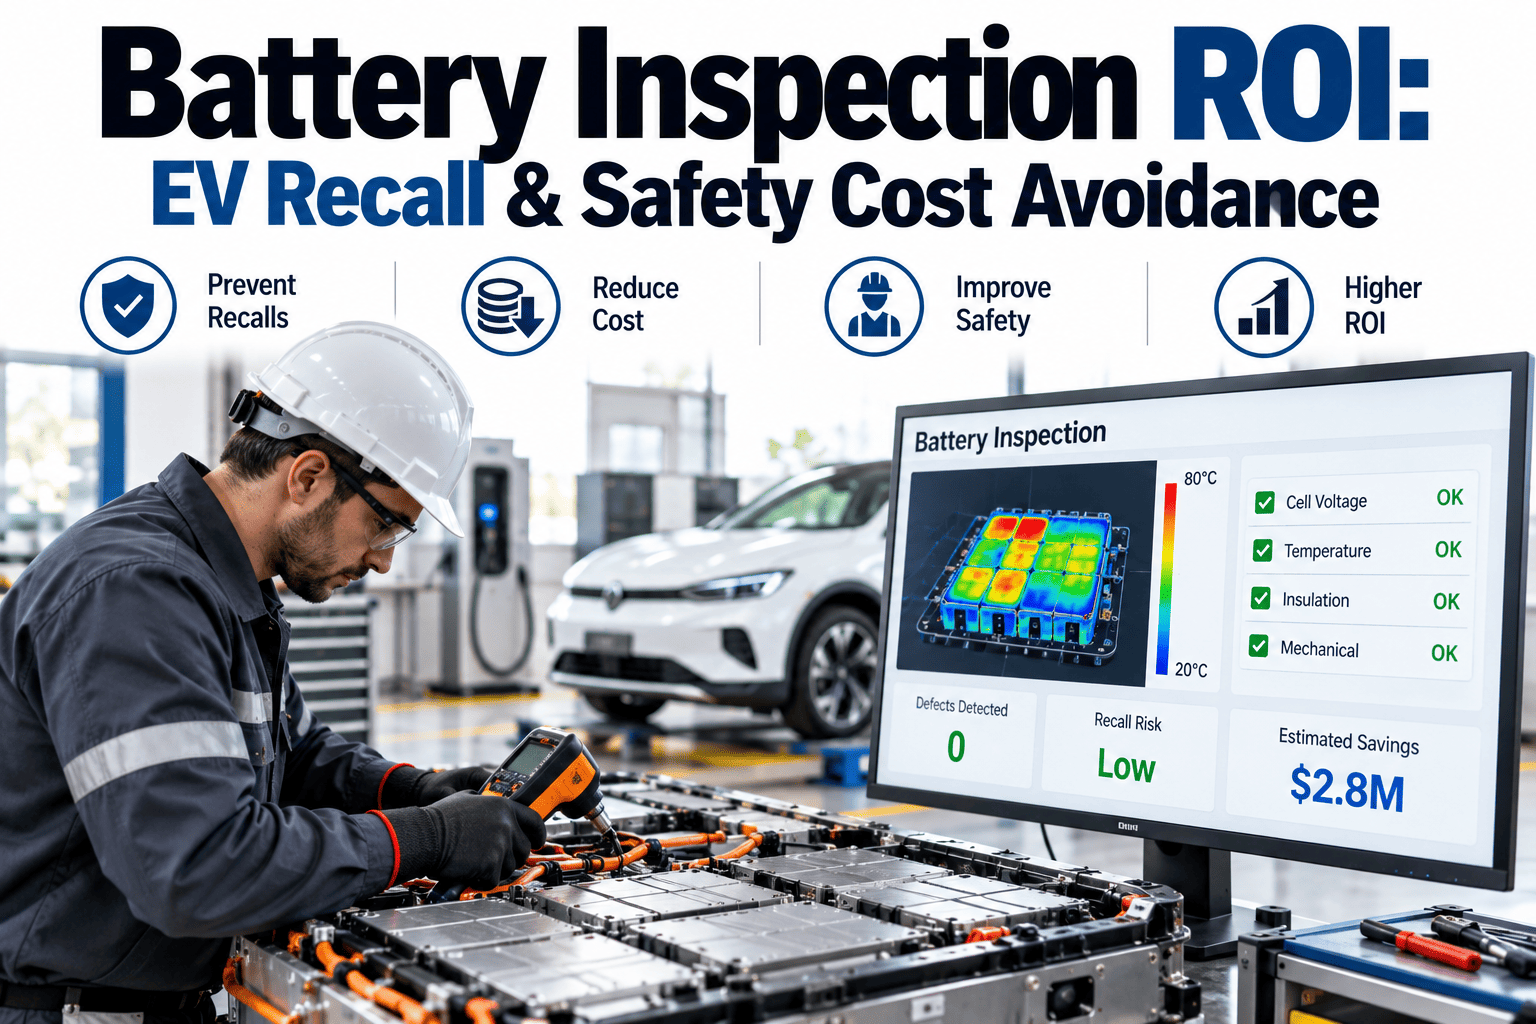
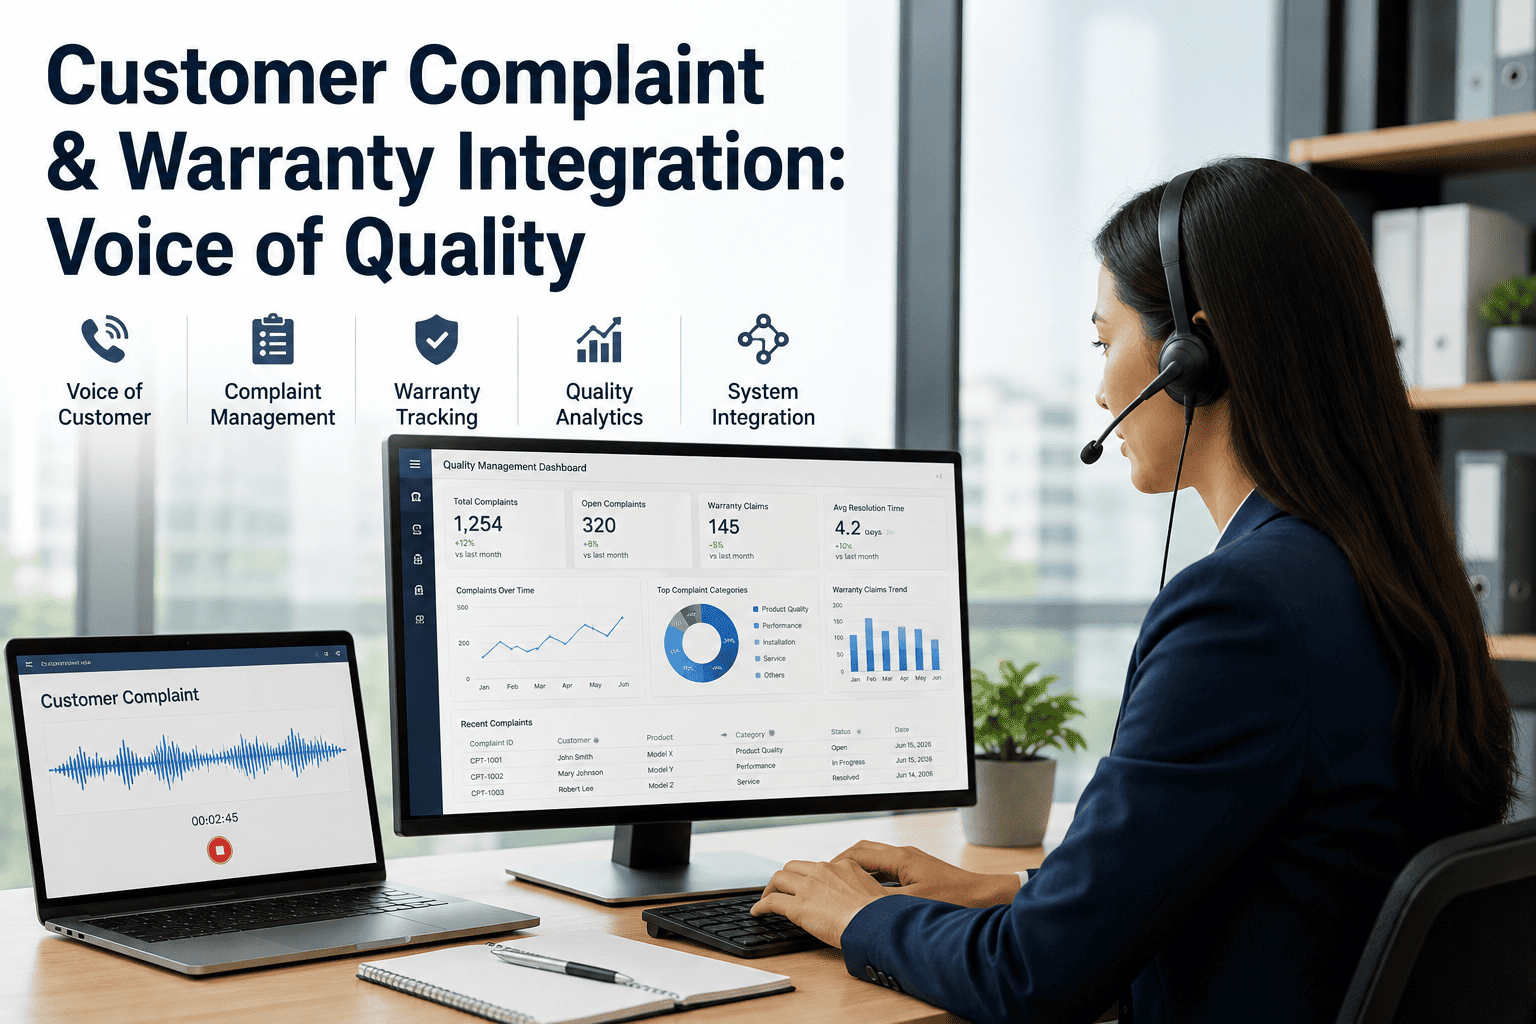
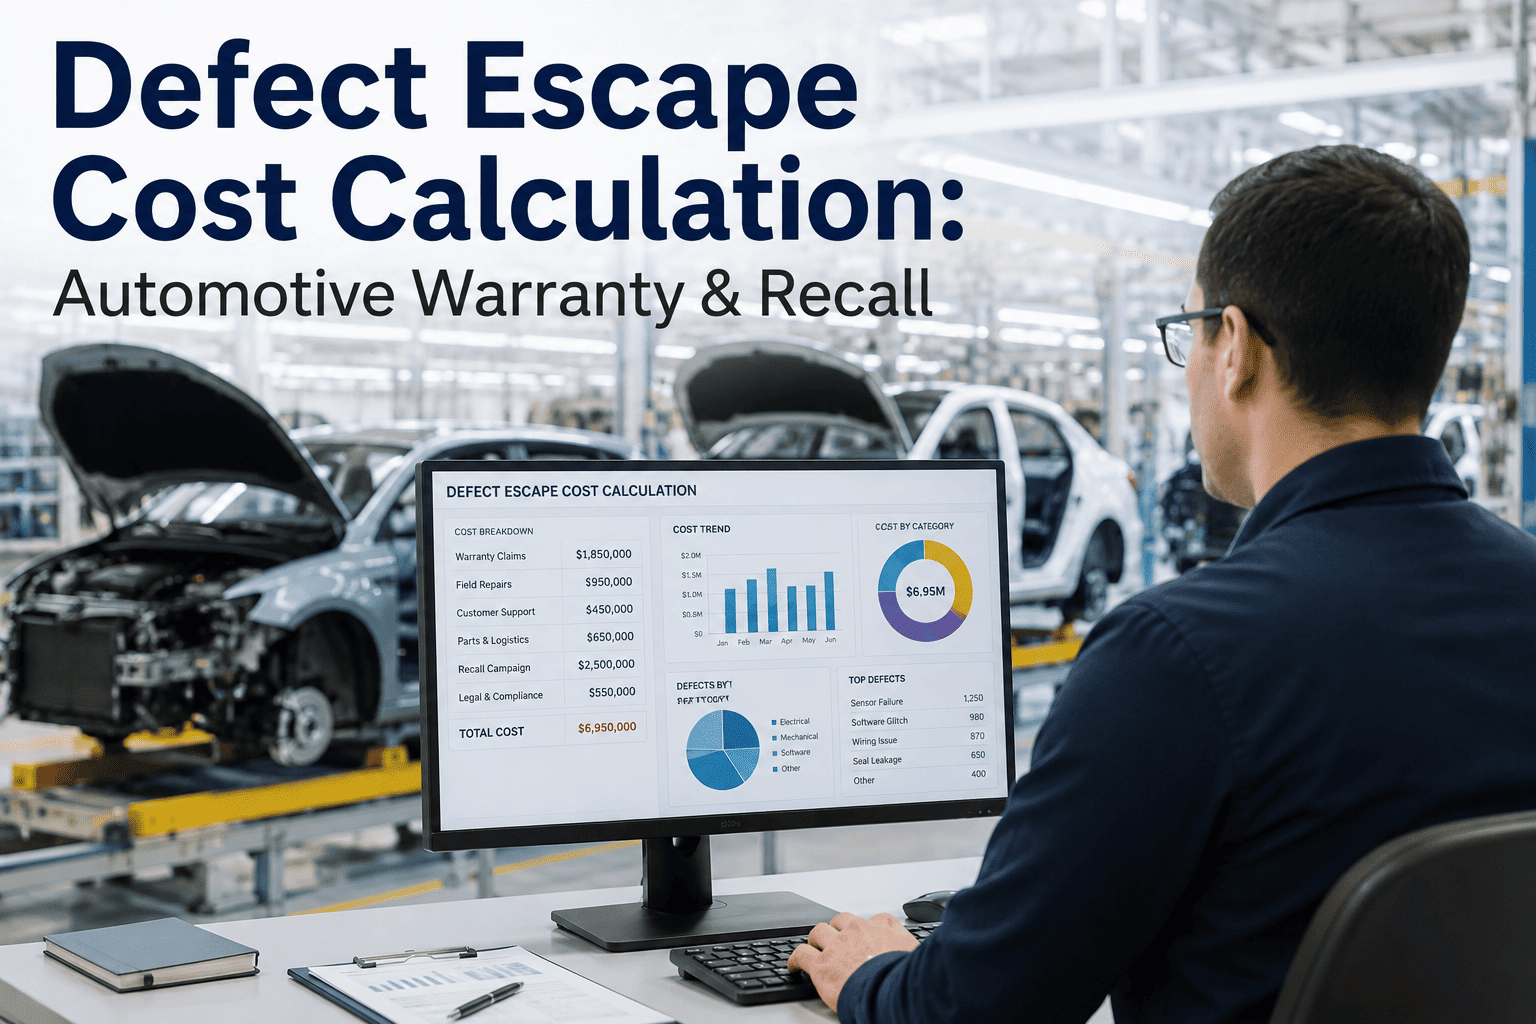
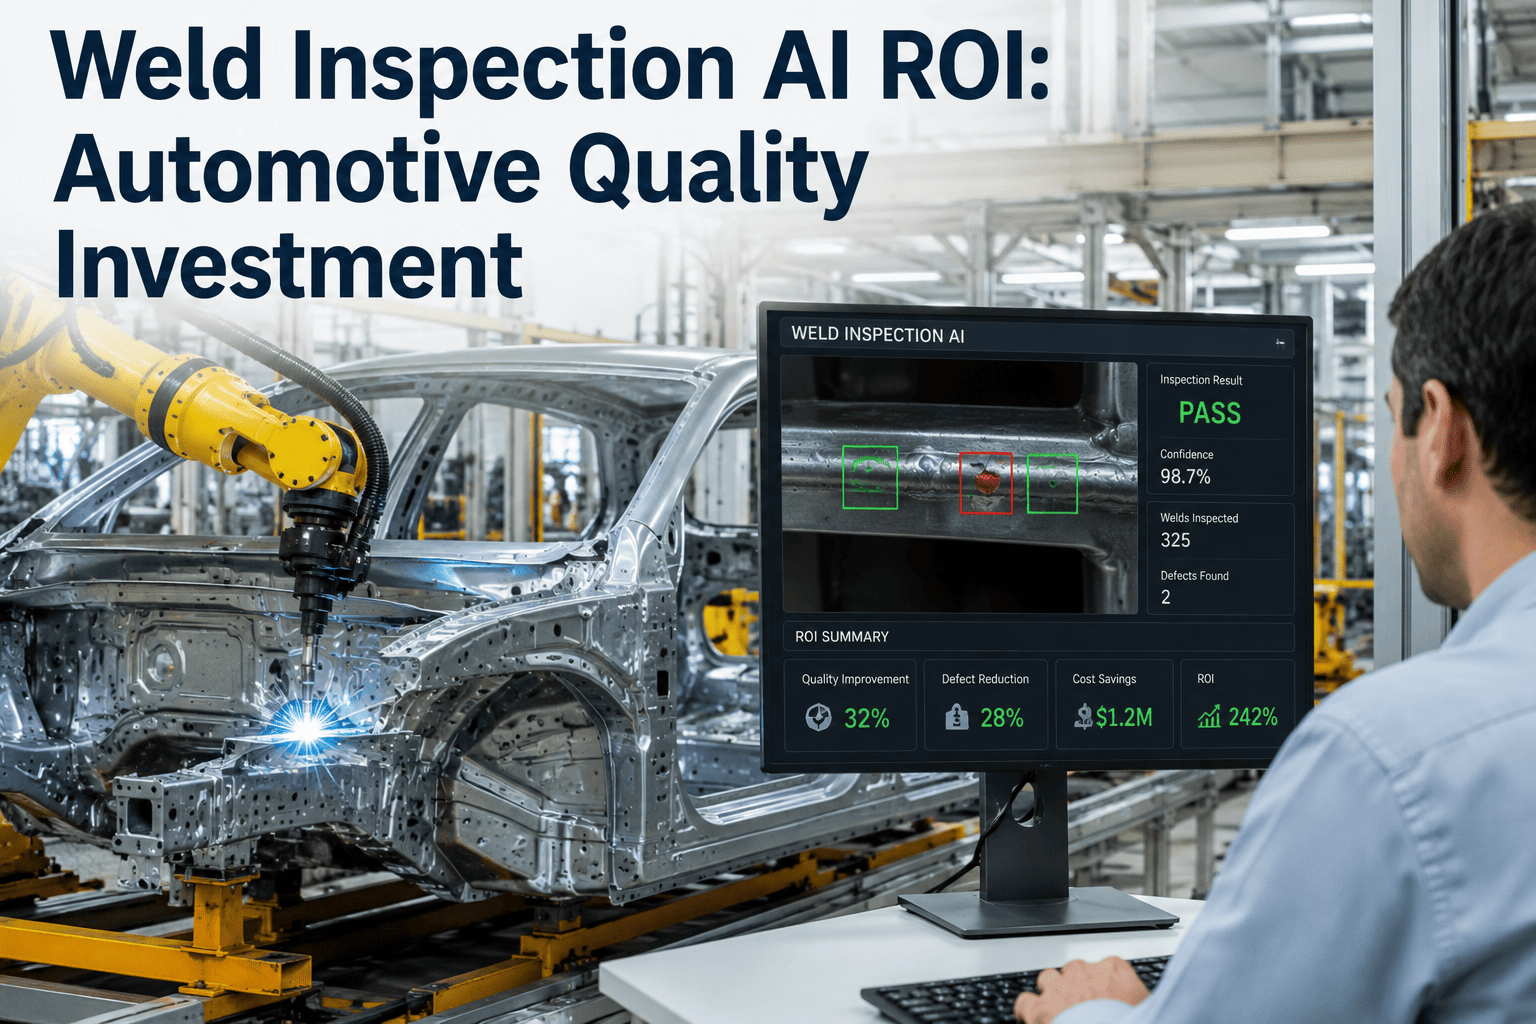
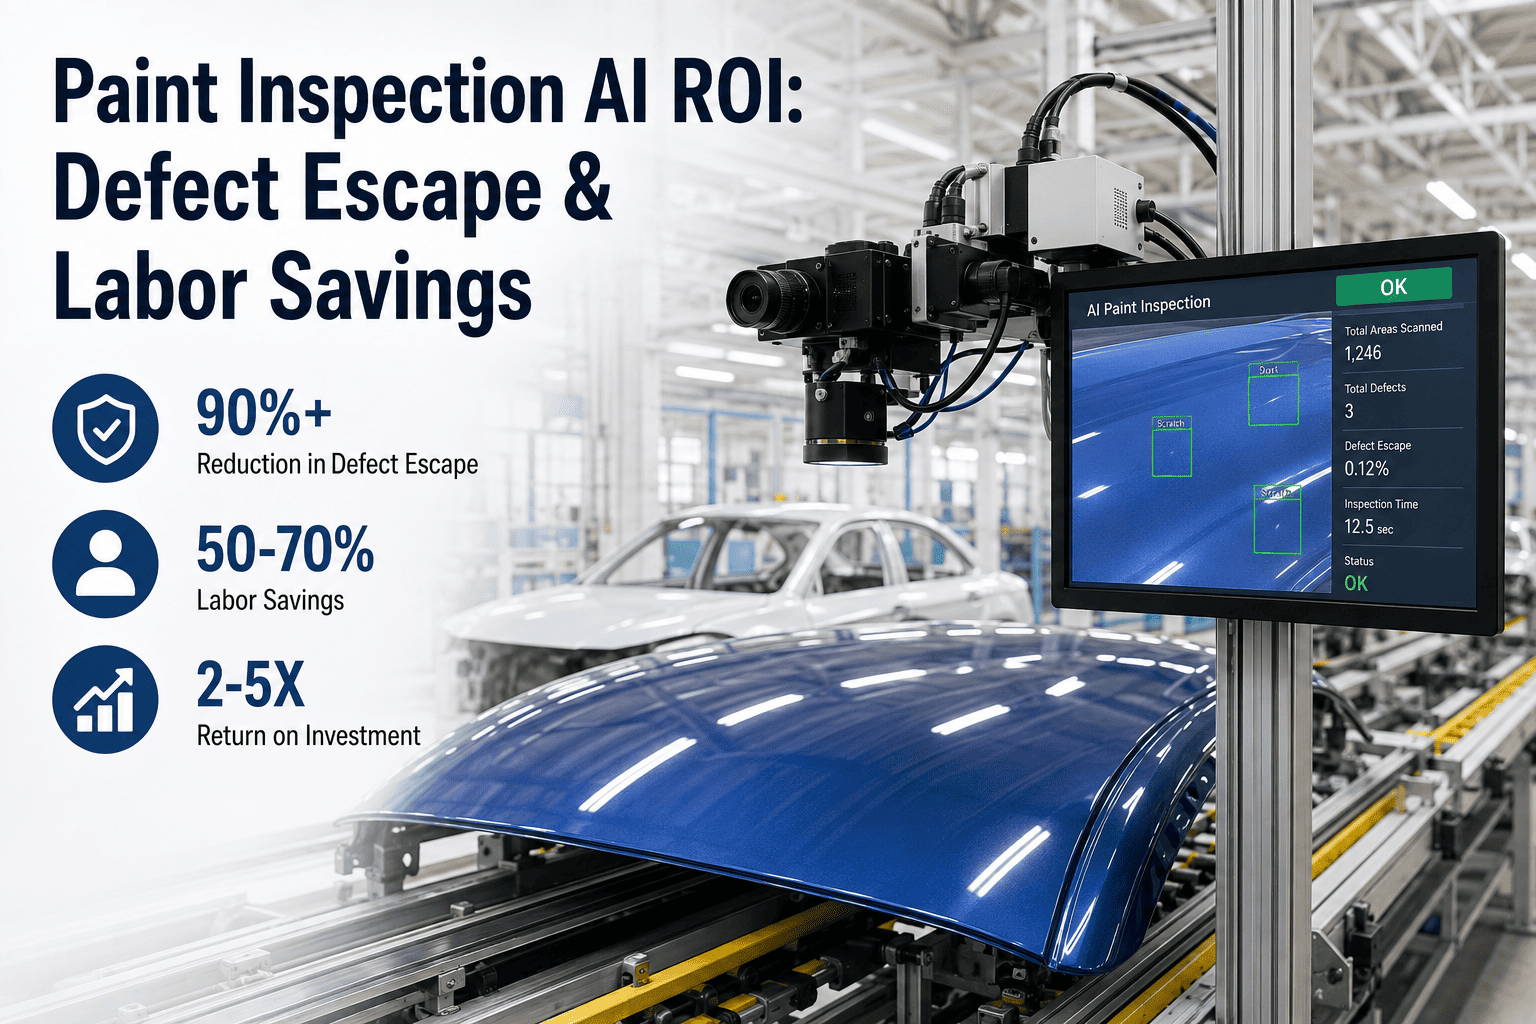
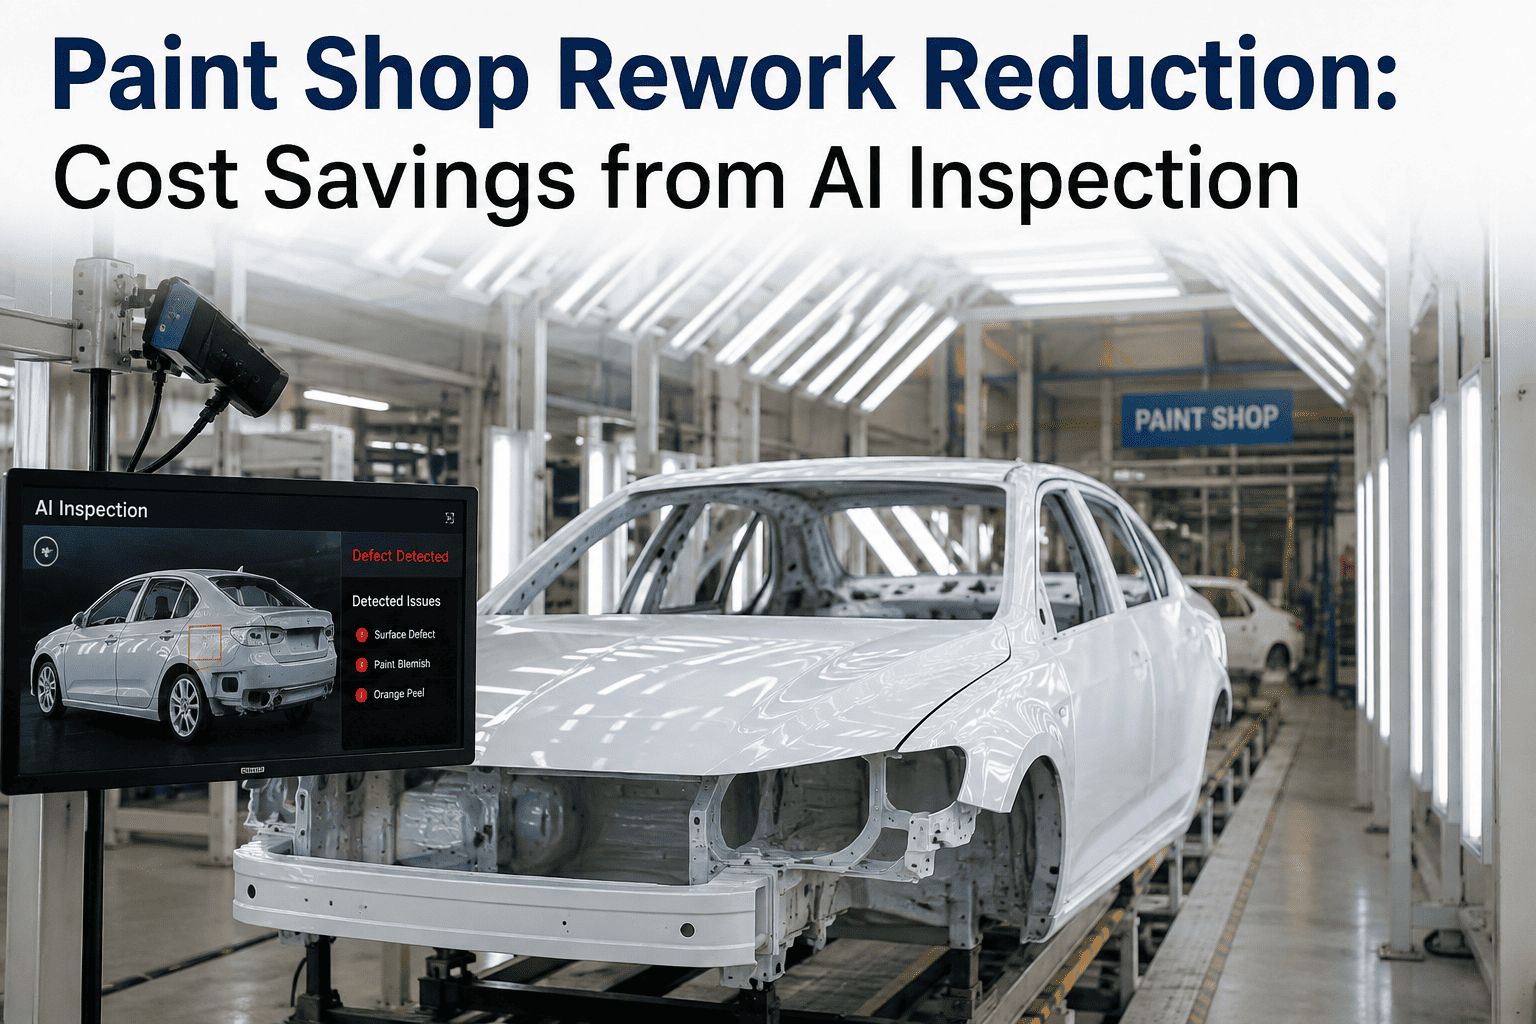
A defect that reaches a customer costs more than the warranty claim that eventually gets filed for it — it costs a piece of trust that took years of reliable ownership to build and takes a single bad delivery experience to damage. That's the part of the ROI case for final inspection AI that's hardest to put a clean number on, and it's exactly why finance approval conversations tend to stall on the softer half of the value even when the defect-escape math is solid. Building a business case that survives scrutiny means quantifying both sides — the hard cost of escapes and rework, and the more indirect but very real cost of customer satisfaction erosion. iFactory's inspection ROI platform is built to help plants make both halves of that case with real data.
Final Inspection AI ROI
Making the Full ROI Case: Defect Escapes and Customer Trust
The hard costs of rework and warranty are only half the story. See how to quantify customer satisfaction impact alongside defect escape savings for a business case that holds up.
Two Kinds of Cost, One Business Case
Final inspection AI investment cases usually get built around one visible number — reduced warranty spend — while leaving a second, often larger value category loosely gestured at instead of quantified. Both categories are real, and a stronger business case treats them as two layers stacked on top of each other rather than competing for the same line item.
Customer Trust & Satisfaction
Delivery experience, repeat purchase intent, brand perception impact from defect-free vehicles
Direct Cost Avoidance
Rework labor, warranty claims, campaign and recall exposure avoided by catching defects earlier
The Direct Cost Side of the Case
01
Rework Avoidance
Defects caught at inspection cost far less to fix than the same defect discovered further down the line or in the field.
02
Warranty Cost Reduction
Fewer escapes translate into fewer field claims, the most expensive category once a defect reaches a customer.
03
Campaign and Recall Avoidance
Catching a systemic issue at inspection instead of after a pattern of field failures avoids the largest cost tier entirely.
04
Inspection Labor Efficiency
Consistent AI screening frees inspectors for complex judgment calls rather than repetitive full-coverage scanning.
Why Customer Satisfaction Belongs in the Same Model
A customer who receives a vehicle with a visible defect — even one that gets fixed quickly under warranty — forms an impression that a defect-free delivery would never have created. That impression shows up later in survey scores, repeat purchase behavior, and word of mouth, all of which are measurable if a plant is willing to track them alongside inspection performance.
| Customer Impact Metric | What It Signals | How to Track It |
|---|
| Initial quality survey scores | First-impression defect sensitivity | Compare scores for vehicles with vs. without pre-delivery defects |
| Dealer-reported delivery issues | Defects caught at the dealer instead of the plant | Track dealer PDI findings tied back to build data |
| Repeat purchase / loyalty rate | Long-term trust impact | Cohort analysis against delivery quality history |
| Warranty claim sentiment | How a defect-driven claim affects broader brand perception | Customer service and survey feedback tied to claim records |
Want help structuring both halves of this ROI model against your own inspection and warranty data? Talk to our team before your next budget cycle.
Building the Combined Model
1
Baseline Escapes
Measure current defect escape rate and associated rework and warranty cost
2
Link to Satisfaction Data
Connect delivery quality records to survey scores and loyalty metrics where available
3
Pilot and Measure
Deploy AI inspection on one line and track both cost and satisfaction metrics together
4
Project and Scale
Build the full business case from validated pilot data rather than vendor averages
What a Well-Built Case Typically Shows
Lower
Warranty and rework cost per vehicle produced
Higher
Initial quality survey scores on defect-free deliveries
Stronger
Case for scaling inspection AI across additional lines
Building Stakeholder Confidence
Finance
Wants a payback timeline built from real baseline data, not vendor-supplied industry averages.
Quality Leadership
Needs proof detection accuracy on your specific defect types matches or beats current inspection performance.
Customer Experience Teams
Wants the satisfaction impact tracked with the same rigor as the cost-avoidance numbers, not treated as a soft add-on.
Plant Leadership
Needs a pilot-validated model tied to a specific line and budget cycle before committing to a full rollout.
Frequently Asked Questions
How do you actually quantify a soft metric like customer trust?
The most defensible approach ties customer satisfaction survey scores and repeat purchase data to specific vehicles' delivery quality records, so the comparison is between actual defect-free and defect-affected deliveries rather than an industry generalization. That linkage takes effort to build but turns a soft metric into something a finance team can actually evaluate.
Our team can help think through how to structure that linkage for your data.
Which part of the ROI case should be presented first to leadership?
Leading with the hard, easily verified cost-avoidance numbers tends to build credibility before introducing the customer satisfaction layer, since decision-makers are generally more comfortable evaluating a familiar cost model before a newer, less standardized metric.
How long does it take to see customer satisfaction data move after deployment?
This tends to lag behind cost-avoidance metrics, since satisfaction and loyalty signals accumulate over ownership experience rather than showing up immediately, so a realistic model treats it as a medium-term proof point rather than an early pilot metric.
Does a pilot need to run on the whole plant to validate this model?
No, a single-line pilot is usually enough to validate detection accuracy and establish a cost-avoidance baseline, and it can also be enough to begin tracking satisfaction data on a comparative basis if delivery tracking already exists for that line's output.
What's the right first step in building this business case?
Start with a baseline audit of current defect escape rate, rework cost, and warranty history, the same foundation any inspection ROI model needs, then layer in whatever customer satisfaction data your organization already collects.
Book a demo to see how that combined baseline typically comes together.
Build a Business Case That Covers Both Sides of the Value.
Model Cost Avoidance and Customer Trust Together
Bring your current defect, warranty, and satisfaction data. We'll show you where the strongest combined case sits for your plant.