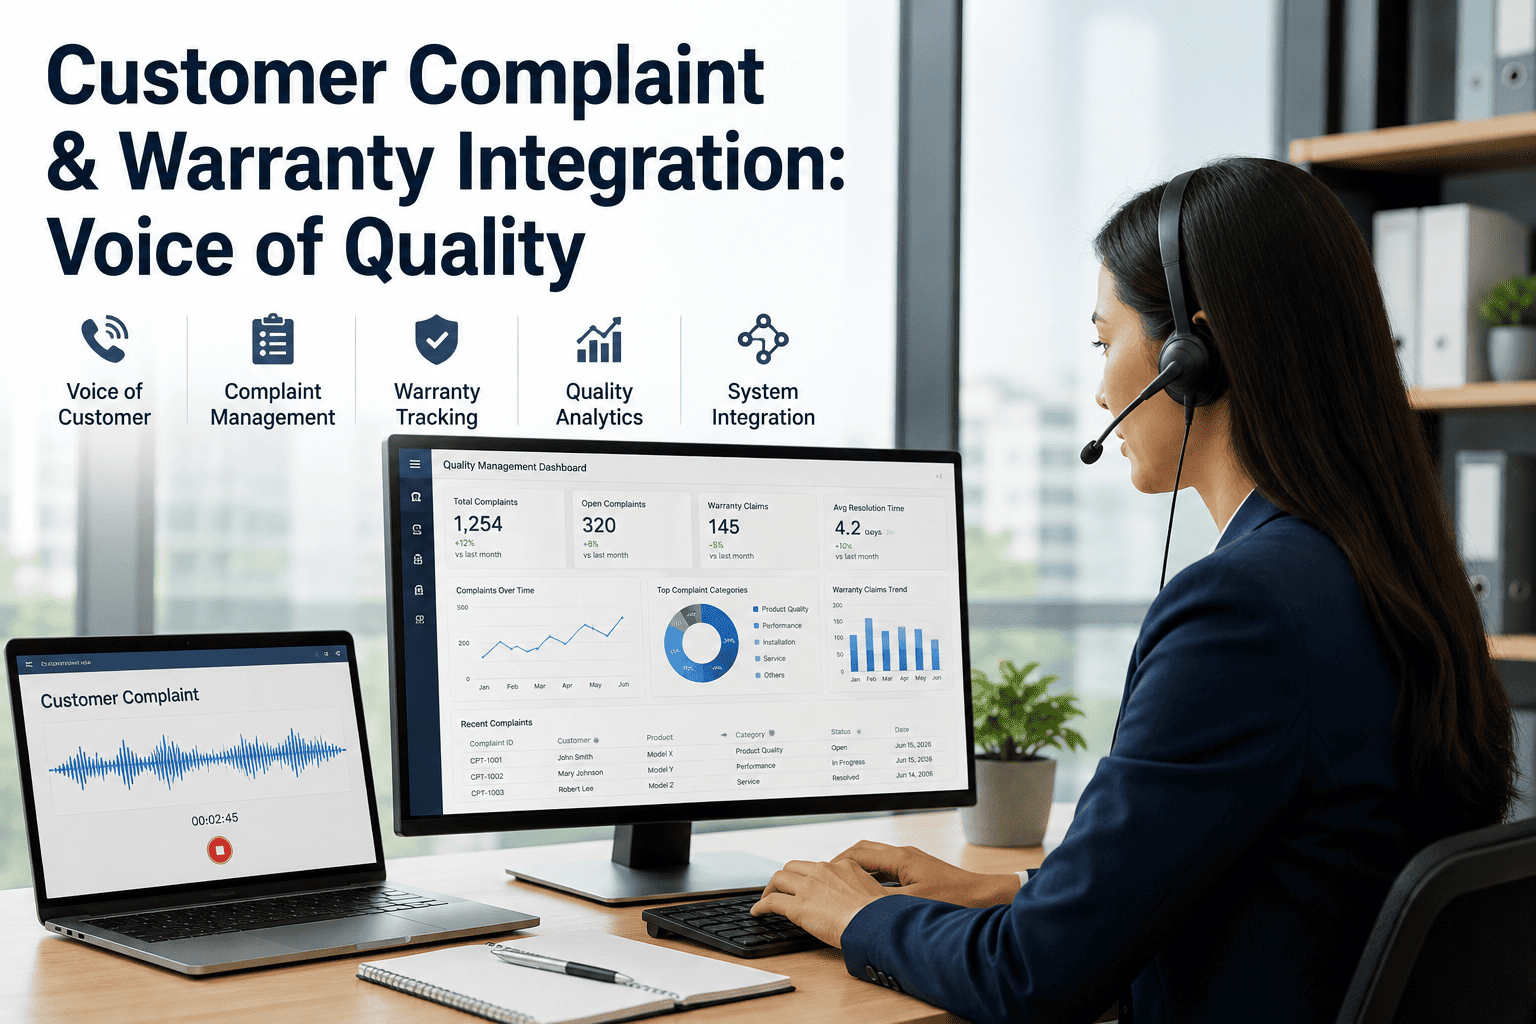
Warranty claims and customer complaints are usually filed in two completely different systems by two completely different teams, which means the quality organization ends up analyzing warranty cost trends without ever seeing the words customers actually used to describe the problem. A rattle a customer calls "annoying but livable" and a rattle a technician codes as "trim noise, no fault found" can be the exact same defect, but if the complaint text and the warranty claim code never sit in the same view, that connection gets lost, and so does the early signal that would have let engineering catch the issue before claim volume climbed. Closing that gap is what voice-of-quality integration is about: pulling customer complaint narratives, call center notes, and dealer service write-ups into the same timeline as warranty claims and part return data, so quality teams can see both what broke and how customers actually experienced it. This page walks through why the two data sources drift apart, what a connected view actually looks like, and how to build the correlation without a multi-year data platform project. You can talk to support about how this maps to your current CRM and warranty systems.
Customer Words and Warranty Codes Rarely Agree — Until You Put Them on the Same Timeline
iFactory links complaint text, call center tags, and warranty claim codes to the same VIN and defect cluster, so quality teams catch the pattern before it shows up as a claim spike.
Complaint captured in free-text form, often in the customer's own words
Free text translated into a standardized warranty claim code
Claim enters the warranty database, complaint text often left behind
Analysis runs on claim codes alone, missing the original customer context
Every Handoff From Customer to Claim Loses a Little Bit of Signal
The path from a customer noticing a problem to that problem showing up in a warranty database passes through several handoffs, and each one translates the original complaint into a more standardized, less descriptive format. That standardization is necessary for claims processing and reimbursement, but it strips out exactly the nuance that would help engineering understand root cause faster. A customer who says a door "feels like it's going to fall off when I close it hard" and a customer who says a door "rattles at highway speed" might both get coded under the same latch warranty category, even though they're describing two different failure modes that need different fixes.
Standardized claim codes are essential for cost tracking, but they collapse a wide range of customer descriptions into a small number of categories, hiding sub-patterns within a single code.
Whether a customer described a problem as a minor annoyance or a safety concern rarely survives translation into a claim record, even though that distinction matters enormously for prioritization.
A customer who calls twice before a claim is ever filed generates two data points that usually live in a CRM system the warranty database never references.
Technician write-ups often contain the most specific diagnostic detail of the whole chain, but they're frequently stored only at the dealer level and never rolled up centrally.
Four Data Sources, One Defect Cluster
Voice-of-quality integration doesn't require replacing your CRM or warranty system. It means building a layer that links records across those systems by VIN, date, and defect category, so a quality analyst can pull up a single cluster and see every related touchpoint in one place.
| Data Source | What It Captures | Typical Owner | Linked By |
|---|---|---|---|
| Call Center Logs | Free-text complaint description, call reason tags, escalation flags | Customer experience team | VIN, customer ID, date |
| Dealer Service Notes | Technician diagnosis narrative, parts replaced, repeat visit flags | Dealer service network | VIN, repair order number |
| Warranty Claims | Standardized failure code, labor time, part cost, claim date | Warranty administration | VIN, claim number |
| Parts Return / Teardown | Physical inspection findings on returned failed parts | Engineering / quality lab | Part serial, claim number |
Complaint Frequency Often Leads Claim Volume by Weeks
One of the most useful patterns to watch for is the lag between when complaint volume for a given issue starts rising and when that shows up as a measurable increase in warranty claims. Customers frequently mention a developing problem to a call center or during an unrelated service visit well before it becomes bad enough to justify a formal warranty claim, which means complaint text is often a leading indicator, not a lagging one.
Teams that only monitor claim volume are, in effect, watching the trailing edge of a pattern that complaint data would have shown them weeks earlier. Closing that lag is often the single biggest reason to invest in linking the two data sources in the first place.
See Your Complaint-to-Claim Lag on One Timeline
iFactory pulls call center, dealer, and warranty data into a single defect view so your quality team can act on the leading signal, not just the trailing one.
Five Practical Steps to Link Complaint and Claim Data
VIN is usually the most reliable common field across CRM, dealer, and warranty systems, so confirm it's captured consistently at every touchpoint before building any correlation logic.
Customers describe the same problem in dozens of different phrasings, so grouping by underlying theme rather than exact keyword match captures far more of the real pattern.
Define a reasonable window, such as 60 to 90 days, for treating a complaint and a later claim on the same VIN as related, since too tight a window misses real patterns and too loose a window creates false links.
Technician write-ups often contain the missing diagnostic detail between a vague customer complaint and a specific claim code, so prioritize getting that data centrally accessible even if it starts as a manual upload.
When a cluster is escalated, send the original complaint language along with the claim data, not just a summarized defect code, so engineering understands how customers actually experienced the issue.
Catching a Trim Rattle Before It Became a Recurring Claim Category
Call center logs showed a rising number of customers describing an interior noise using varied language, "clicking," "rattling," "loose panel," none of which matched a single existing claim code cleanly. Warranty claim volume for that period looked unremarkable, so the pattern went unnoticed for nearly two months.
Once complaint text was grouped by theme instead of exact keyword, the varied noise descriptions clustered clearly around a single interior trim clip on one model year. Engineering received the cluster with original complaint language attached, identified an undersized clip tolerance, and issued a running production change before claim volume for that issue climbed further.
A Realistic First 90 Days
Teams that succeed with this kind of integration tend to resist the urge to link every data source across every model line on day one. A more realistic path starts narrow, proves the value on a single defect category, and expands from there once the process and the cross-functional buy-in are established.
Choose a category where the quality team already suspects complaint data would tell a fuller story than claim codes alone, ideally one with visible customer frustration or executive attention.
Gather three to six months of complaint and claim history for the chosen category to establish whether a meaningful lag pattern actually exists before building broader infrastructure.
Share the connected timeline with customer experience, warranty administration, and engineering leadership to build shared understanding of what the data actually shows.
Agree on what level of complaint growth triggers an engineering review and who is responsible for making that call, before expanding the approach to additional defect categories.
What to Track Once Complaint and Claim Data Are Linked
Once the two data sources sit together, the natural next question is what to actually measure. A handful of metrics tend to give quality teams the clearest read on whether a defect cluster deserves escalation, and tracking them consistently across every model line makes cross-program comparison possible instead of relying on gut feel about which issues are getting worse.
The share of complaints on a given theme that eventually turn into a filed warranty claim tells you how often customer-reported concerns are severe enough to warrant a repair, and a rising conversion rate on a stable complaint volume is often an early sign that a defect is worsening.
Tracking the typical gap between when a customer first mentions an issue and when it becomes a formal claim helps quality teams understand how much lead time complaint data realistically buys them for a given defect category.
A customer returning to the dealer multiple times for what appears to be the same underlying issue, even if coded differently each visit, is a strong signal that the root cause hasn't actually been resolved by prior repair attempts.
Counting how often words associated with safety concern or strong dissatisfaction appear in complaint text for a given cluster helps prioritize which issues need faster engineering attention regardless of current claim cost.
Getting Cross-Functional Buy-In for a Shared View
The technical work of linking data sources is usually more straightforward than the organizational work of getting customer experience, dealer network, warranty administration, and engineering teams to agree on a shared view of the same defect clusters. Each of these teams has historically owned its own data and its own definitions of severity and priority, and a connected view inevitably surfaces disagreements that were previously invisible because no one was looking at the same numbers.
Starting with a single high-visibility defect category, rather than attempting to link every complaint and claim across the entire vehicle lineup at once, tends to build the credibility needed for broader rollout. Once one team sees a cluster caught weeks earlier than it would have been under the old process, buy-in for expanding the approach to additional categories becomes a much easier conversation than trying to sell the concept in the abstract before there's a concrete result to point to.
It also helps to agree early on who owns the escalation decision once a cluster crosses a defined threshold. Without a clear owner, a connected view can surface plenty of interesting patterns that never actually translate into a production change, which defeats the purpose of building the capability in the first place. Assigning a specific role, whether that's a quality engineer, a program manager, or a cross-functional review board, to act on flagged clusters keeps the system from becoming a dashboard nobody actually uses to make decisions.
The Kinds of Issues Complaint Data Surfaces First
Not every defect category benefits equally from complaint-warranty integration. Some failure modes are immediately obvious and get coded consistently from the first customer contact, leaving little ambiguity for complaint text to resolve. Others are exactly the kind of intermittent, subjective, or slow-developing issue where the gap between what a customer says and how it eventually gets coded is largest, and where a connected view adds the most value.
Problems that don't reproduce reliably on the shop floor often get logged as "no fault found" even when the customer has described a consistent pattern across multiple complaints, making complaint frequency a valuable corroborating signal.
NVH complaints are highly subjective and described in wildly different language from one customer to the next, which is exactly the kind of variation that theme-based grouping is built to catch that keyword matching would miss.
Software issues frequently generate customer complaints well before a formal defect is confirmed, since customers notice odd behavior long before engineering has isolated a reproducible bug to file a claim against.
Wear-related issues that develop gradually often generate a string of minor complaints before a customer finally brings the vehicle in for a claim-worthy repair, giving a long runway for early detection if the complaints are tracked.
Recognizing which categories are most likely to benefit from this kind of integration helps focus the initial rollout on the defect types where complaint data has the most to add, rather than spreading effort evenly across categories where claim codes already tell most of the story on their own.
Making the Handoff to Engineering Actually Useful
A connected view is only valuable if the output of that analysis actually changes what engineering does next, and that depends heavily on how the information is packaged when a cluster gets escalated. Handing engineering a spreadsheet of claim codes and counts tells them what happened, but handing them the original complaint language alongside the claim data tells them how it happened from the customer's perspective, which is often the detail that shortens root cause investigation.
It also helps to include a rough timeline showing when complaint volume started rising relative to when claims began, since that context helps engineering understand whether they're looking at a new issue that just emerged or a long-simmering one that finally crossed a reporting threshold. Teams that build this kind of context into every escalation package tend to see faster turnaround on root cause investigation than teams that hand off claim codes alone and expect engineering to reconstruct the customer experience from cost data.
Finally, closing the loop back to the customer experience and dealer teams once a fix has been identified helps validate whether the production change actually addressed what customers were describing, not just what the claim code technically represented. This feedback step is often skipped, but it's the piece that confirms the connected view is catching real issues and not just generating interesting but ultimately unhelpful correlations.
Common Questions About Complaint-Warranty Integration
Do we need to replace our CRM or warranty system to do this?
How do we handle complaint text that doesn't match any existing claim code?
What time window should we use to link a complaint to a later claim?
Can this help us prioritize which complaint clusters to escalate first?
Does this require natural language processing expertise on our team?
Connect Customer Voice to Warranty Cost Before the Pattern Peaks
iFactory brings complaint, dealer, and claim data into one defect view so your quality team acts on the earliest available signal.