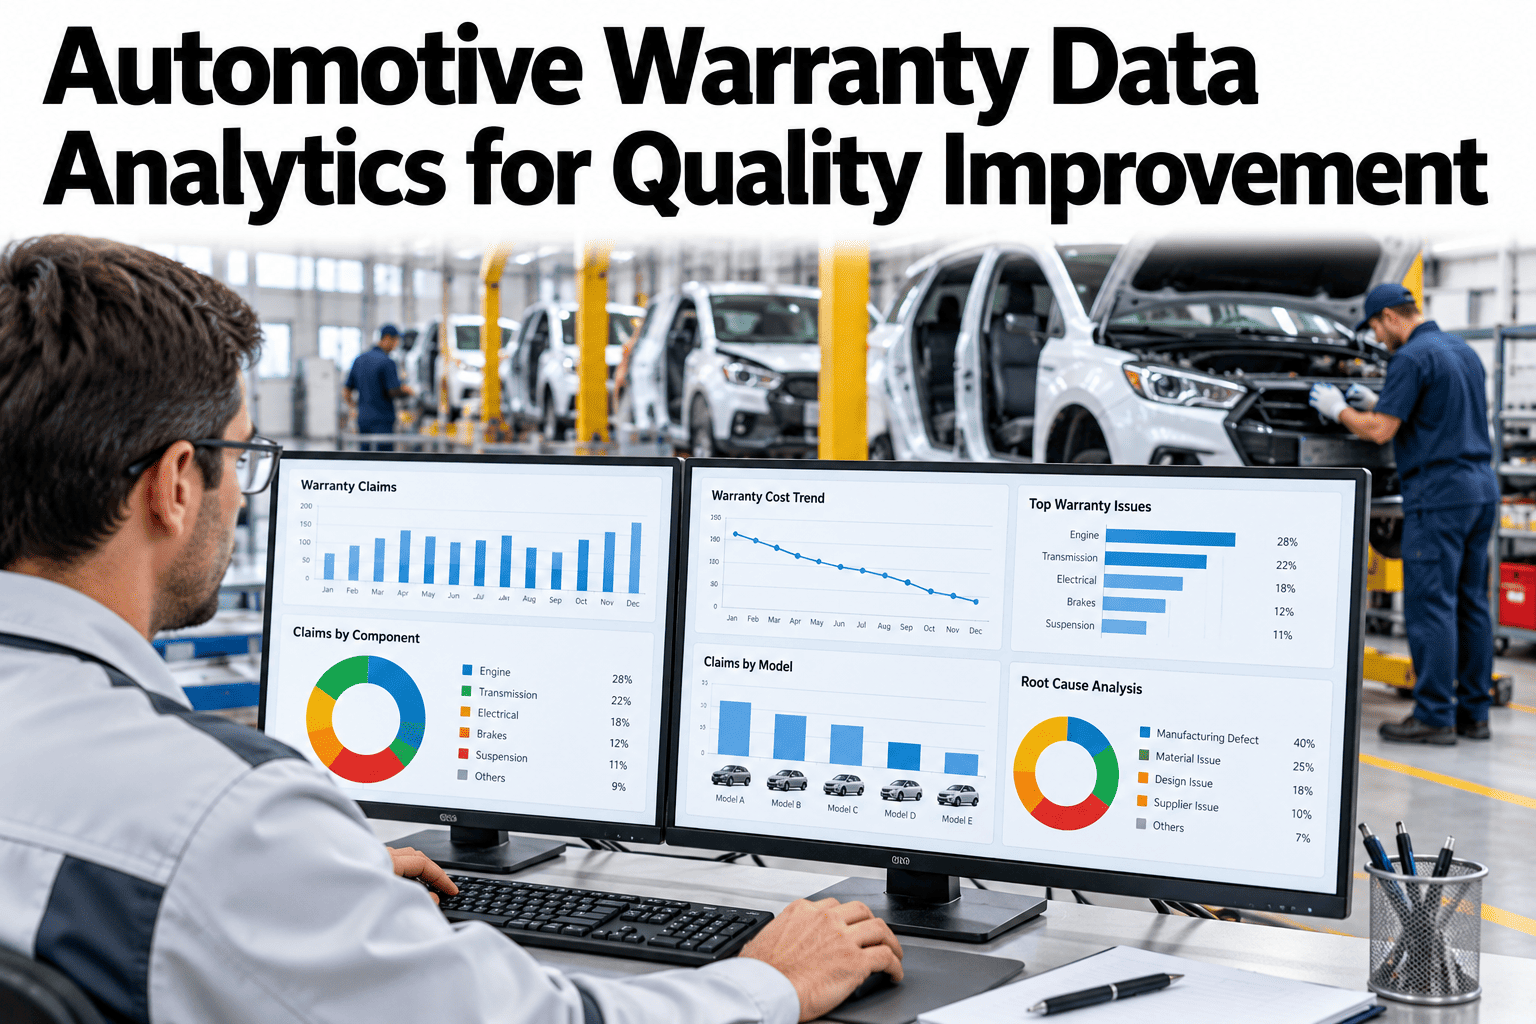
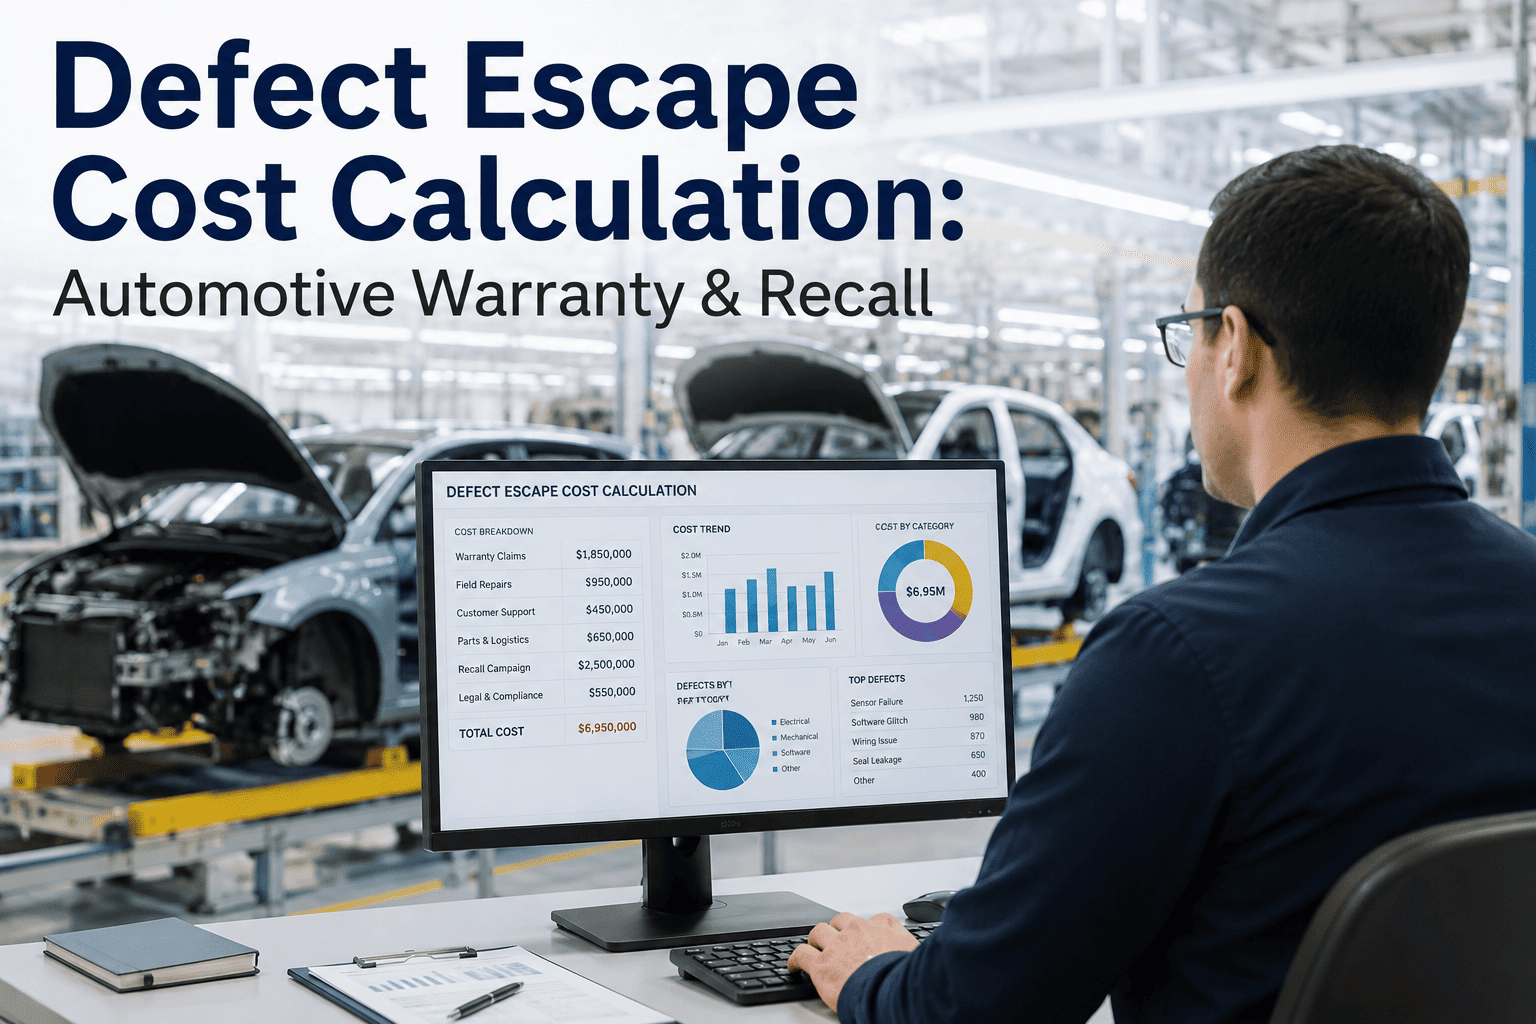
Warranty already eats roughly 1.5 to 2.5 percent of annual revenue for most OEMs and their suppliers, and one automaker alone recently reported paying $5.83 billion in warranty claims in a single year, a 22 percent jump from the year before. That number is not primarily a story about vehicles breaking — it's a story about how long it takes a manufacturer to notice a defect is spreading before the claims start piling up. Traditional warranty systems were built to process claims after they arrive, not to predict which components are trending toward failure while there's still time to intervene. Warranty analytics flips that sequence, correlating early field data against production parameters so quality teams see the pattern before it becomes a bill. Book a demo to see that correlation running against your own claims data.
Automotive Warranty Analytics & Field Failure Prediction
Every warranty claim traces back to a defect that reached a customer instead of being caught at the source. This guide covers how predictive warranty analytics identifies at-risk vehicle populations early, and how correlating field data with production data turns warranty from a cost center into an early-warning system.
Why Traditional Warranty Management Only Sees Problems After They're Expensive
A conventional warranty system exists to process claims — intake the paperwork, verify coverage, pay the dealer or repair facility, and close the file. That workflow is necessary, but it is fundamentally reactive: by the time enough claims accumulate for a pattern to be visible in a monthly report, the affected vehicle population has usually grown far beyond what it would have been if the trend had been caught at the first handful of claims. Predictive warranty analytics, sometimes called Warranty Analytics 2.0, integrates sales data, warranty data, and reserve information with customer, product, supplier, and geographical context specifically to accelerate that detection window.
The shift matters most for components that fail slowly rather than catastrophically — a bearing that wears prematurely, a sensor that drifts out of calibration, a seal that degrades faster than spec under certain climate conditions. These failure modes generate a rising trickle of claims long before they become an obvious spike, and a rising trickle is exactly the kind of pattern that statistical models are good at catching early and human report review tends to miss until it's already a real problem.
Connecting Field Failures Back to Production Parameters
What Comes Back From the Field
Dealer service records, diagnostic trouble codes, customer complaints, and formal claims — each tagged with VIN, mileage, time in service, and the specific component or system involved.
What's Already in Production Data
Build date, plant, line, shift, supplier lot, process parameters at the time of assembly, and any inspection or test results recorded for that specific VIN.
What the Correlation Reveals
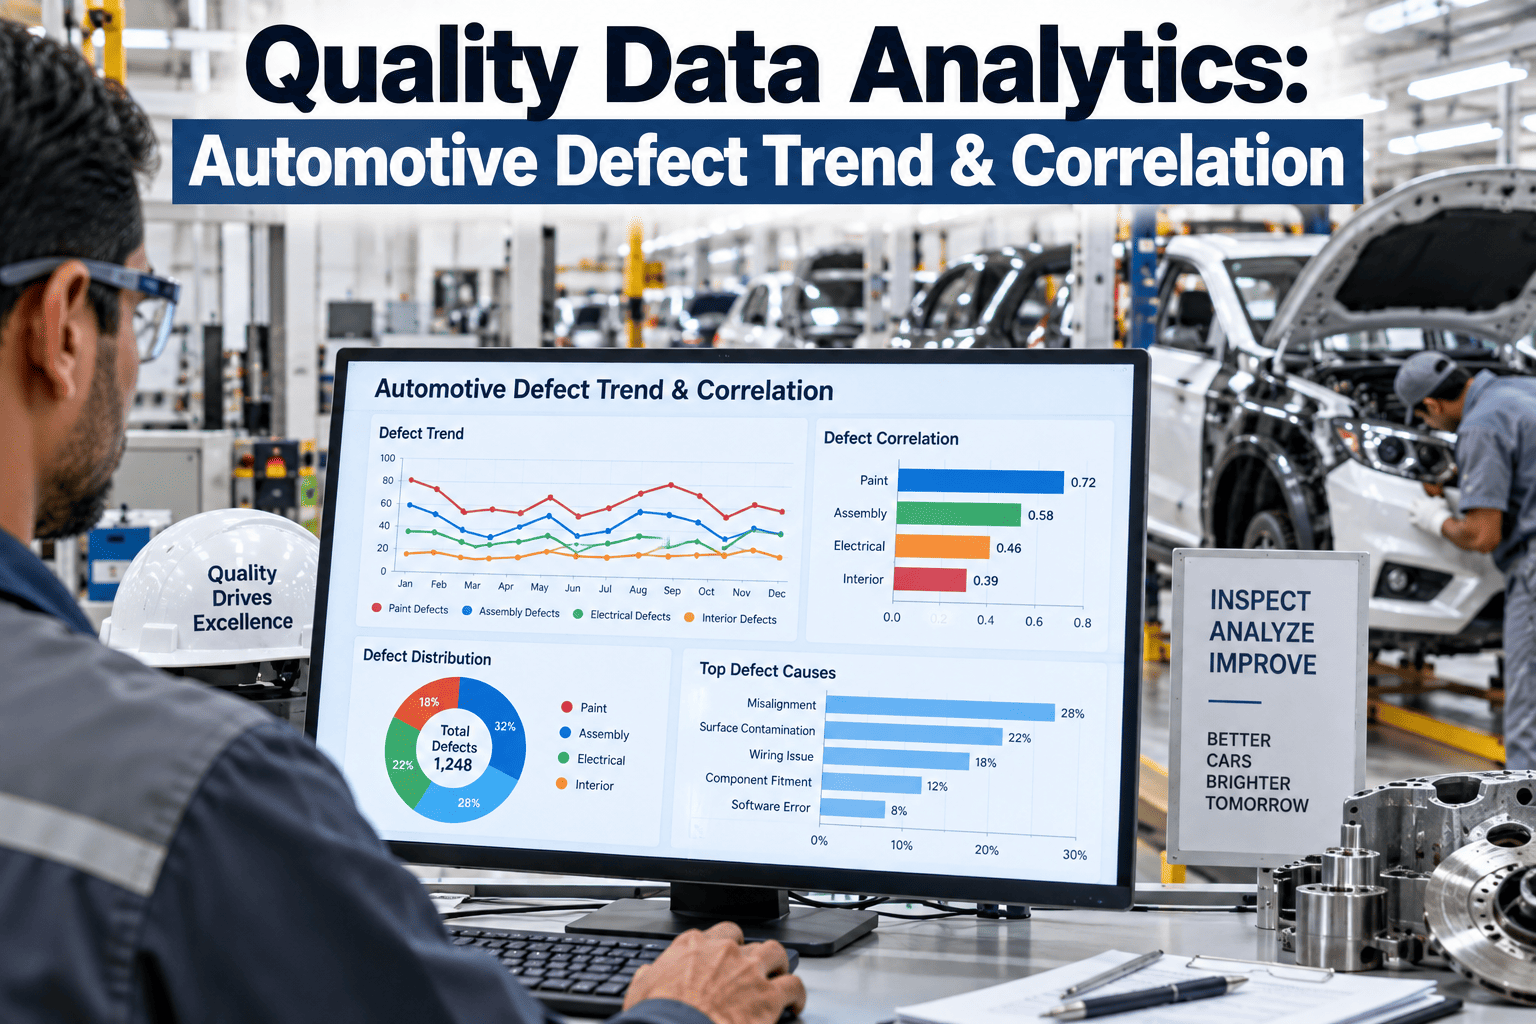
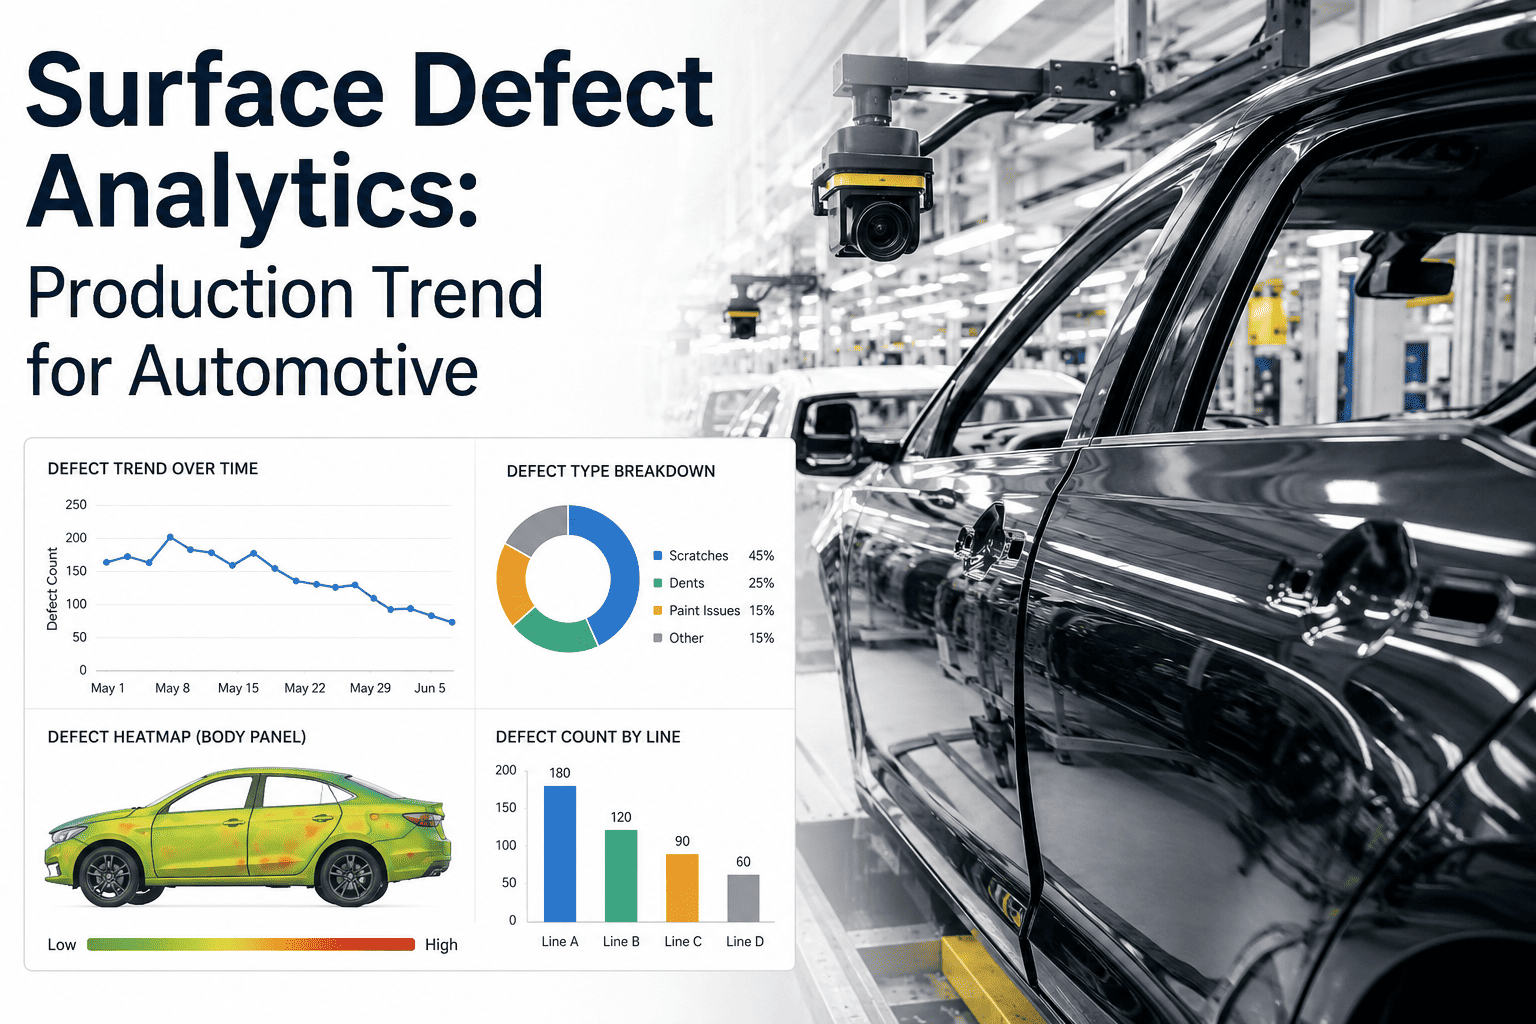
When failures cluster around a specific build window, supplier lot, or process parameter range, that cluster is the early warning — often visible well before the raw claim count alone would raise a flag.
This correlation is only possible when VIN-level production records are retained and connected to field data through a shared identifier, which is why warranty analytics maturity is closely tied to an organization's broader traceability and genealogy discipline. A plant that cannot answer "which supplier lot went into this VIN" cannot meaningfully narrow a failure investigation, no matter how sophisticated the statistical model on the warranty side.
Trend Field Failures Back to Their Production Source
iFactory AI links warranty and field data directly to build-level production parameters, so a rising claim pattern points to a specific plant, line, or supplier lot instead of a vague trend line.
Core Capabilities of a Predictive Warranty Analytics Program
Component Failure Rate Trending
Detects when a specific component begins failing at a higher-than-expected rate across a model year or production run, flagging it while the affected population is still small.
Warranty Reserve Prediction
Forecasts warranty reserve requirements based on sales volume, product mix, and historical claims rates, giving finance and quality teams a shared, data-driven basis for reserve decisions.
Supplier Performance Correlation
Identifies which component suppliers are associated with elevated field failure rates, feeding directly into supplier quality scorecards and containment decisions.
Engineering and Design Input
Prediction-based early warning of emerging issues feeds timely input back into vehicle design and engineering, closing the loop between field performance and the next model-year design.
Industry Perspective on Predictive Warranty Analytics
Every warranty team I've worked with can tell you what happened last month. Very few can tell you what's about to happen next month, and that gap is the whole ballgame financially. The organizations getting real value out of predictive analytics aren't the ones with the fanciest model — they're the ones who solved the boring problem first, which is making sure a field claim can actually be traced back to a build date, a plant, and a supplier lot. Without that connective tissue, the analytics is just describing trends in claims data. With it, you can point to a specific three-week production window and say that's where this is coming from, and that's the difference between a warranty report and an early warning system.
Common Questions About Warranty Analytics and Field Failure Prediction
Turn Field Data Into an Early Warning System
See how iFactory AI connects your warranty and field data to production parameters, giving your quality team a lead indicator instead of a monthly claims report.