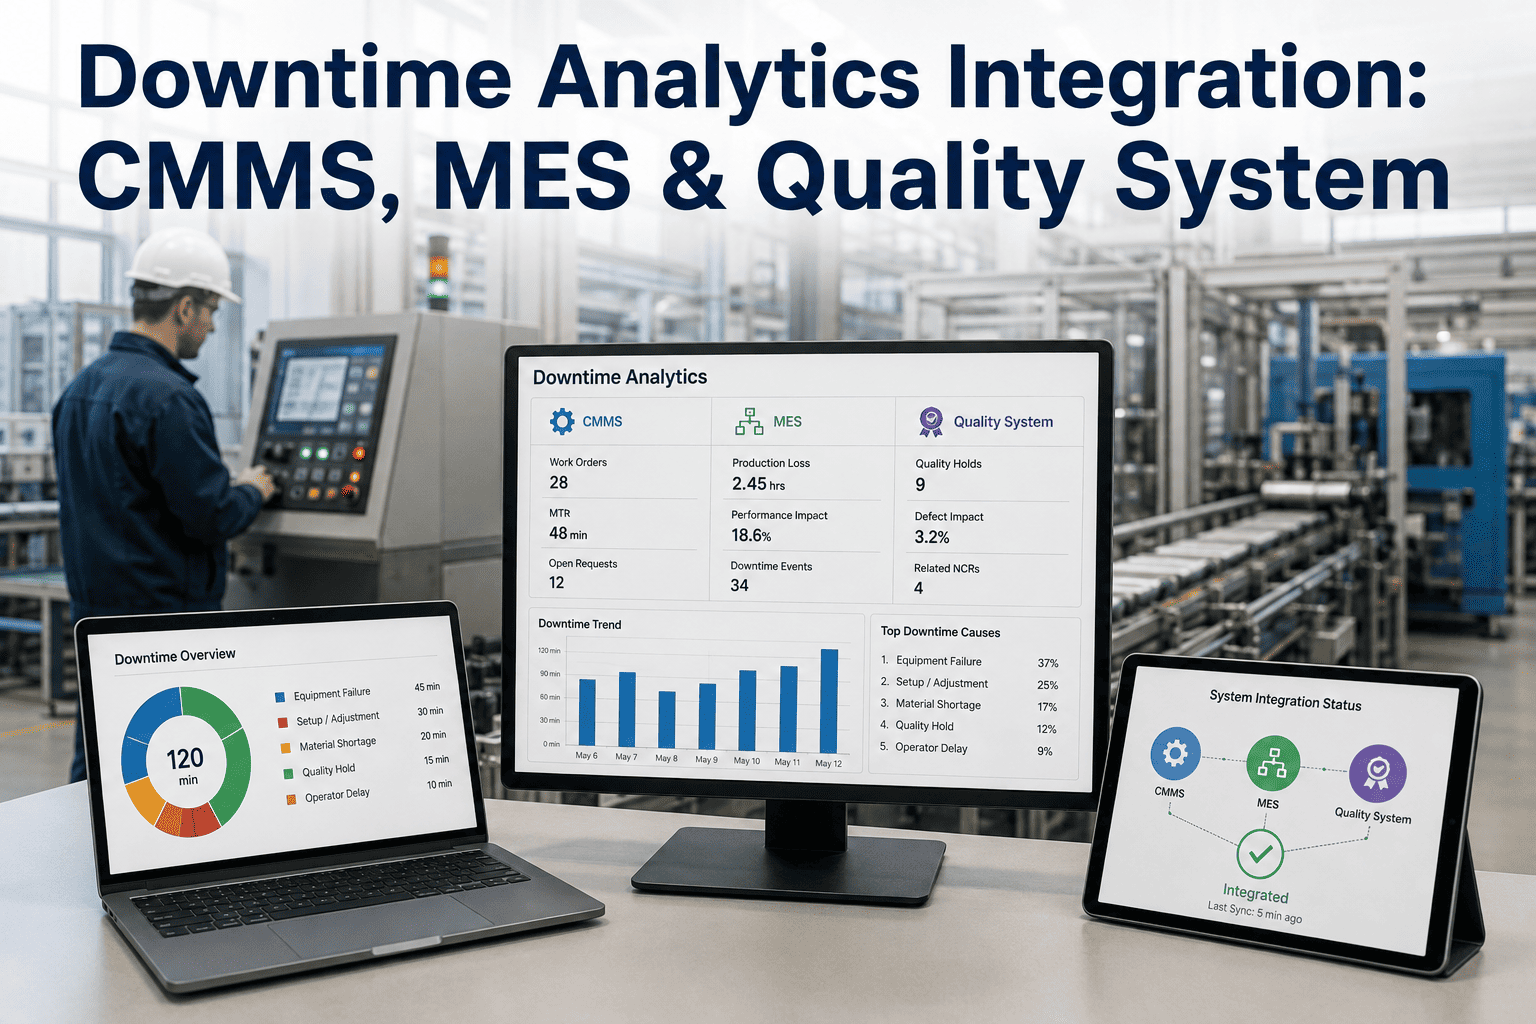
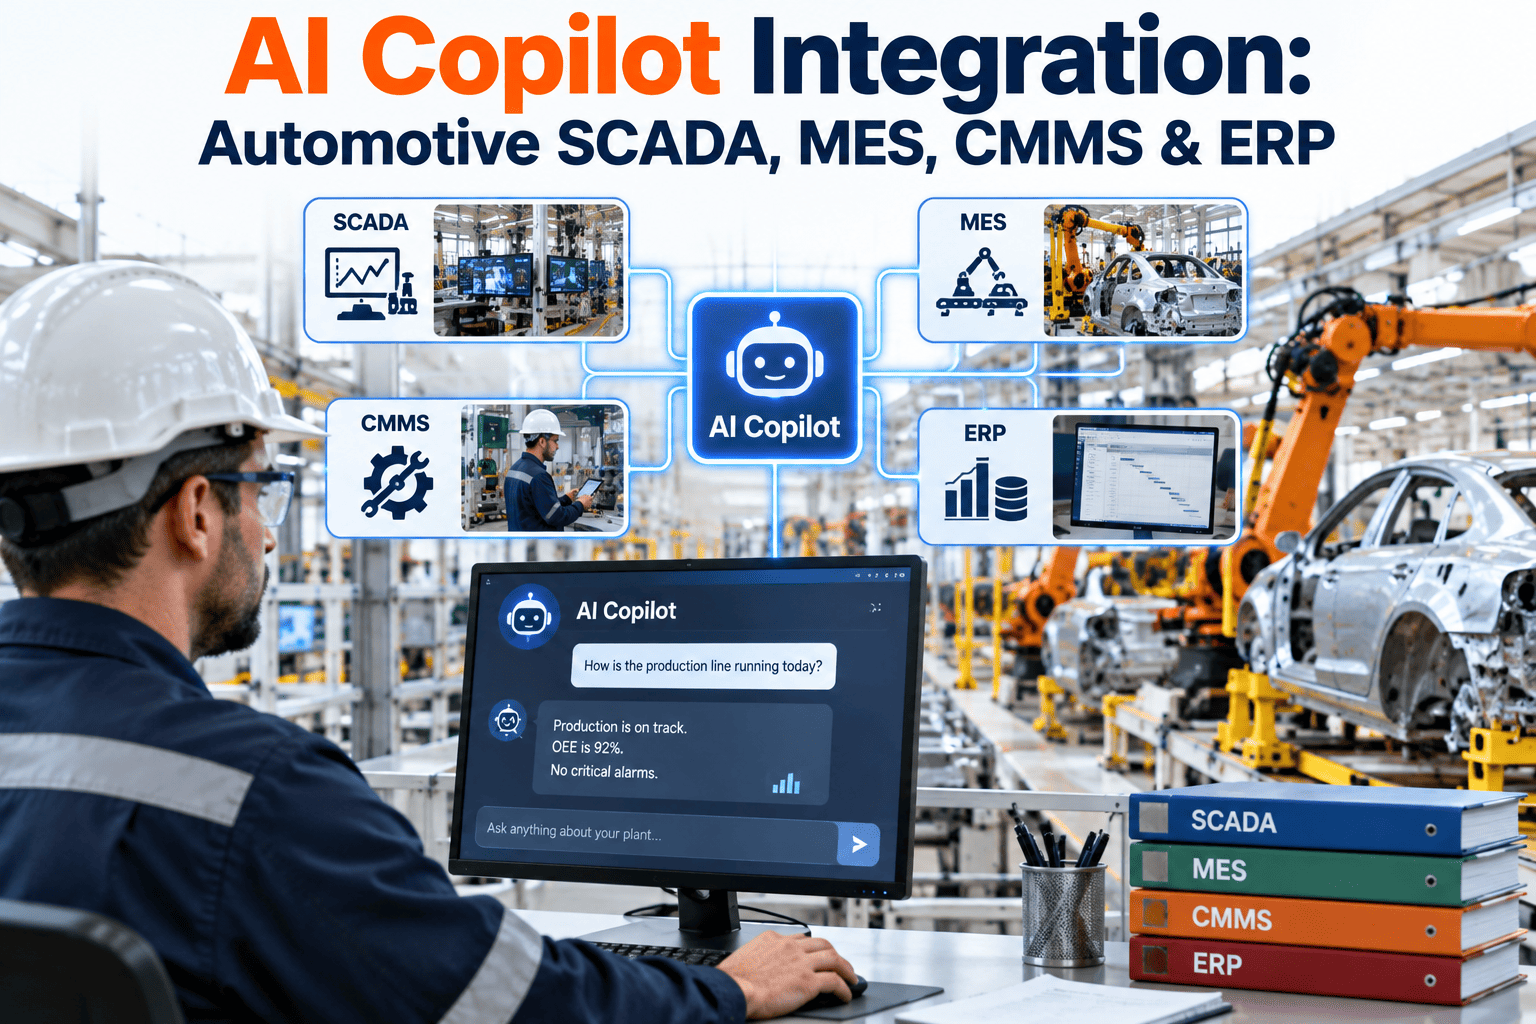
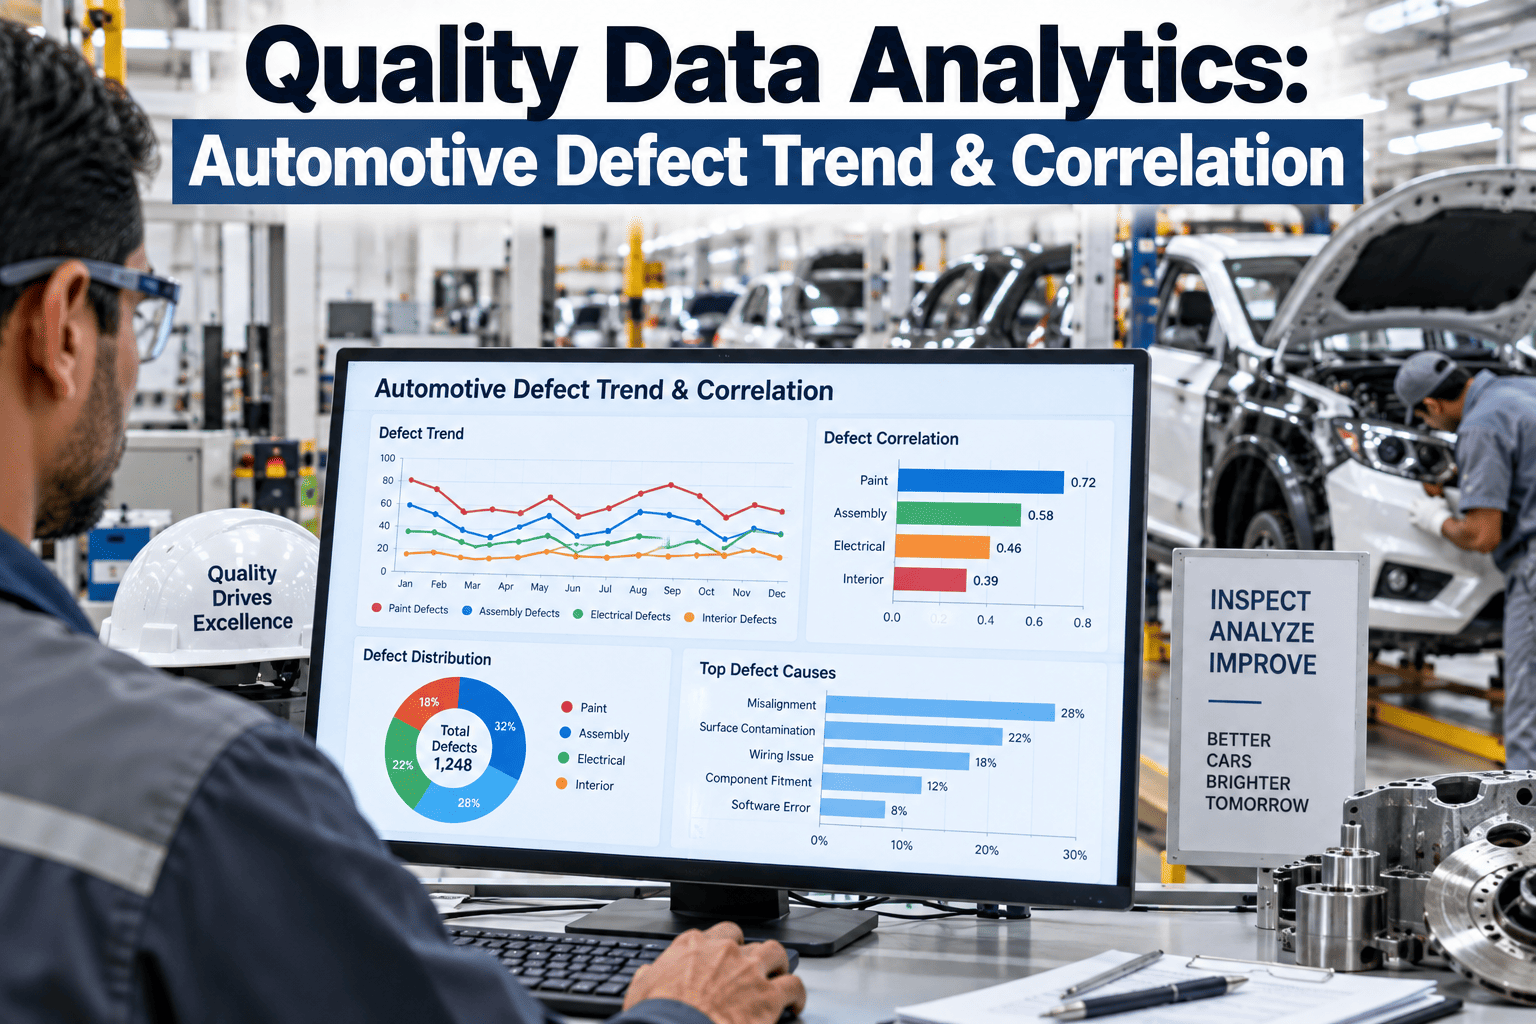
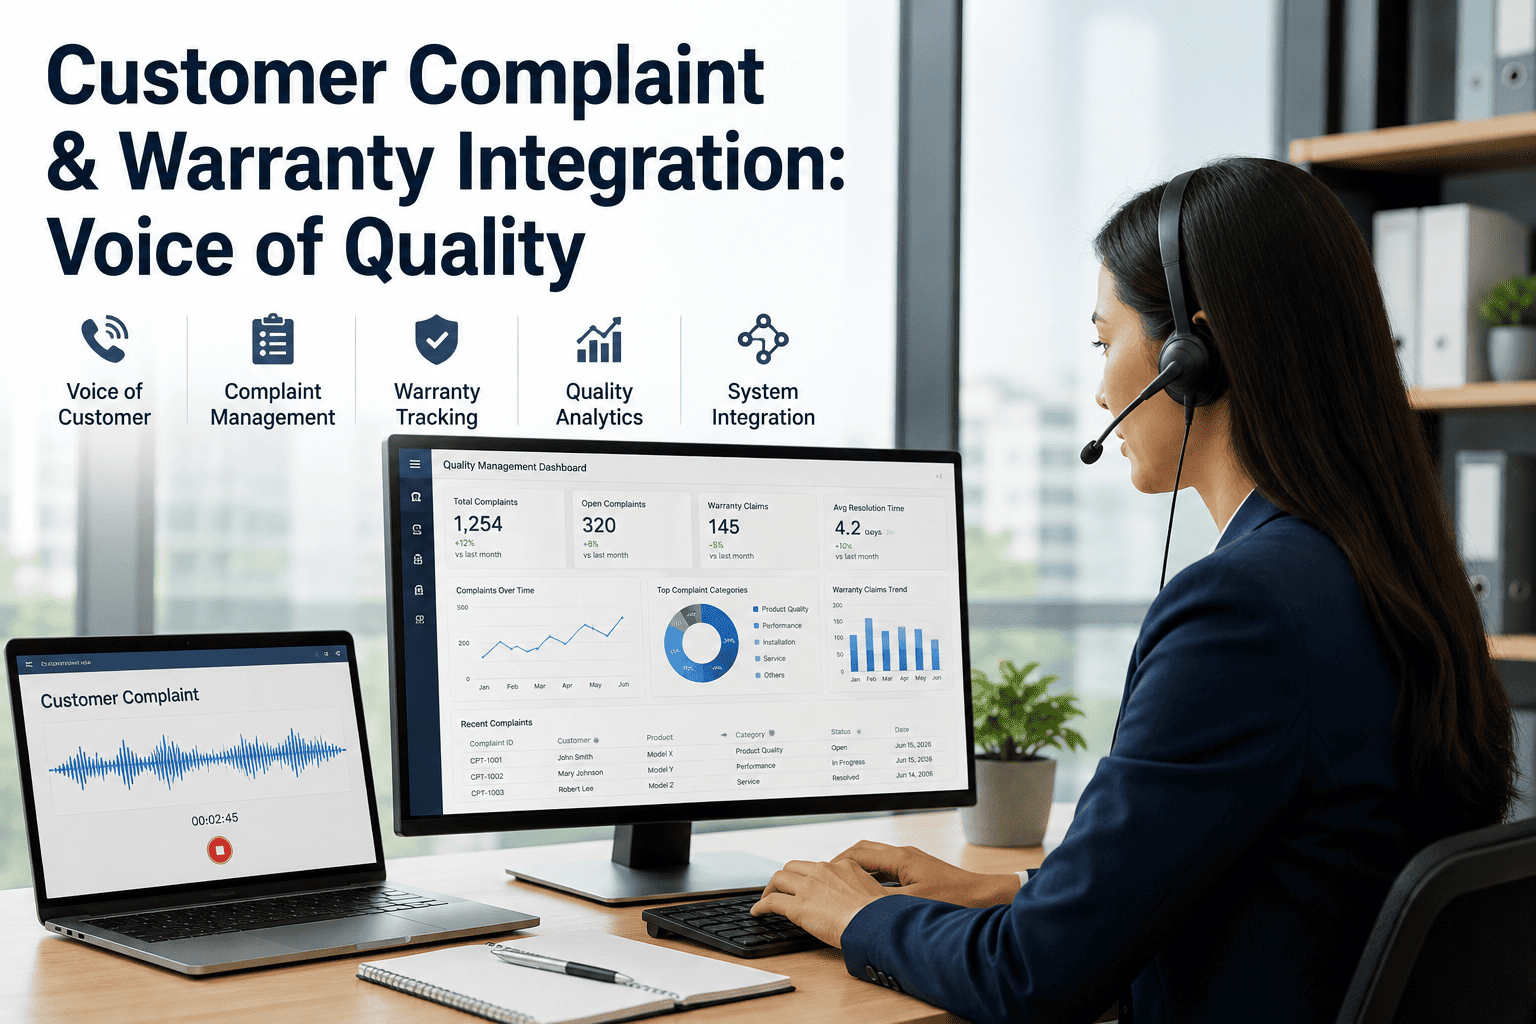
Downtime data sitting alone in a CMMS tells you a machine stopped and for how long, but it cannot tell you whether that stoppage correlates with a quality escape three stations downstream, or whether the same fault code keeps appearing right before a specific production run type on the MES side. The real diagnostic value shows up only when maintenance, production, and quality data are read together, because most recurring reliability problems leave a trail across all three systems, not just one. iFactory connects these systems so downtime events are automatically cross-referenced against production and quality context, and you can book a demo to see your own systems correlated this way.
DOWNTIME ANALYTICS · CMMS, MES & QUALITY INTEGRATION
The Root Cause Is Rarely Visible From One System Alone
iFactory connects downtime analytics with your CMMS, MES, and quality systems so every stoppage is automatically read alongside production context and quality outcomes, not analyzed in isolation.
CMMS
↔
Downtime Analytics
↔
MES / Quality
THE PROBLEM WITH SEPARATE SYSTEMS
Three Systems, Three Partial Pictures of the Same Problem
Maintenance teams live in the CMMS, production teams live in the MES, and quality teams live in their own inspection or SPC system, and each group can genuinely explain their own slice of an event without ever seeing how it connects to the others. A recurring downtime event that always follows a particular changeover, or a quality drift that always follows a specific maintenance intervention, is invisible until someone manually cross-references timestamps across three separate exports, which happens rarely and only after a problem has already become expensive.
3 systems
CMMS, MES, and quality data typically live in separate platforms
Manual
Cross-referencing usually happens only after a problem becomes visible
Delayed
Root cause identification lags well behind the recurring symptom
WHAT GETS CORRELATED
Reading Downtime Events Alongside Production and Quality Context
Downtime + Changeover Type
Identify whether specific product or tooling changeovers consistently precede a stoppage type.
Downtime + Quality Escapes
Check whether a maintenance event correlates with a quality shift in the runs immediately following it.
Maintenance History + Fault Recurrence
Compare repair history against fault code recurrence to catch a fix that did not actually resolve the root issue.
Shift and Schedule + Downtime Pattern
Surface whether specific shifts, schedules, or operators correlate with different downtime frequency for the same asset.
See Your Systems Correlated, Not Just Connected
iFactory shows how a downtime event on your line actually connects to production and quality outcomes across your existing systems.
HOW THE INTEGRATION WORKS
Connecting Systems Without Replacing Them
1
Connect existing data sources from your CMMS, MES, and quality systems through their available interfaces, without requiring a platform migration.
2
Align on a shared timeline so events from all three systems are timestamped consistently and can be compared directly.
3
Surface correlations automatically instead of relying on someone to manually notice a pattern across separate reports.
4
Present unified views by asset or line so a maintenance planner sees quality and production context alongside downtime history in one place.
WHAT CHANGES ONCE SYSTEMS ARE CONNECTED
From Isolated Reports to a Shared Diagnostic View
| Question |
Separate Systems |
Integrated View |
| Did this repair actually fix the root cause? |
Checked only if someone remembers to look later |
Fault recurrence tracked automatically against repair history |
| Does this downtime affect downstream quality? |
Requires manually cross-referencing two separate exports |
Quality outcomes linked to downtime events automatically |
| Is this a recurring pattern or a one-off? |
Pattern recognition depends on individual memory |
Recurrence surfaced across the full connected history |
WHO BENEFITS FROM INTEGRATED ANALYTICS
Teams That Depend on Cross-System Context
Reliability Engineers
See whether a repair pattern is truly resolving a fault or masking a recurring root cause.
Quality Managers
Trace a quality shift back to a specific maintenance event or changeover without manual investigation.
Production Planners
Understand which changeover types carry a higher downtime risk before scheduling them.
Plant Managers
Get one connected view of reliability instead of reconciling three separate departmental reports.
FREQUENTLY ASKED QUESTIONS
What Teams Ask Before Connecting Their Systems
Do we need to replace our current CMMS or MES to use integrated analytics?
No, integration connects to your existing systems through their available data interfaces rather than requiring a platform replacement, so your maintenance and production teams continue working in the tools they already know while the correlation happens in a connected analytics layer above those systems.
Book a demo to see how your specific systems would connect.
How is data kept consistent when timestamps or naming conventions differ across systems?
Each system's data is mapped to a shared reference during setup, including asset naming and timestamp alignment, so an event in the CMMS and a corresponding entry in the MES are recognized as related even if the two systems recorded them slightly differently. This mapping is validated against known historical events before going live.
Contact our support team to review your current naming conventions.
Can this identify correlations we would not have thought to look for manually?
Yes, because the connected data is reviewed continuously rather than only when a team member happens to compare two reports, correlations that would take significant manual effort to notice, such as a downtime pattern tied to a specific shift and changeover combination, surface automatically as the data accumulates.
Book a demo to see example correlations from a similar plant.
How long does it take to see meaningful correlations after systems are connected?
Some correlations, particularly ones tied to well-documented recurring events, can surface almost immediately once historical data is connected, while others depend on accumulating enough new data to establish a reliable pattern, so value builds progressively rather than requiring a long wait before anything useful appears.
Contact our support team to discuss a realistic timeline for your data volume.
Who typically owns this integrated view across maintenance, production, and quality teams?
Ownership varies by plant, but the integrated view is designed to be useful to all three groups simultaneously, with role-specific access so a maintenance planner and a quality manager both see the connected context relevant to their own decisions without needing to request a custom report from another department.
Book a demo to see role-based views for your teams.
Stop Solving the Same Problem Three Times in Three Systems
iFactory connects your CMMS, MES, and quality data so the real correlation is visible the first time, not after months of recurrence.