Most supplier scorecards get updated quarterly, pulling together PPM defect rates, on-time-in-full delivery percentages, and cost performance into a single summary that drives a quarterly business review and, occasionally, a sourcing decision. The problem with this cadence is that it treats supplier performance as something to look back on rather than something to actually manage in real time, which means a supplier's quality can be sliding for two and a half months before the next scorecard cycle even reflects it. An AI-driven scorecard changes that by continuously recalculating supplier performance as new data arrives and layering in predictive trending, so a scorecard review isn't just a look back at last quarter, it's a forward-looking read on where a supplier relationship is actually headed. This page covers how a predictive scorecard differs from a traditional quarterly rollup, what metrics belong in a well-built scorecard, and how to use trending data to have better strategic conversations with suppliers before a relationship reaches a crisis point. You can book a demo to see how iFactory builds continuously updated, predictive supplier scorecards.
A Supplier Scorecard That Predicts Where a Relationship Is Headed, Not Just Where It's Been
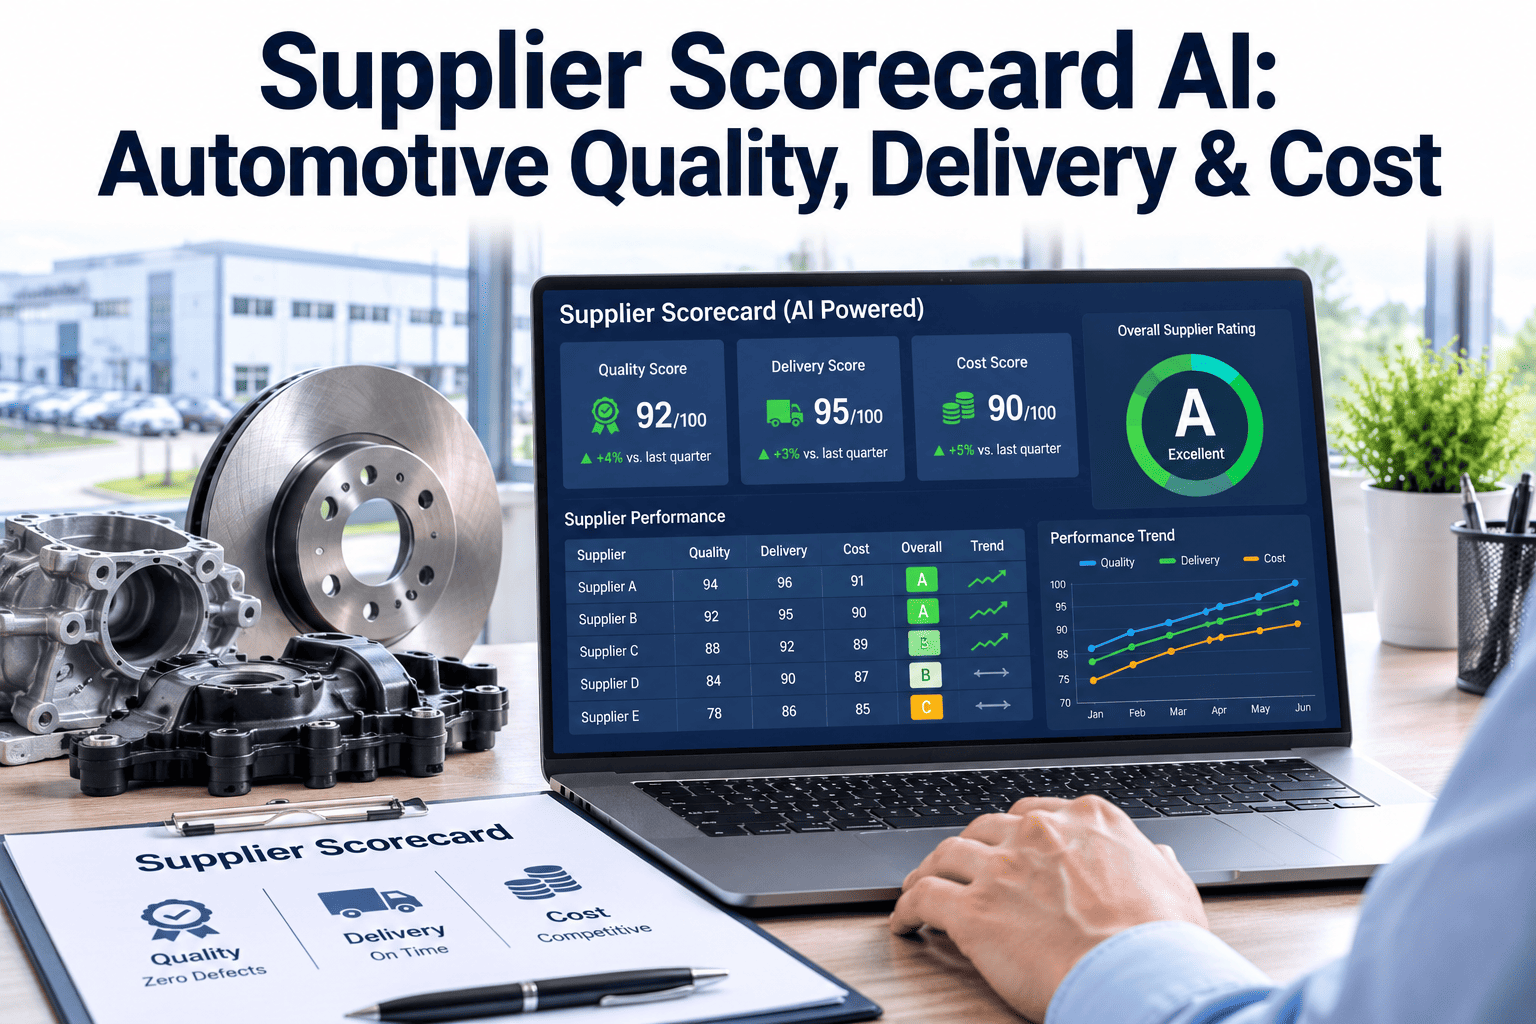
iFactory continuously recalculates quality, delivery, and cost performance and layers in predictive trending, so scorecard reviews inform strategic decisions before problems compound.
A Score Calculated Every Three Months Reflects a Moving Target Poorly
A quarterly scorecard is a reasonable format for a formal business review, but it's a poor tool for actually managing supplier performance in real time, since the underlying performance it's summarizing has usually already shifted by the time the scorecard gets calculated, reviewed, and acted on. A supplier whose quality begins declining in the first week of a quarter won't show up as a meaningfully changed score until the quarter closes, and by the time that scorecard is reviewed and a corrective action request goes out, the supplier may already be two to three months into a declining trend that could have been caught and addressed far earlier.
- Score reflects performance from months ago
- Corrective action requests lag actual issue onset
- No forward-looking view of where trends are headed
- Business review conversations are retrospective
- Score updates as new data arrives throughout the quarter
- Declining trends flagged while still developing
- Predictive trending shows likely trajectory, not just history
- Business reviews focus on what's ahead, not just what's past
The Metrics That Actually Predict Supplier Risk
A scorecard packed with too many metrics becomes hard to act on, while one that's too narrow misses important dimensions of supplier performance. Most well-built automotive supplier scorecards converge on a manageable set of metrics across three categories, each weighted according to how directly it affects production continuity and downstream cost.
Parts per million defective is the standard baseline metric, but escape rate, the share of defects that reach the assembly line or field rather than being caught at receiving, adds important context about inspection effectiveness alongside raw defect count.
On-time-in-full delivery rate captures whether shipments arrive complete and as scheduled, while lead time variance captures how consistent and predictable that performance is over time, which matters as much as the average itself for production planning.
Cost performance against negotiated targets is the obvious baseline, but including warranty claim exposure tied back to that supplier's components gives a fuller picture of the true cost impact beyond the piece price alone.
What "Predictive" Actually Means for a Scorecard
Predictive trending on a supplier scorecard doesn't mean claiming to know the future with certainty, it means applying the same kind of trend analysis to supplier metrics that quality engineers already apply to process control charts, looking for runs of consecutive periods moving in one direction, rate of change, and deviation from a supplier's own historical baseline, rather than only comparing the current period against a fixed target.
Tracking not just whether a metric is above or below target, but how quickly it's moving and in which direction over recent periods.
Comparing current performance against that specific supplier's own historical norm, since a good supplier having a bad month reads differently than a chronically marginal one.
Watching for early signals, such as a rising minor non-conformance rate, that have historically preceded a larger quality or delivery issue for that supplier or category.
Classifying suppliers not just by current score but by trajectory, so a supplier trending downward gets flagged for proactive review even while still scoring within an acceptable range.
From Reporting Tool to Relationship Management Tool
A scorecard that only exists to generate a quarterly report tends to become a compliance exercise rather than a genuinely useful management tool. The more valuable use of scorecard data is as an ongoing input to sourcing decisions, capacity planning, and supplier development investment, treating the scorecard as a live signal that shapes strategy rather than a retrospective grade that gets filed away after the quarterly review meeting ends.
Suppliers showing consistent positive trending across quality and delivery metrics are natural candidates for expanded volume or new program awards, while suppliers showing a sustained downward trend, even if their current absolute score hasn't yet crossed an alarming threshold, are candidates for proactive engagement before the relationship reaches a point where corrective action becomes adversarial rather than collaborative. Framing the scorecard conversation around trajectory, "here's where your performance is headed if current trends continue," tends to produce more productive supplier conversations than a conversation anchored purely on a static quarterly grade.
Applying Different Rigor Based on Supplier Risk Category
Not every supplier warrants the same level of scorecard granularity or review frequency, and applying uniform scrutiny across a supplier base that ranges from single-source safety-critical component makers to commodity fastener suppliers wastes analytical effort where it matters least while potentially under-resourcing the suppliers where a problem would be most damaging. A tiered approach, matching monitoring intensity to supplier criticality, tends to produce a more sustainable and effective program.
Continuous monitoring with the tightest trend thresholds, frequent trajectory review, and proactive engagement triggered by even modest declining trends given the outsized production and safety risk involved.
Regular trend monitoring with moderate thresholds, since alternate sourcing options reduce the production risk somewhat compared to single-source components.
Periodic scorecard review at a standard quarterly cadence is often sufficient, reserving continuous monitoring resources for the higher-risk tiers where it delivers the most value.
This tiering also affects how corrective action requests are handled when a trend is flagged. A Tier 1 supplier showing a declining trend warrants immediate escalation and a formal review, while the same magnitude of decline from a Tier 3 supplier might simply be noted for the next standard quarterly review rather than triggering an urgent response, reflecting the proportionally lower risk to production continuity.
Building a Predictive Scorecard Program Step by Step
Confirm incoming inspection, delivery, and cost data are captured consistently enough to feed a continuously updated scorecard rather than only a quarterly manual rollup.
Classify suppliers by production and safety criticality to determine which ones warrant continuous monitoring versus standard periodic review.
Set escalation thresholds proportional to supplier risk tier, so Tier 1 suppliers trigger review at smaller deviations than lower-risk tiers.
Start continuous predictive scorecarding with Tier 1 suppliers to prove value before expanding the approach across the broader supplier base.
Flagging a Delivery Trend Before It Became a Line-Down Risk
A supplier's quarterly OTIF score remained within an acceptable range for two consecutive quarters, masking a gradual month-over-month decline in on-time delivery performance that wasn't severe enough in any single quarter to trigger a formal review under the existing scorecard process.
Continuous trend monitoring flagged the declining trajectory after just six weeks of data, well before the next quarterly review would have surfaced it. A proactive conversation with the supplier revealed a capacity constraint at their facility, and a joint mitigation plan was put in place before the trend reached a level that would have created production risk at the assembly plant.