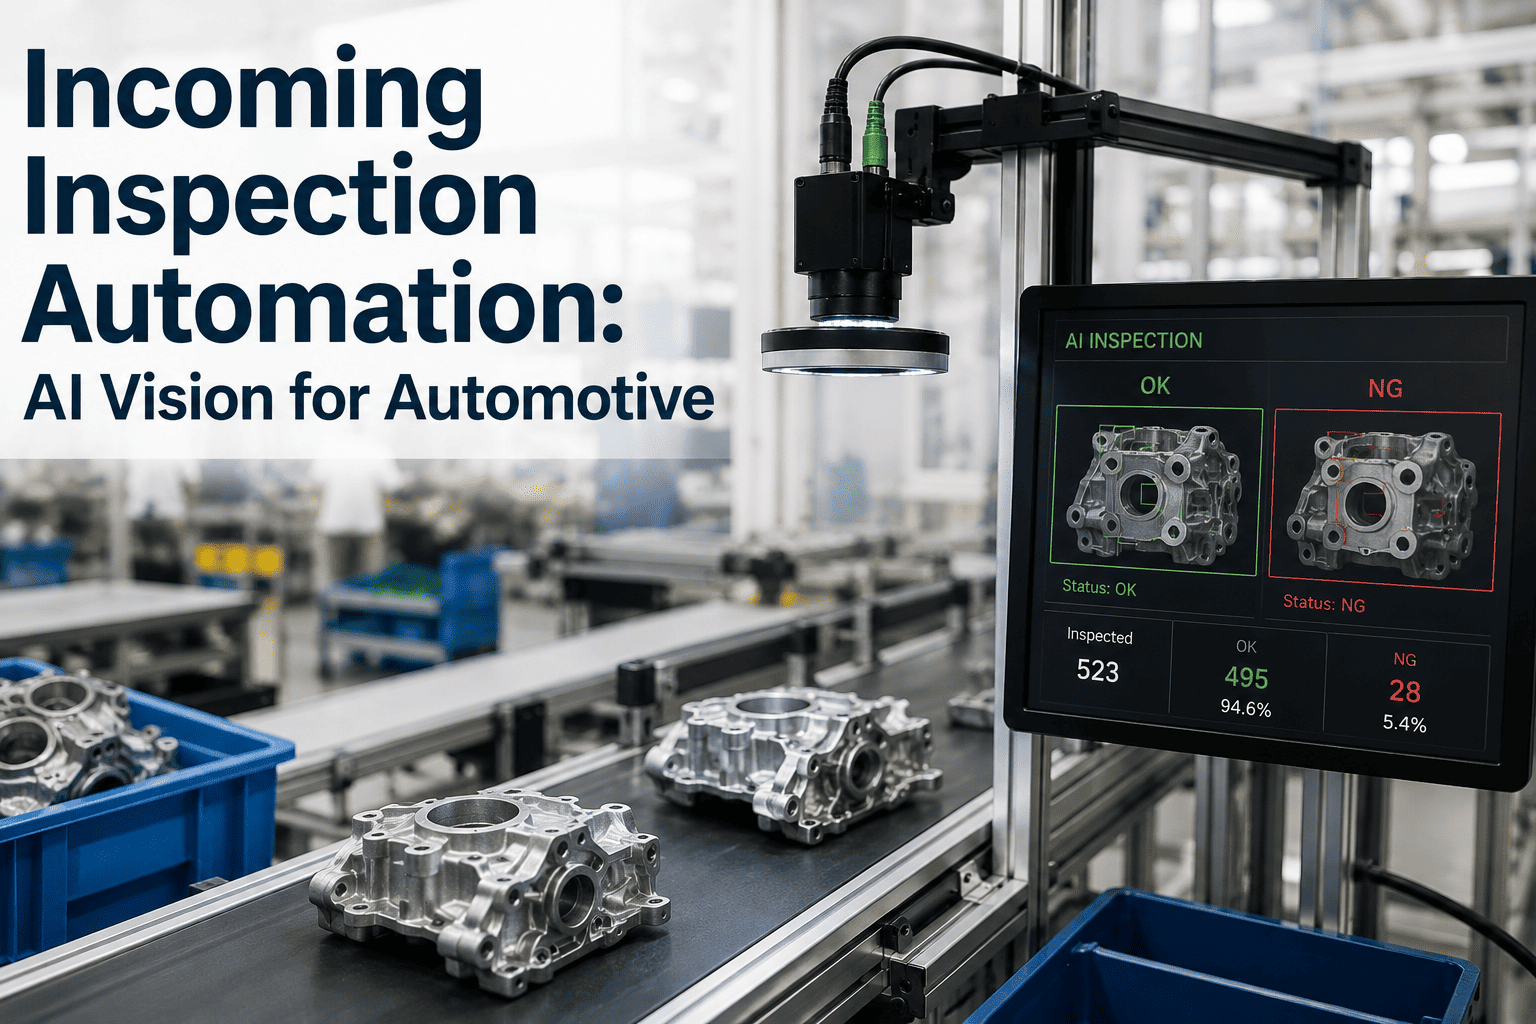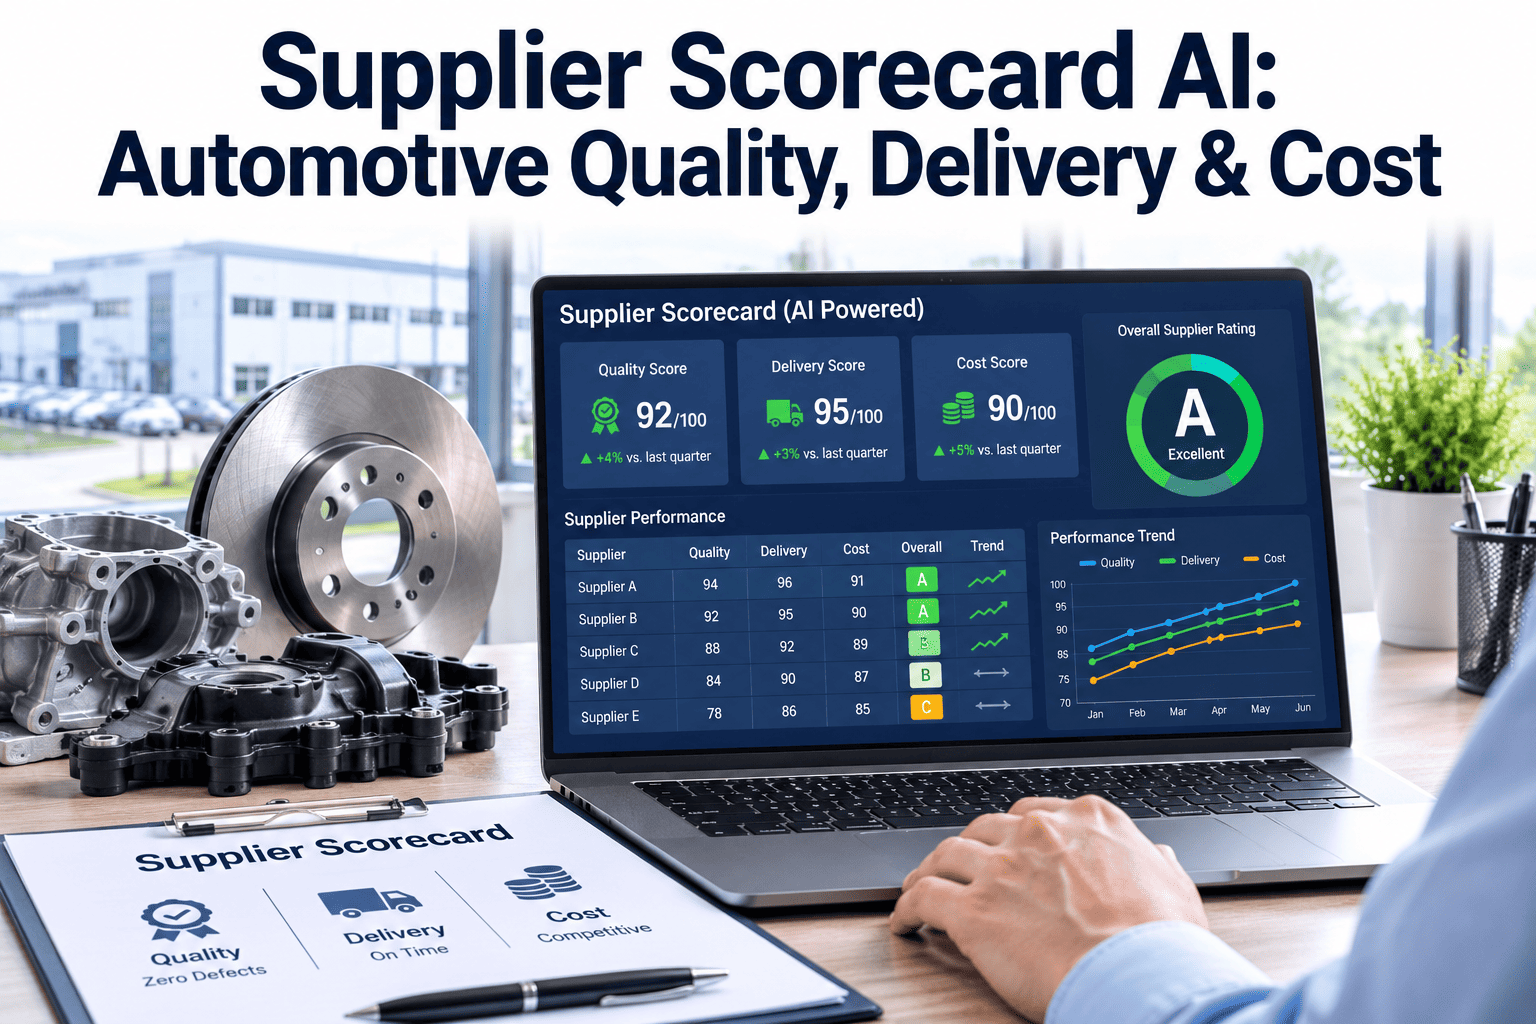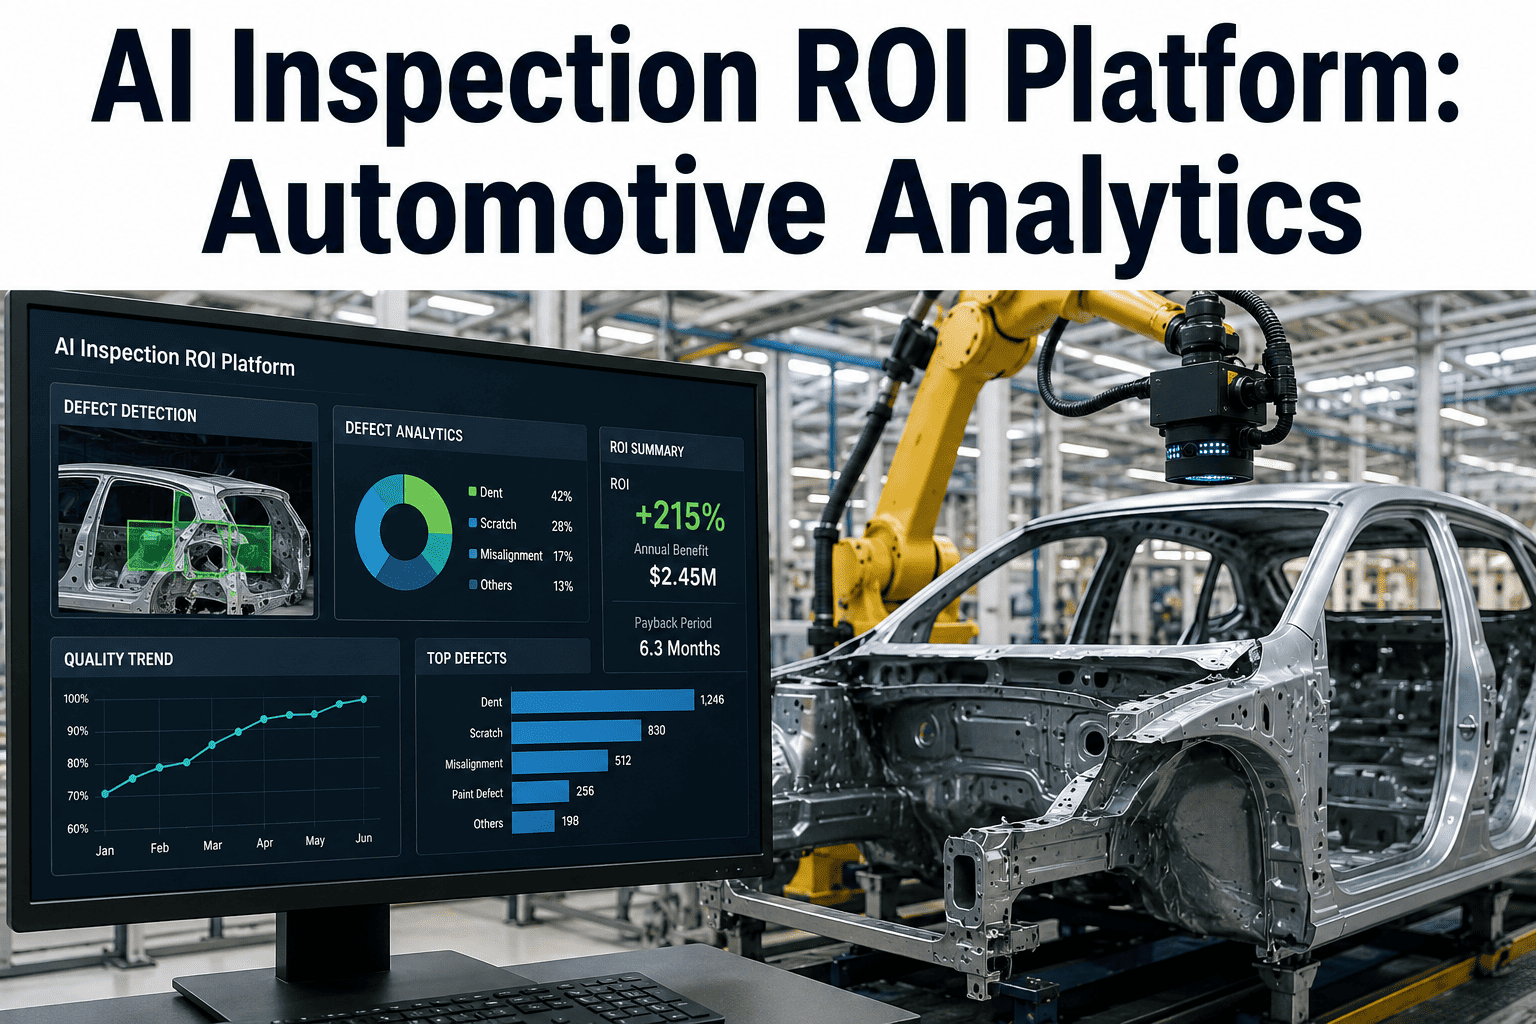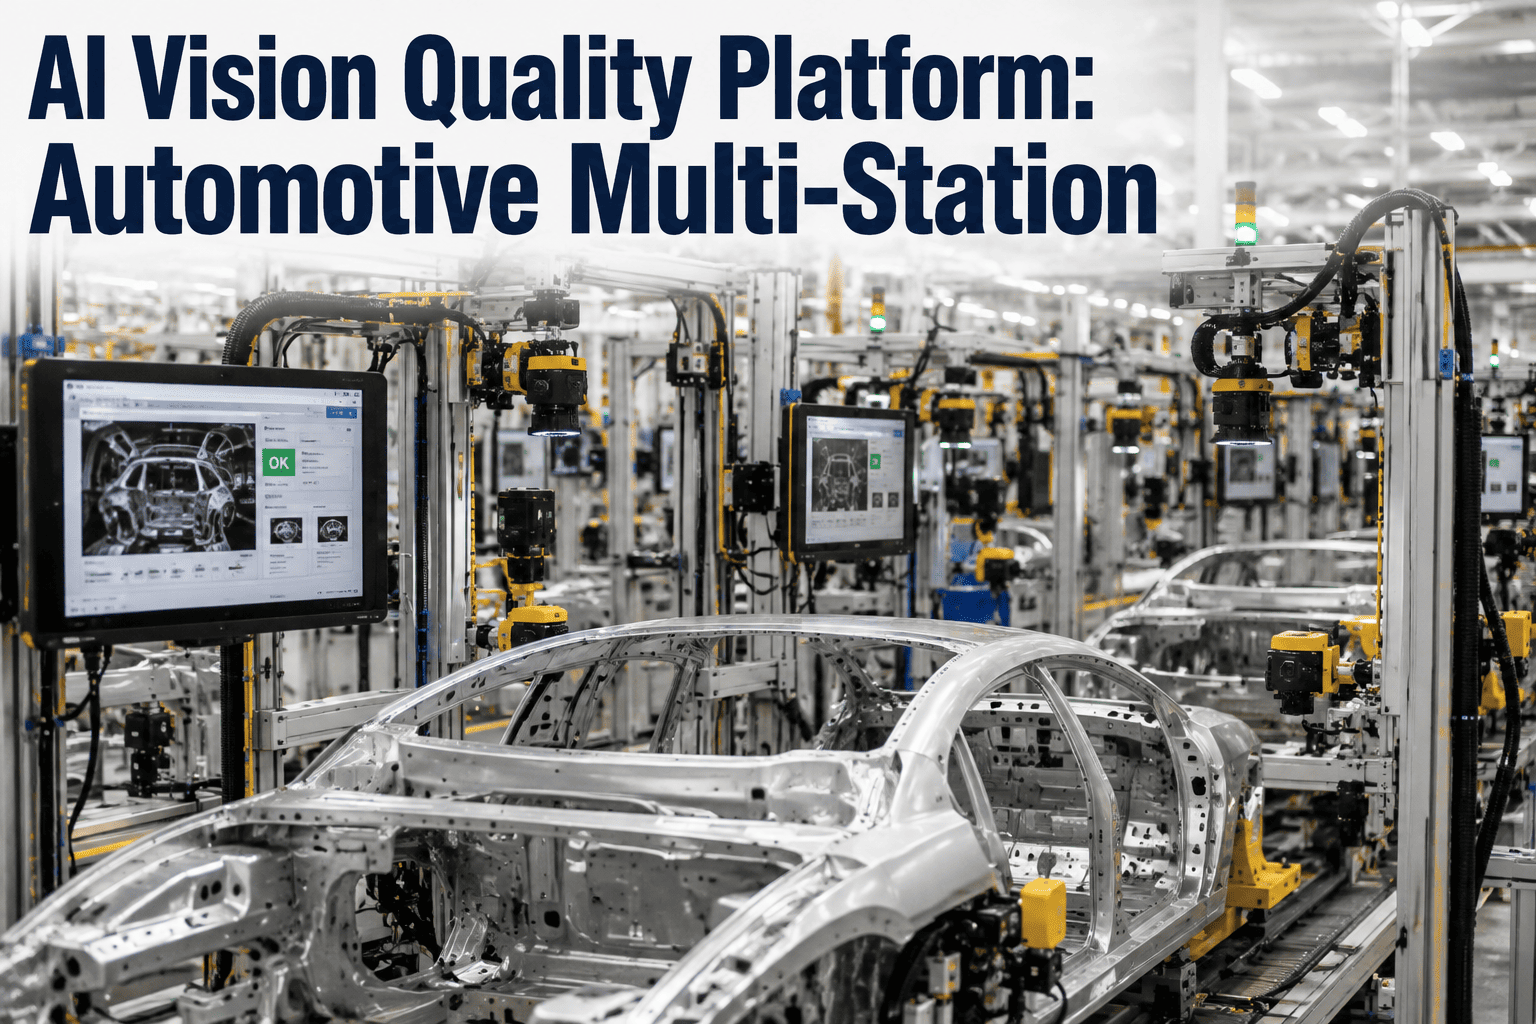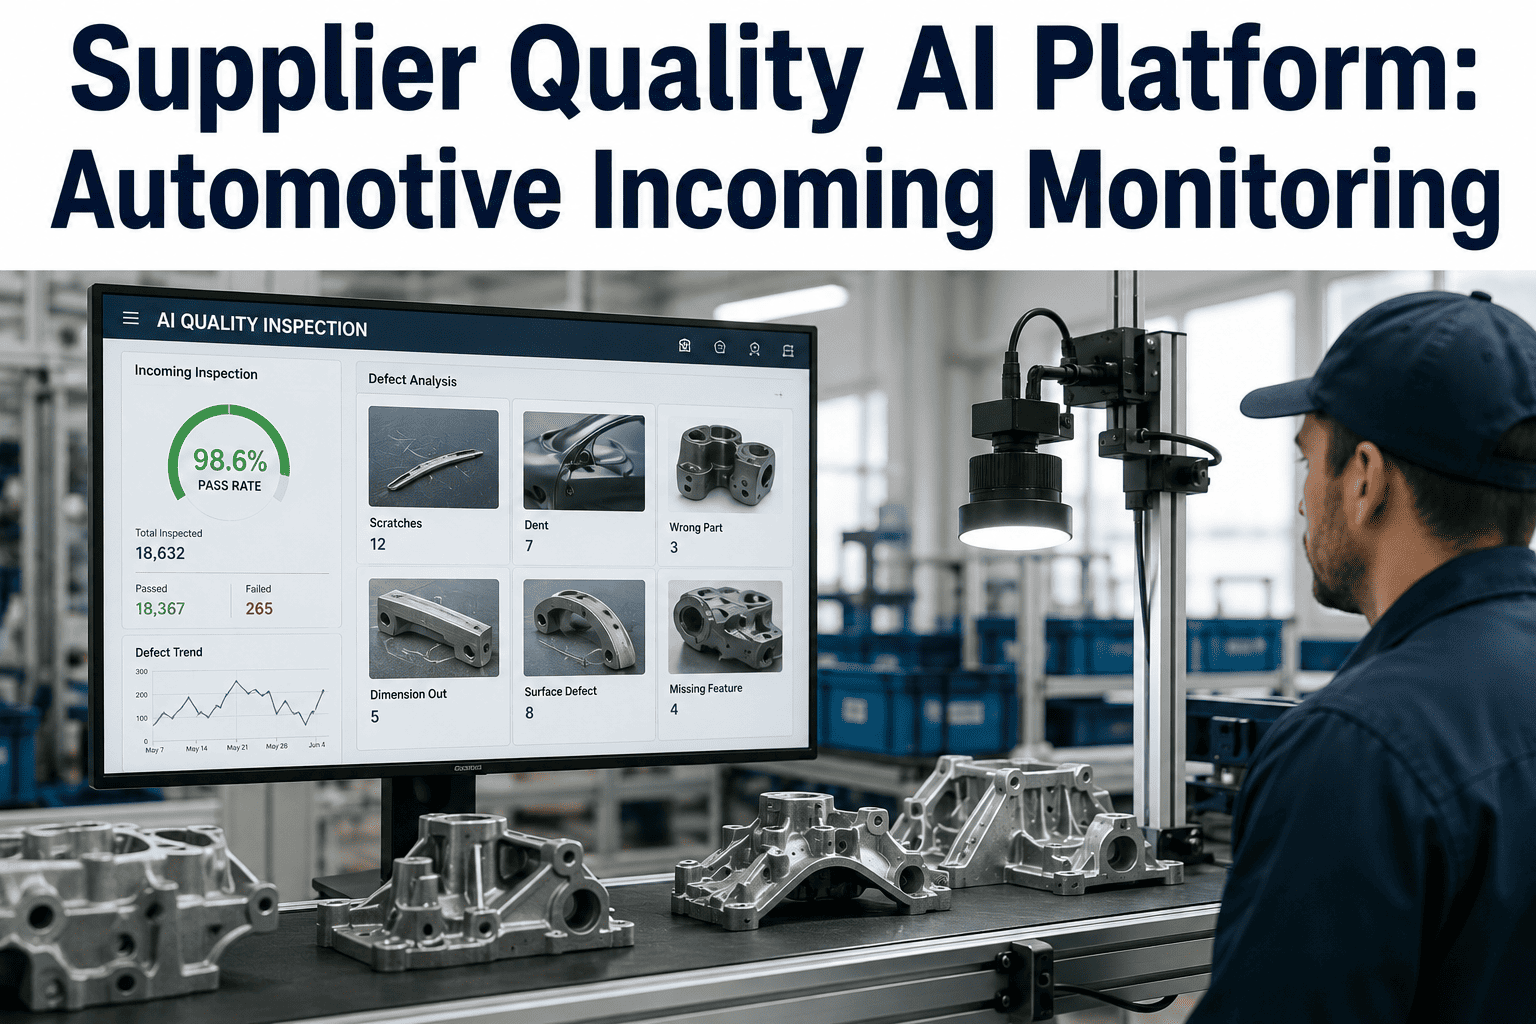
An automotive assembly plant might receive parts from hundreds of suppliers in a single week, and every one of those suppliers has good days and bad days, tooling that wears, and process drift that happens whether or not anyone's watching for it. Traditional incoming inspection relies on sampling a fraction of each shipment and trusting supplier-provided certificates of conformance for the rest, which works fine until a supplier's process shifts between audits and a bad lot slips through into vehicles before anyone notices. An AI platform that continuously monitors incoming inspection results, correlates them across lots and time, and flags emerging trends before they become a containment event gives supplier quality teams a fundamentally different level of visibility than periodic sampling alone can provide. This page covers what continuous supplier monitoring actually looks like, how it differs from traditional audit-based oversight, and how to build a program that scales across a large supplier base without drowning the team in false alarms. You can book a demo to see how iFactory brings incoming inspection data into one continuously monitored view.
Watch Supplier Quality Trends Continuously, Not Just During the Next Scheduled Audit
iFactory correlates incoming inspection results across lots, suppliers, and time, flagging drift before it becomes a containment event or a warranty claim cluster.
Supplier Process Drift Rarely Waits for the Next Scheduled Review
Supplier audits, however well run, are a snapshot of process capability at a single point in time. A supplier can pass an audit with strong process control and then, months later, experience tooling wear, a raw material substitution, or operator turnover that gradually shifts their output quality, all without anything triggering a formal reassessment until the next audit cycle comes around, which might be a year or more away. In the meantime, incoming inspection at the receiving plant is often limited to sampling a fraction of each shipment, which is enough to catch a badly out-of-spec lot but not always enough to catch a slow drift that's still within individual lot tolerance but trending in the wrong direction across many lots.
This combination, infrequent audits and partial sampling, creates a real blind spot. A supplier's quality can drift meaningfully in the gap between formal reviews, and unless someone is watching the trend across every lot that does get inspected, that drift can go unnoticed until it either triggers a containment event on the plant floor or, worse, shows up months later as a warranty claim pattern traced back to a specific supplier lot.
Every Inspection Result Becomes a Data Point in a Trend, Not Just a Pass or Fail
The core shift a continuous monitoring platform makes is treating every incoming inspection measurement as part of an ongoing trend line for that supplier and part number, rather than a standalone pass or fail decision that gets filed away once the lot is accepted. This reframing is what makes it possible to catch drift that stays within individual lot tolerance but is nonetheless moving in a direction that will eventually cross it.
Plots key measurements across consecutive lots from the same supplier, surfacing gradual drift that no single lot inspection would flag on its own.
Benchmarks suppliers producing the same or similar components against each other, highlighting which suppliers are consistently near tolerance limits.
Applies standard process control logic to incoming data, flagging runs of consecutive measurements trending in one direction even before any single point is out of spec.
Links incoming inspection trends to downstream warranty claims by supplier lot, closing the loop between what was measured at receiving and what customers eventually experienced.
Scaling Monitoring Across Hundreds of Suppliers Without Drowning the Team
A platform that flags every minor fluctuation as a potential concern quickly trains a supplier quality team to ignore alerts altogether, which defeats the entire purpose of continuous monitoring. Building a program that scales across a large supplier base requires deliberate thresholds and prioritization logic, not just turning on monitoring for every measurement across every supplier and hoping the team can keep up.
Apply the most sensitive monitoring thresholds to high-volume or safety-critical components, and looser thresholds to low-risk, low-volume parts.
Flag a run of several consecutive measurements moving in one direction rather than alerting on every individual value close to a tolerance limit.
Route high-severity trend breaks to immediate review, while lower-severity trends get bundled into a periodic supplier review rather than an urgent alert.
Periodically review which alerts led to real corrective action and which turned out to be noise, adjusting thresholds accordingly so the system improves over time.
What Actually Goes Into a Continuous Monitoring View
Building a genuinely useful continuous monitoring capability means pulling together several data sources that, in most plants, currently live in separate systems maintained by separate teams. The value comes not from any single source in isolation, but from being able to see them together against the same supplier and lot number.
Measurements from CMM, gauge, or vision-based inspection at receiving, capturing the specific dimensions or characteristics checked on each lot.
Supplier-reported test results and material certifications, useful as a comparison point against independently verified receiving inspection data.
Historical rejections, deviations, and material return authorizations tied to each supplier, providing context for how often issues have occurred previously.
On-time delivery and documentation accuracy data, which often correlates with broader supplier process discipline even when it isn't a direct quality measurement.
Recognizing the Signature of a Developing Supplier Issue
Supplier quality drift rarely shows up as a single dramatic outlier; it usually looks like a gradual shift in the center of a measurement distribution, a slow widening of variation, or a run of consecutive measurements trending toward one side of a tolerance band without any individual point actually crossing it. Recognizing these signatures, rather than only reacting to outright failures, is what separates proactive supplier management from a purely reactive incoming inspection process.
A tooling wear pattern, for instance, often produces a slow, steady drift in a critical dimension across many consecutive lots, moving in a single direction as the tool gradually loses precision. A raw material substitution, by contrast, might produce a step change, where measurements shift to a new, stable level rather than trending gradually, which points investigators toward a different kind of root cause. Being able to visually distinguish these patterns, rather than treating every anomaly the same way, helps supplier quality teams triage issues faster and route them to the right corrective action path.
Process variation widening, where individual measurements stay centered near target but the spread between the highest and lowest values in each lot grows over time, is another pattern worth watching separately from a shift in the average. This kind of drift can indicate equipment maintenance needs, operator inconsistency, or an aging fixture, and it often precedes an eventual out-of-spec result even while every individual lot is still technically passing inspection.
Turning Monitoring Data Into a Shared Improvement Conversation
Continuous monitoring data creates the most value when it's shared with suppliers as part of an ongoing improvement conversation, rather than being used purely as an internal surveillance tool that only surfaces during formal corrective action requests. Suppliers who can see the same trend data the receiving plant sees are often in a better position to catch and address developing issues on their own end, sometimes before the plant's monitoring system even flags a concern.
Some supplier quality programs have found success setting up a regular, lightweight review cadence, sharing a summary of trend data for each key supplier on a monthly or quarterly basis, distinct from the formal annual audit. This keeps the relationship collaborative rather than adversarial, and gives suppliers an incentive to invest in their own process monitoring capability, knowing that the data will be visible to their customer regardless.
Catching a Stamping Supplier's Tooling Wear Before Lot Rejection
A stamped bracket supplier had passed every individual lot inspection for months, with each measurement comfortably within tolerance. No single lot ever triggered a rejection, so nothing in the traditional pass/fail inspection process signaled a problem developing.
Trend monitoring across consecutive lots revealed a steady drift in a critical dimension over roughly a dozen lots, consistent with gradual stamping die wear. The supplier was notified before any lot actually failed inspection, replaced the worn die proactively, and the plant avoided both a production disruption and a potential downstream warranty issue that would have taken months to trace back to this root cause.
Building a Continuous Monitoring Program Step by Step
Pilot continuous monitoring on the suppliers producing safety-critical or high-volume components before expanding to the full supplier base.
Ensure incoming inspection measurements are captured digitally and consistently, since a monitoring platform is only as good as the data feeding it.
Start with thresholds that minimize false alarms, then tighten them gradually as the team builds confidence in the signal quality.
Share trend data directly with suppliers as part of ongoing quality reviews, turning monitoring into a collaborative improvement tool rather than a one-way surveillance system.
This Works Alongside Your Current Supplier Quality Process, Not Instead of It
A common concern when introducing continuous monitoring is whether it requires ripping out and replacing existing supplier quality management systems, incoming inspection software, or ERP-based receiving processes. In practice, the more effective approach treats continuous monitoring as an additional analytical layer that pulls data from those existing systems rather than replacing any of them. Incoming inspection continues to happen exactly as it does today, using the same equipment and the same pass or fail criteria at the point of receiving.
What changes is what happens to that inspection data after the immediate accept or reject decision is made. Instead of that data being filed away in a records system and rarely revisited, it flows into a continuously updated trend view alongside every other measurement taken on that supplier and part number, going back as far as historical data allows. This means the operational disruption of adopting continuous monitoring is generally lower than teams expect, since the frontline inspection process itself doesn't need to change, only what happens to the data afterward.
For plants running older or highly customized incoming inspection systems, the practical starting point is usually a data export or integration layer that pulls existing records into the monitoring platform on a regular schedule, rather than requiring inspection stations themselves to be replaced or reconfigured. This lower-disruption path tends to make adoption significantly easier to justify to plant floor teams who are understandably cautious about changes to processes they rely on every shift.