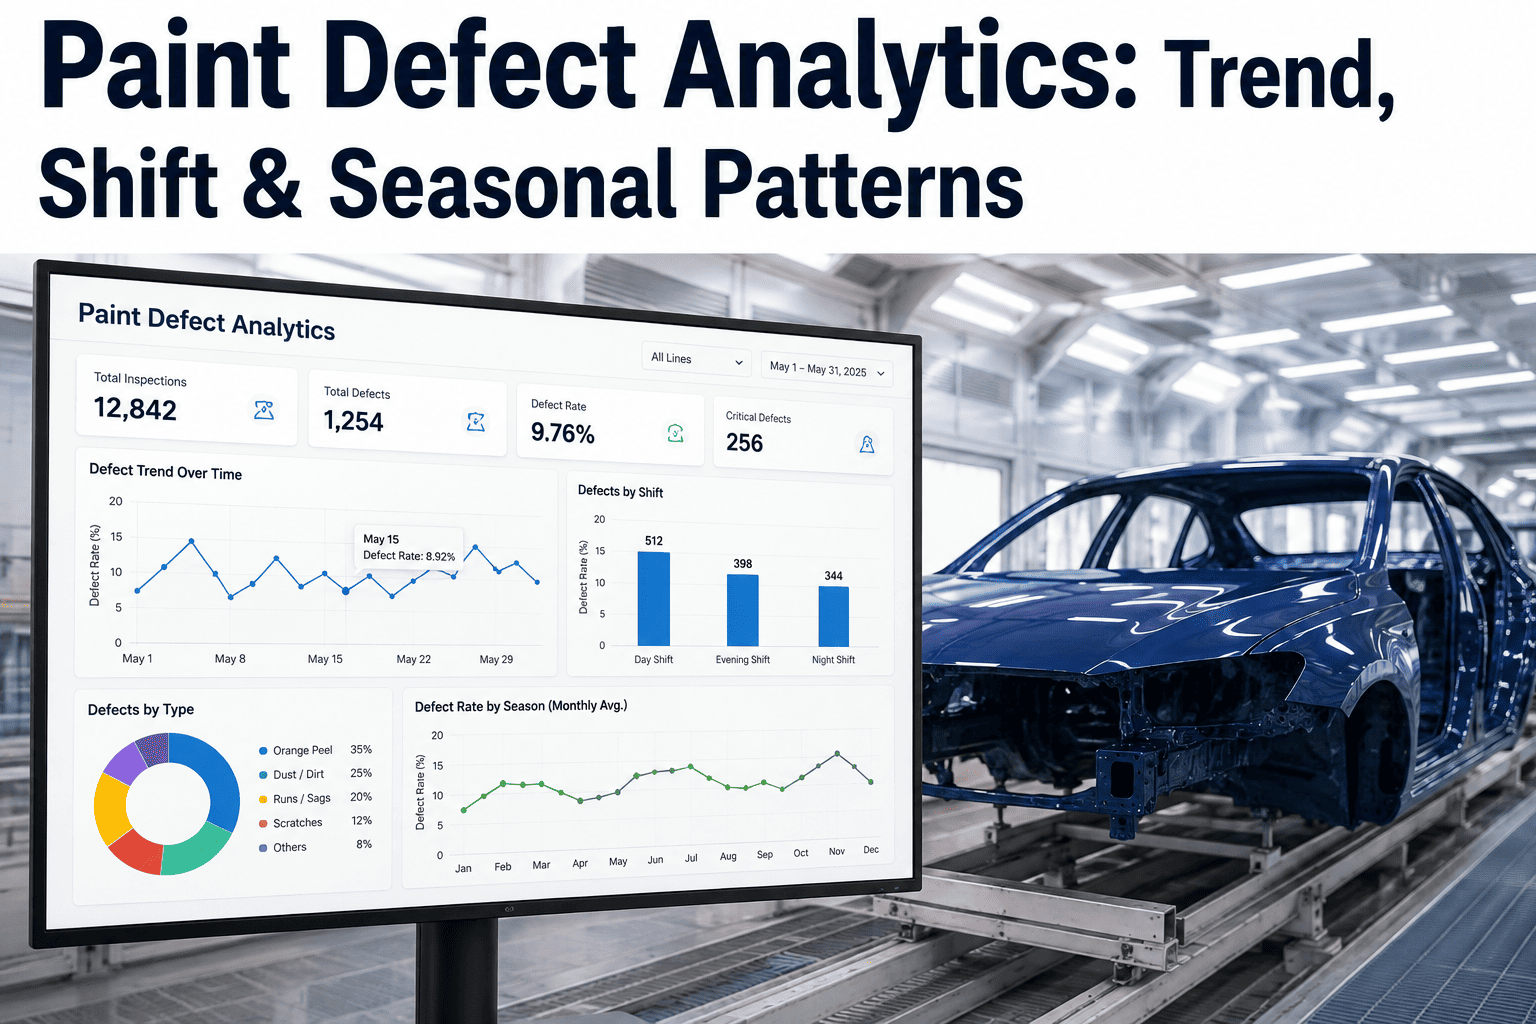
A defect report that just says "212 defects this month" is almost useless for deciding what to fix next, because it hides the pattern buried inside it. Maybe eighty percent of those defects cluster on one station during the night shift when a specific model variant runs, which is a completely different problem than defects spread evenly across every station and shift. Without breaking the data down by station, model, and shift together, a quality team ends up chasing the loudest individual complaint instead of the actual systemic pattern, and two very different root causes — a worn fixture on one station versus a training gap on one shift — end up getting the same generic corrective action applied to both. See what patterns are actually hiding in your own defect data.
A Defect Count Hides the Pattern. A Cross-Tab Reveals It.
The same total defect count can mean a concentrated fixture problem or a spread-out training gap. Breaking data down by station, model, and shift together is what tells you which one you're actually facing.
station, model, and shift together — the minimum breakdown needed to see a real defect pattern instead of a flat total
of assembly defects in a typical plant concentrate in a small number of station-shift-model combinations, not evenly across the line
a station-specific pattern and a shift-specific pattern point to entirely different fixes, which a flat defect count can't distinguish
Where Defects Actually Concentrate
Plotting defect rate by station against shift immediately shows whether a problem is isolated to one combination or spread evenly, which is the first branch point in any root cause investigation.
Build Your Own Station-Shift-Model Breakdown
iFactory analyzes your defect data across all three dimensions at once to show exactly where the real concentration sits, not just the loudest total.
What Each Dimension Actually Tells You
Station, model, and shift each point toward a different category of root cause, which is why isolating which dimension actually drives the pattern matters.
Station-Specific Patterns
A defect concentrated at one station regardless of model or shift usually points to a fixture, tooling, or equipment condition issue specific to that physical location.
Model-Specific Patterns
A defect that follows one model variant across every station and shift usually traces back to a design tolerance, part fit, or process instruction issue specific to that model.
Shift-Specific Patterns
A defect concentrated on one shift regardless of station or model typically points to a training, staffing, or fatigue-related factor rather than an equipment or design issue.
Pattern Type and Likely Corrective Action
The dimension a defect concentrates in points directly toward the category of fix likely to actually resolve it.
What Changes When Defects Get Broken Down This Way
Figures reflect typical outcomes within the first two quarters after moving from flat defect totals to a full station-model-shift breakdown.
A Quality Manager's View on Defect Pattern Analysis
We spent months retraining operators plant-wide on a specific fastening defect before someone finally broke the data down by station and shift together, and it turned out the entire problem was one worn fixture on the night shift line. The retraining wasn't wrong to do eventually, but we would have found and fixed the actual cause in a week instead of chasing it plant-wide for months if we'd looked at the cross-tab first.
The Bottom Line on Assembly Defect Analytics
A flat defect total treats every root cause the same, which is exactly why it so often leads to a generic corrective action applied to a very specific problem. Breaking the same data down by station, model, and shift together reveals which dimension the pattern actually follows, and that dimension is what tells you whether you're looking at a fixture problem, a design problem, or a training problem before you spend resources fixing the wrong one.
Frequently Asked Questions
How much historical defect data is needed before a pattern becomes statistically meaningful?
The amount needed depends on baseline defect frequency, but generally a few weeks of consistent data collection across all three dimensions is enough to start seeing whether a pattern is concentrated or genuinely spread evenly, with confidence increasing as more shifts and model runs get captured. Book a review to see what your current data already supports.
What if a defect pattern follows two dimensions at once, like one station on one specific shift?
A combined pattern — one station during one specific shift — often points to a factor unique to that combination, such as a specific operator's technique on that equipment, or a fixture that only shows wear symptoms under a particular pace of work that occurs on that shift, which is exactly the kind of insight a flat total or a single-dimension breakdown would miss entirely.
Does this analysis require new inspection equipment, or can it use existing quality data?
Most plants already capture defect location, timestamp, and model information through existing quality inspection systems, so the analysis typically works from data already being collected — the gap is usually in how that data gets aggregated and cross-tabulated, not in what's being captured at the point of inspection.
How often should the station-model-shift breakdown be refreshed?
Continuous refresh gives the earliest warning of an emerging pattern, but at minimum a weekly review catches most developing issues before they compound into a larger systemic problem, especially for high-volume lines where a new defect pattern can accumulate significant volume within just a few days.
Can this same breakdown approach apply to warranty or field return data, not just in-plant defects?
Yes — the same station, model, and shift dimensions, extended with build date, can be applied to warranty claim data to trace a field failure pattern back toward its likely production origin, connecting downstream quality issues to the same root cause categories used for in-plant defects. Talk to a specialist about extending this analysis to your warranty data.
Find Your Real Defect Pattern, Not Just the Total
Book a 30-minute assessment. iFactory breaks your defect data down by station, model, and shift to show exactly where the pattern actually concentrates.