An assembly line is only as fast as its slowest station, and downtime anywhere near that station costs more than the same stoppage anywhere else on the line. Yet most downtime reports treat every station equally, ranking stops by total minutes lost without asking whether those minutes actually constrained the whole line's output or simply ate into buffer that the next station absorbed without consequence. Finding the real bottleneck, and analyzing downtime specifically around it, is what turns a station-by-station report into a plan that actually moves total line throughput. This guide covers how to find it and what to do once you have — and if you want this mapped against your own line, book a demo with iFactory.
Not Every Stop Costs the Same Minute
A stop at your true bottleneck station constrains total line output — the same stop anywhere else often just eats into buffer. Finding the real constraint changes where you invest.
Mapping the Line: Where the Constraint Actually Sits
A simple station-by-station view, with cycle time and buffer size marked, usually makes the true bottleneck visible at a glance — it's the station running closest to its cycle time limit with the smallest buffer cushion on either side.
Station 3's cycle time is closest to the line's target takt, leaving almost no slack — any stop here directly delays every downstream station and caps total line output for the day.
Find Your Line's Real Constraint
iFactory tracks cycle time and buffer consumption per station, so the true bottleneck is visible instead of assumed.
Why Buffer Size Changes the Math Entirely
A station with a generous buffer on either side can go down for several minutes without ever slowing the line — the buffer simply absorbs the interruption. A station with a thin buffer transmits every second of downtime directly to total output. Ranking stops by raw minutes without accounting for buffer position produces a misleading priority list.
Large buffer station
A five-minute stop here may cost the line nothing if the buffer holds enough parts to keep downstream stations fed through the interruption.
Thin buffer station
The same five-minute stop here propagates immediately — every downstream station starves within seconds, and the whole line's output for the shift drops.
A Four-Step Method for Bottleneck-Aware Downtime Analysis
Finding and acting on the real constraint follows a repeatable sequence that most lines can run within a single planning cycle.
Measure cycle time per station
Capture actual cycle time for every station over at least two full weeks to account for normal shift-to-shift variation.
Map buffer size at each interface
Record how many units of buffer sit between each pair of stations, in time equivalent, not just physical count.
Weight downtime by throughput impact
Recalculate each station's downtime ranking using buffer-adjusted impact on total line output, not raw stop minutes.
Target the bottleneck first, always
Direct improvement resources at the constraint station before any other, since gains elsewhere rarely move total line output.
The Bottleneck Moves — Keep Watching It
Fixing today's bottleneck doesn't end the exercise. Once station 3's cycle time improves, station 2 or another station typically becomes the new constraint, and the analysis needs to run again rather than being treated as a one-time project.
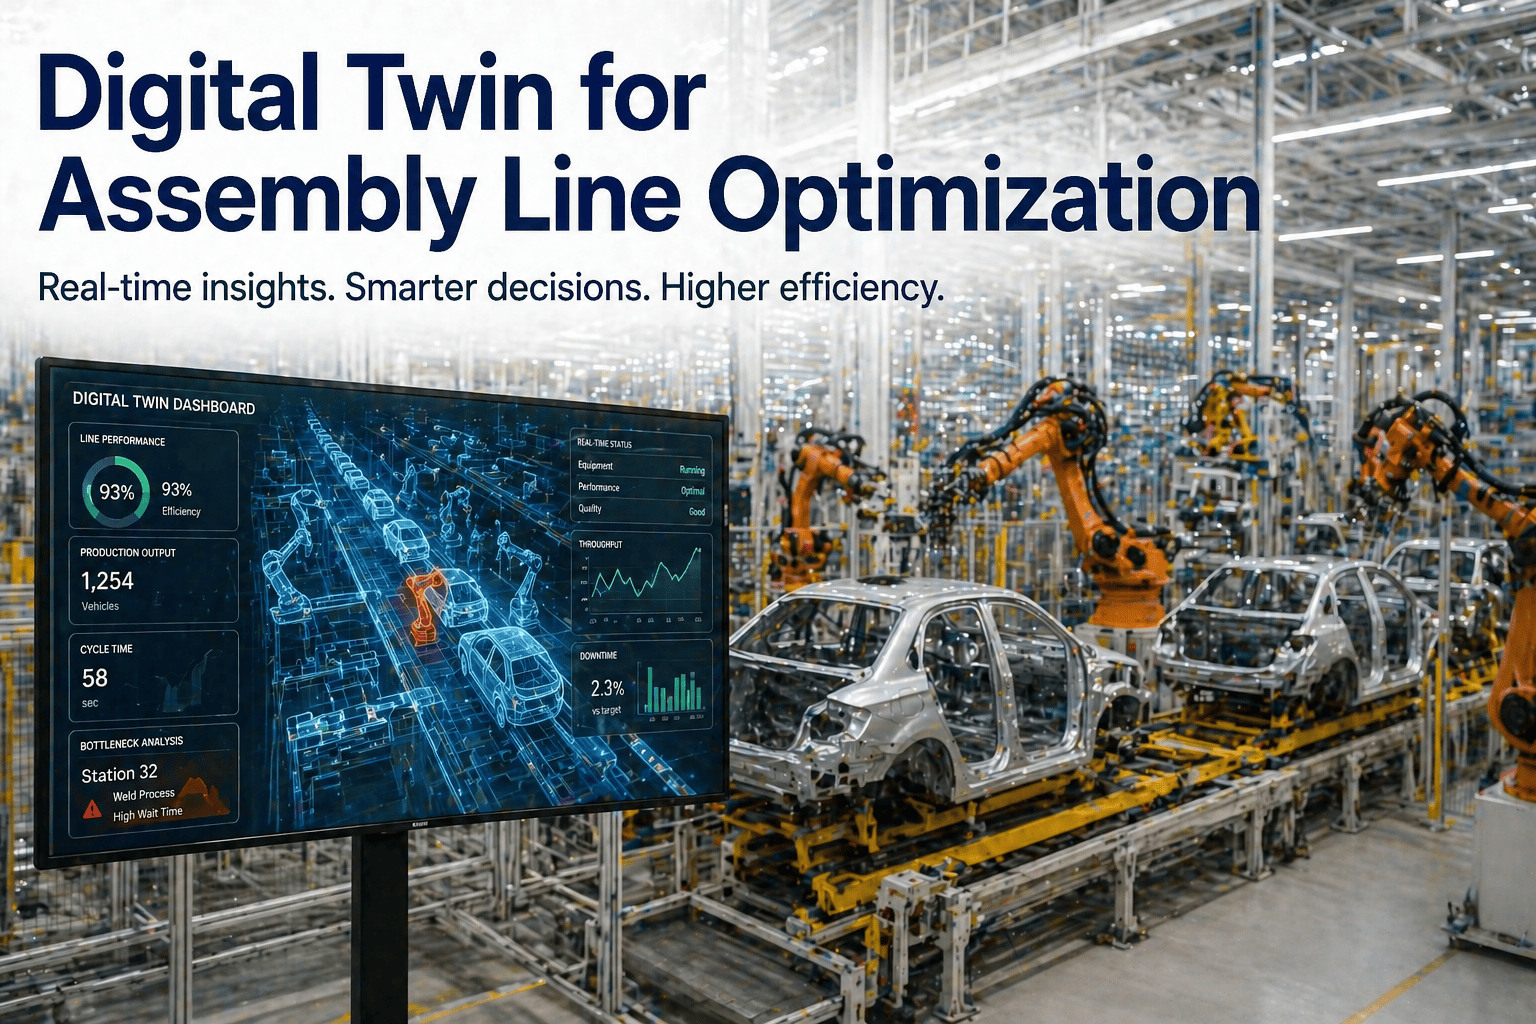
Station 3 constrains the line at 58 seconds per unit. Downtime here directly caps daily output regardless of what happens elsewhere.
Station 3 drops to 44 seconds. Station 2, now the slowest at 45 seconds, becomes the new constraint — the analysis and improvement focus shift with it.
Frequently Asked Questions
How do we identify our line's true bottleneck if we've never measured buffer size before?
Start by capturing cycle time per station over a two-week window — the station consistently running closest to the line's target takt time is almost always the constraint, even without precise buffer measurements. Buffer size refines the analysis and explains why some high-downtime stations don't actually limit output, but cycle time alone gets you most of the way to identifying the real bottleneck. A station-level cycle time view is the fastest starting point.
Should we add buffer everywhere to reduce the impact of downtime?
Adding buffer indiscriminately consumes floor space and work-in-process inventory without addressing the underlying cause of stops. The more effective approach is targeted: add buffer specifically around stations with historically volatile cycle times or frequent short stops, while focusing root-cause elimination efforts on the true bottleneck station where buffer can't fully absorb the impact anyway.
How often does the bottleneck typically shift on an active assembly line?
It varies by line, but any meaningful change to a station — a tooling upgrade, a process adjustment, a maintenance fix — can shift the constraint elsewhere. Many plants find it useful to re-run the bottleneck analysis on a monthly cadence, or immediately after any significant change to a station's cycle time, rather than assuming last quarter's constraint still holds.
Does this bottleneck-aware approach apply to manual assembly stations or only automated ones?
The same logic applies to both. Manual stations have cycle time variation driven by operator pace and part complexity rather than machine faults, but the constraint math is identical — the station with the least slack relative to takt time, whether automated or manual, is the one whose downtime or slowdown directly caps line output.
What's the fastest way to see our current bottleneck without a lengthy study?
If cycle time data is already being captured at the station level, identifying the current constraint is often a same-day exercise once that data is pulled into one view. If it isn't yet captured, a short measurement period is the necessary first step — book a demo to see how quickly that data can be surfaced on your line.
Find and Track Your Real Constraint
Book a 30-minute demo and see how iFactory maps cycle time and buffer across every station on your assembly line.