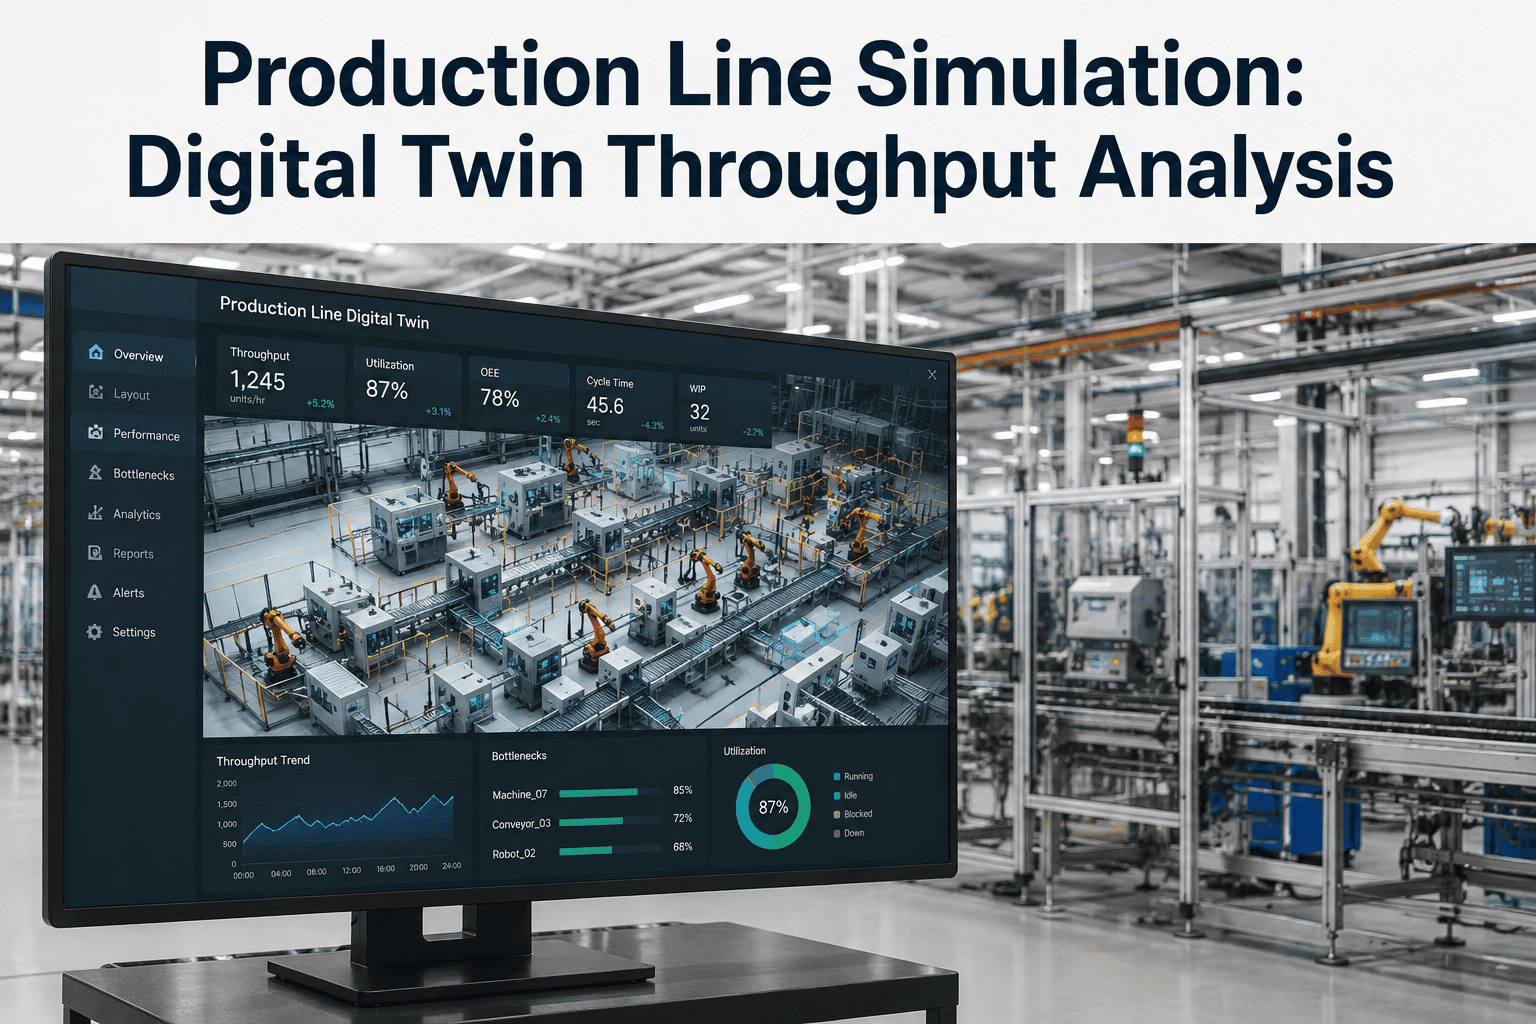
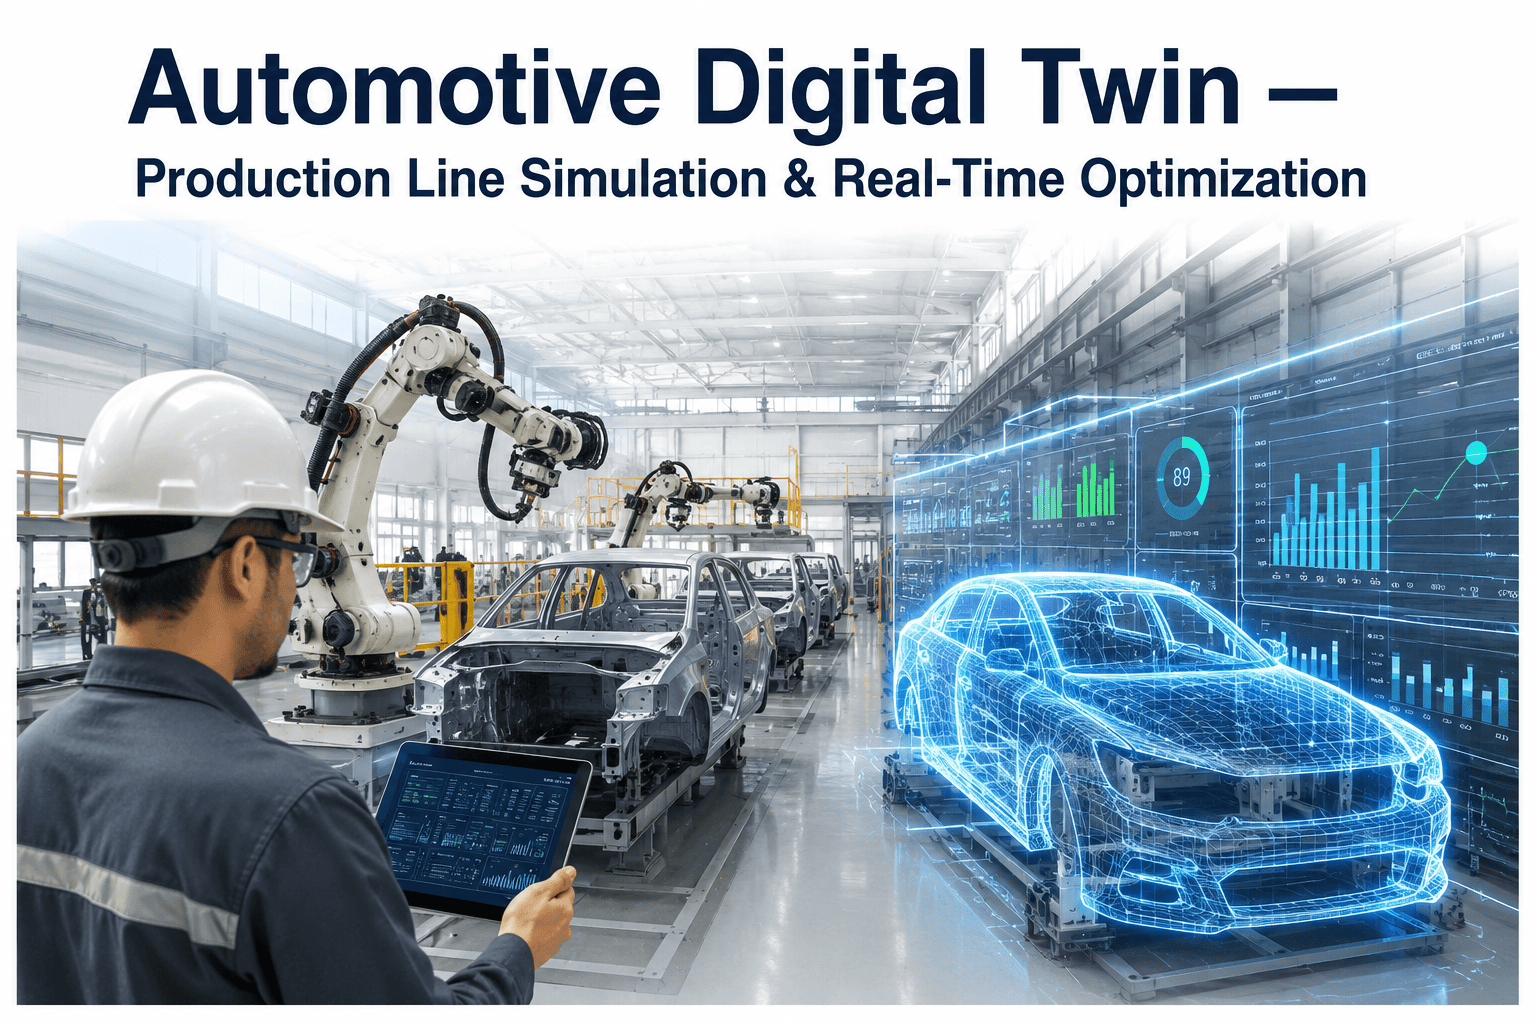
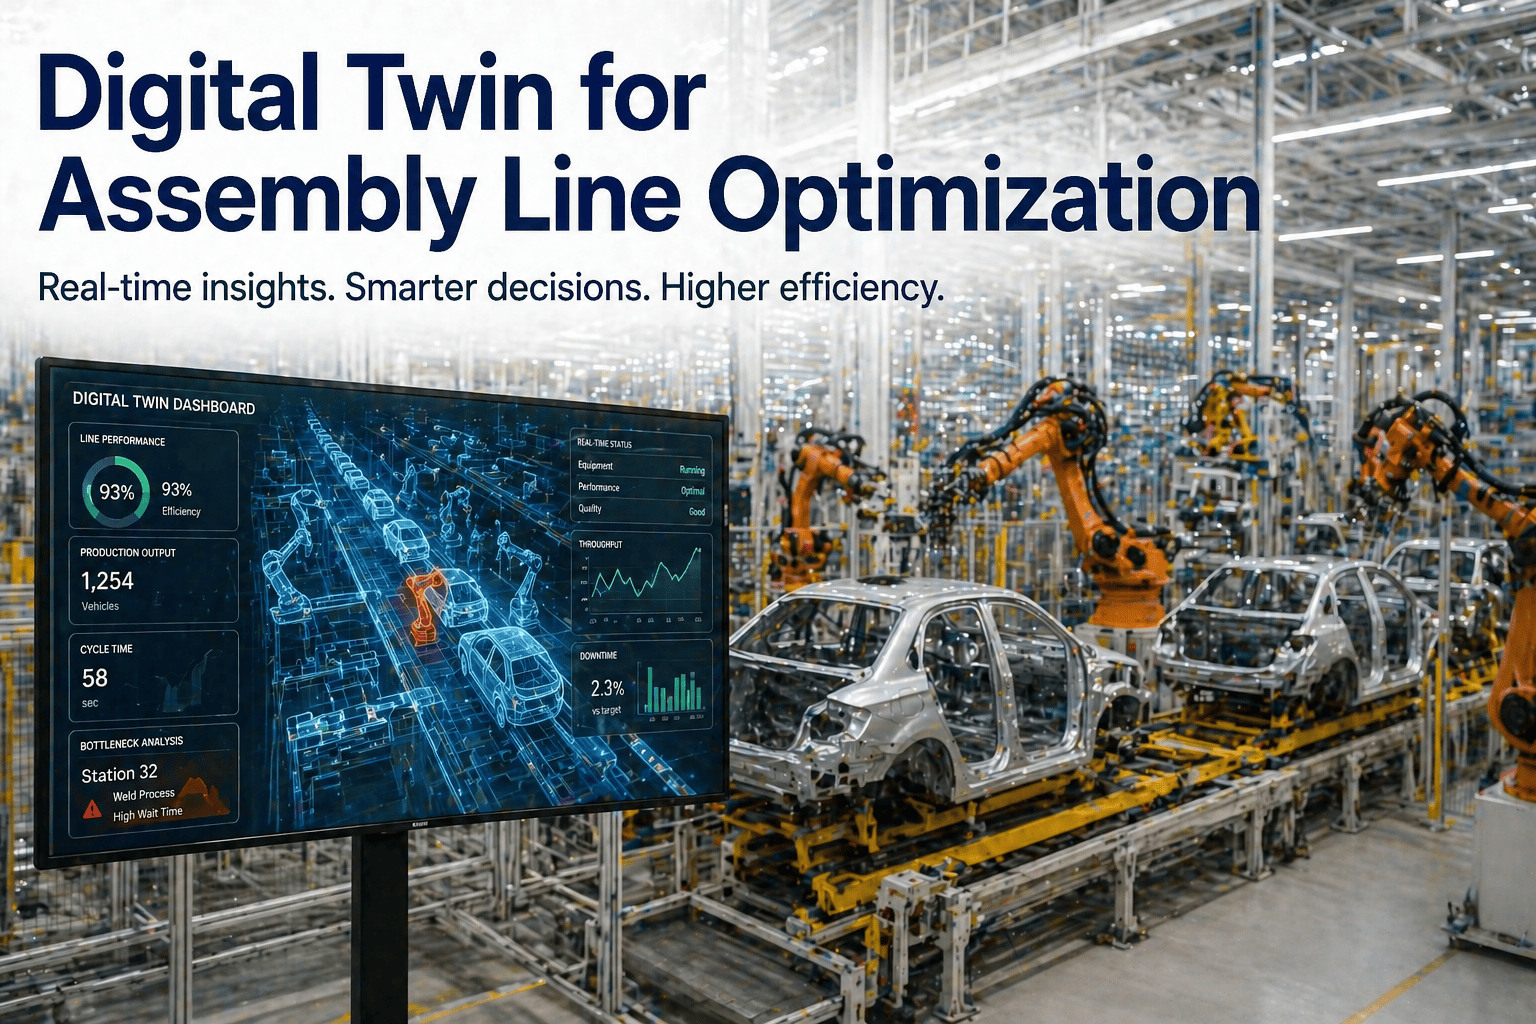
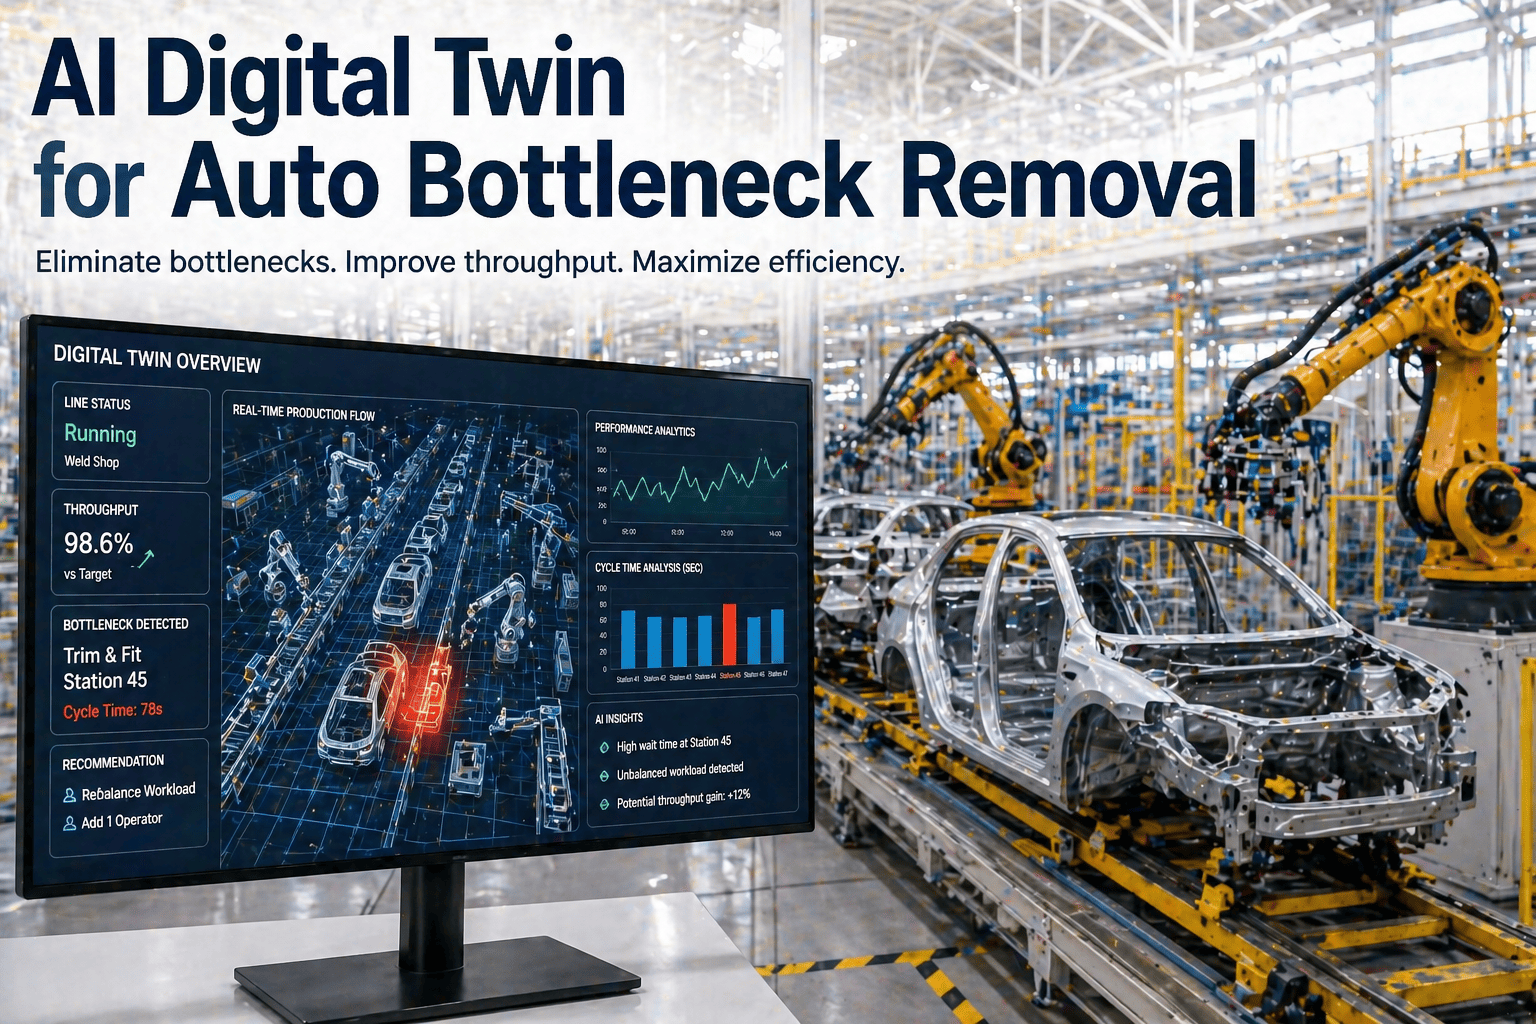
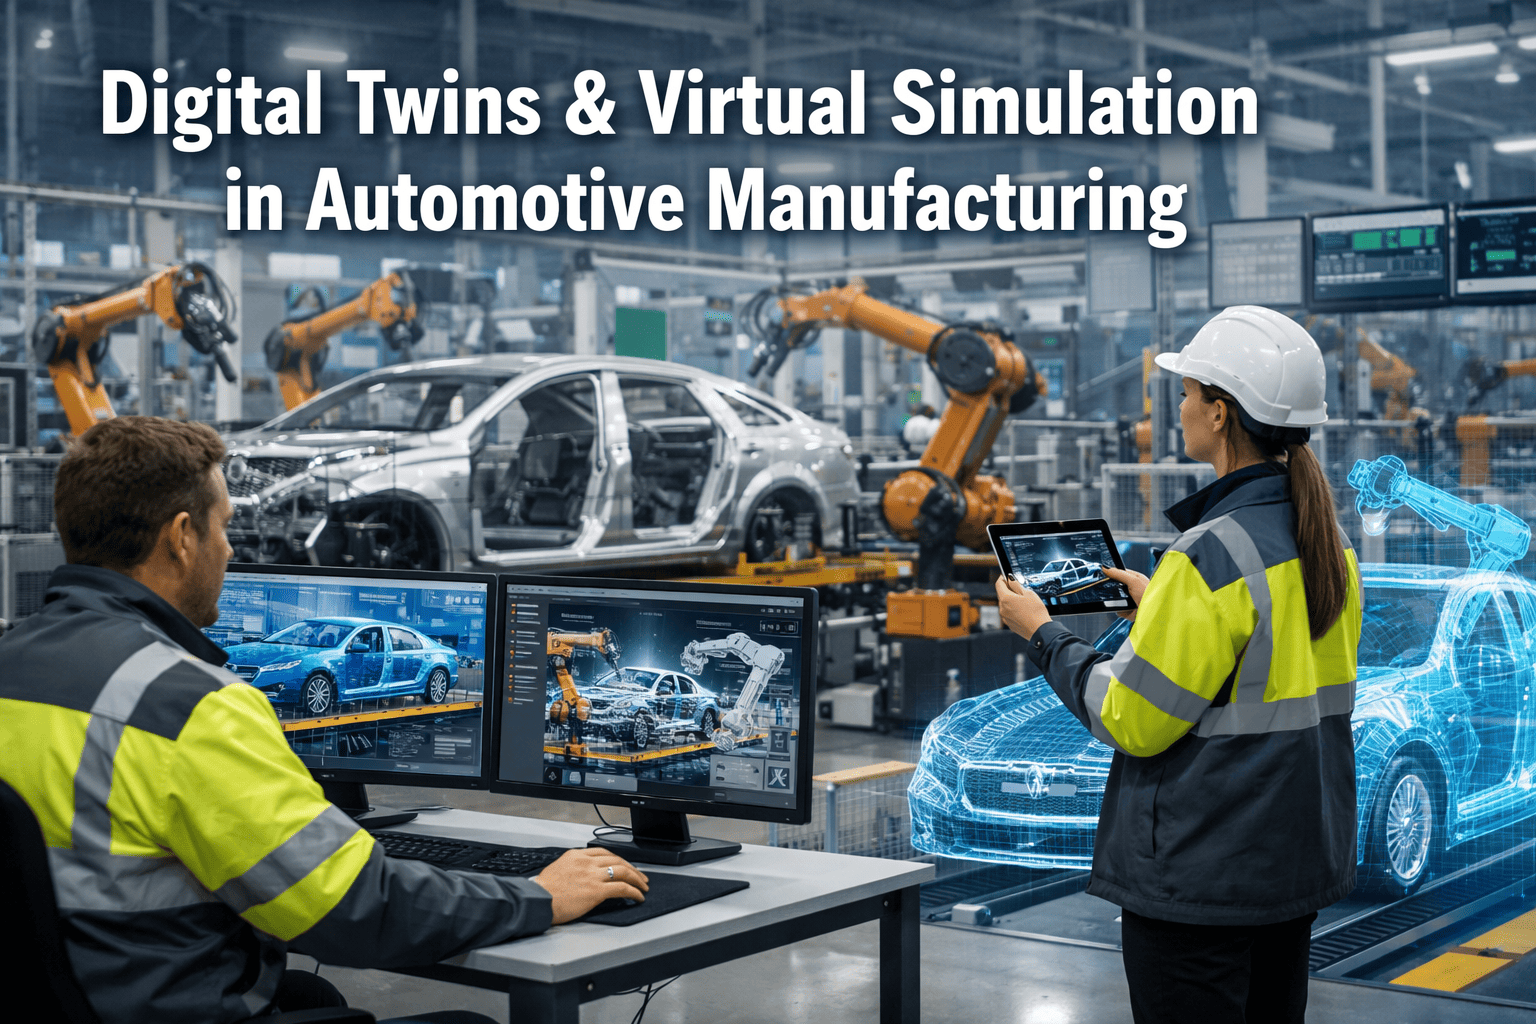
Every production line has a bottleneck, the one station that sets the ceiling on total throughput no matter how much every other station is optimized, but most plants find their bottleneck by watching where units pile up rather than by modeling the line and knowing in advance. A simulation built from your actual station cycle times and buffer behavior can show exactly where that ceiling sits and what specific change would actually raise it, instead of a guess based on where the queue looks longest on a given day. iFactory builds throughput simulations from your real line data, and you can book a demo to see your own line's bottleneck modeled directly.
PRODUCTION SIMULATION · DIGITAL TWIN THROUGHPUT
Know Your Bottleneck Before You Spend Money Fixing the Wrong Station
iFactory simulates your line's throughput using real station cycle times and buffer data, showing exactly where the ceiling sits and which change actually raises it.
Bottleneck Station
Sets the ceiling for the entire line
Upstream Stations
Often already have capacity to spare
Buffer Zones
Sized correctly, they absorb variability
WHY BOTTLENECKS GET MISDIAGNOSED
The Station With the Longest Queue Is Not Always the Real Constraint
A queue building up in front of a station often gets blamed as the bottleneck, but sometimes that queue exists because a station further downstream is the true constraint and everything upstream of it is simply waiting its turn, a pattern that is easy to misread by observation alone. Fixing the wrong station wastes capital and leaves the actual ceiling on throughput completely untouched, while the real constraint continues limiting total output exactly as before.
1 station
Usually sets the ceiling for total line throughput at any given time
Misleading
Visible queue length does not always point to the true constraint
Shifting
The bottleneck can move once an upstream fix changes flow dynamics
WHAT THE SIMULATION ACTUALLY DOES
Modeling Flow, Not Just Averages
01
Map Station Cycle Times
Real cycle time variability captured per station, not a single averaged figure that hides variation.
02
Model Buffer Behavior
Current buffer sizes and how they absorb upstream and downstream variability under real conditions.
03
Run the Line Virtually
The simulated line runs through many cycles to reveal where units actually accumulate over time.
04
Identify the True Constraint
The station consistently limiting total output is identified, separate from stations with merely visible queues.
Find Your Real Bottleneck Before You Invest in a Fix
iFactory models your line from actual cycle time and buffer data to show exactly where the throughput ceiling sits.
TAKT TIME AND BUFFER SIZING
Two Levers That Actually Move Throughput
Once the true bottleneck is identified, the simulation can also test specific interventions against it, whether that means adjusting takt time targets, resequencing work content, or resizing a buffer, before any of those changes are made physically on the line.
Takt Time Rebalancing
Test shifting work content between stations to relieve pressure on the identified constraint.
Buffer Resizing
Model how a larger or repositioned buffer would absorb variability without adding unnecessary work in progress.
Parallel Station Addition
Simulate the throughput gain from adding a parallel station before committing capital to build it.
Changeover Sequencing
Test different changeover orders to see which sequence minimizes total line disruption.
SIMULATION VS OBSERVATION
What Changes When the Line Is Modeled Instead of Watched
| Approach |
How the Constraint Is Found |
Risk |
| Visual Observation |
Watching where queues visibly build up |
Can misidentify a downstream effect as the root cause |
| Static Averages |
Comparing average cycle times across stations |
Hides variability that actually drives bottleneck behavior |
| iFactory Simulation |
Modeling flow dynamics across many cycles |
Identifies the true constraint before capital is committed |
WHERE THROUGHPUT SIMULATION HELPS MOST
Lines Facing a Capacity or Investment Decision
Capacity Expansion Planning
Confirm which station actually needs additional capacity before committing to new equipment.
New Model Line Balancing
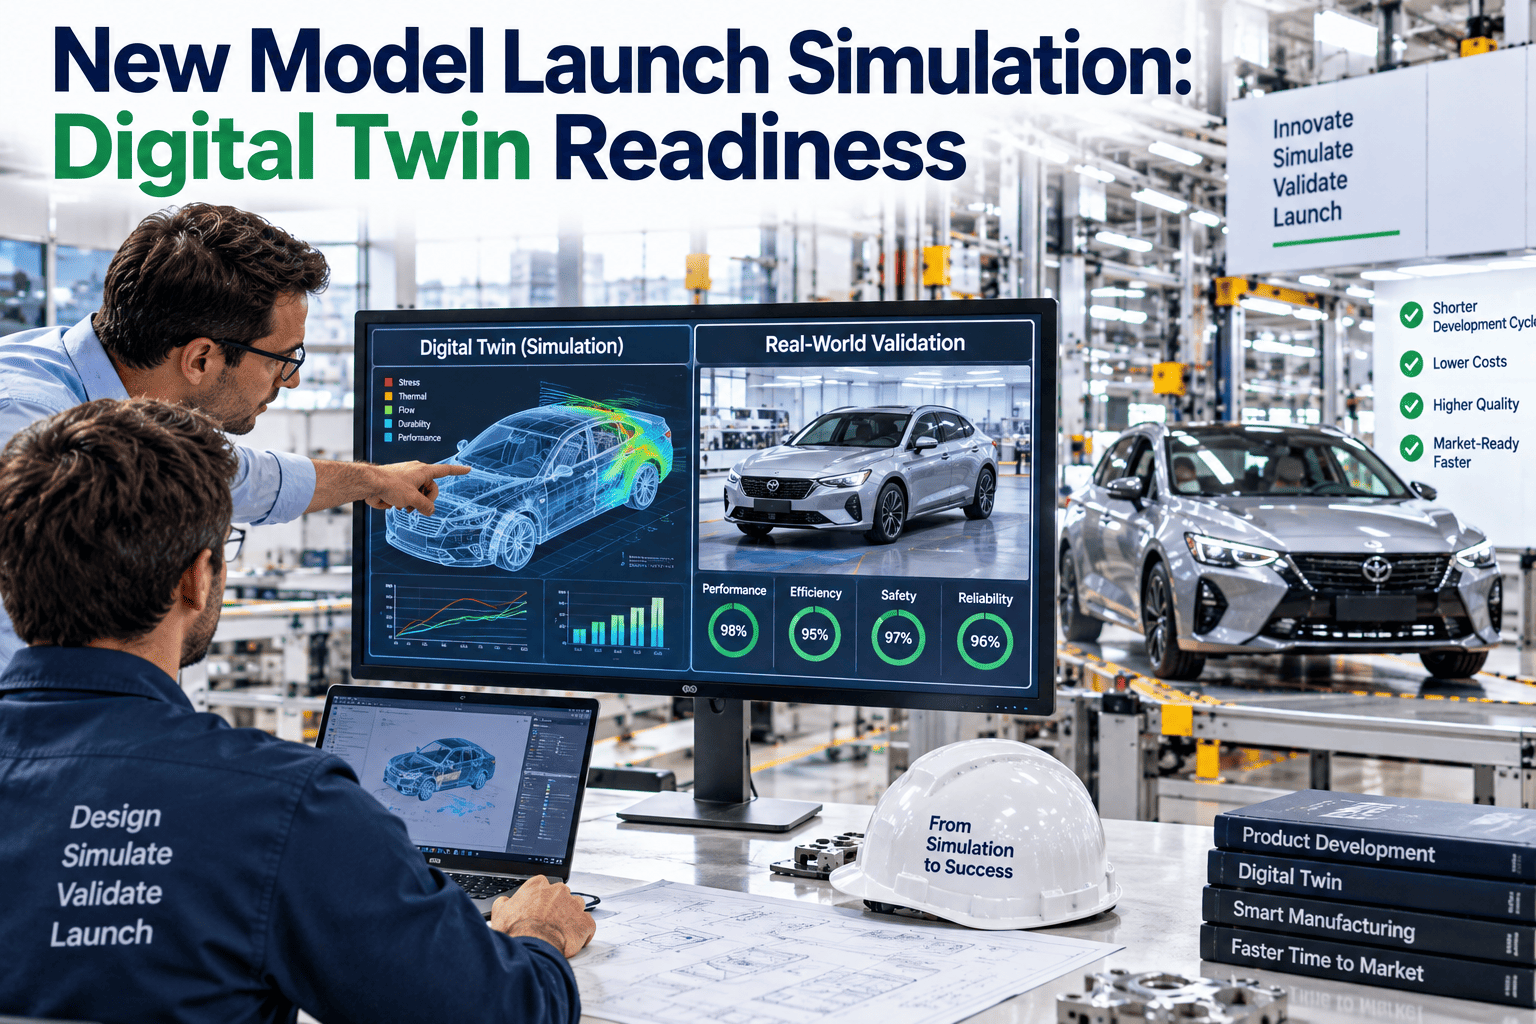
Test work content distribution across stations before a new model launch locks in the sequence.
Buffer and Layout Redesign
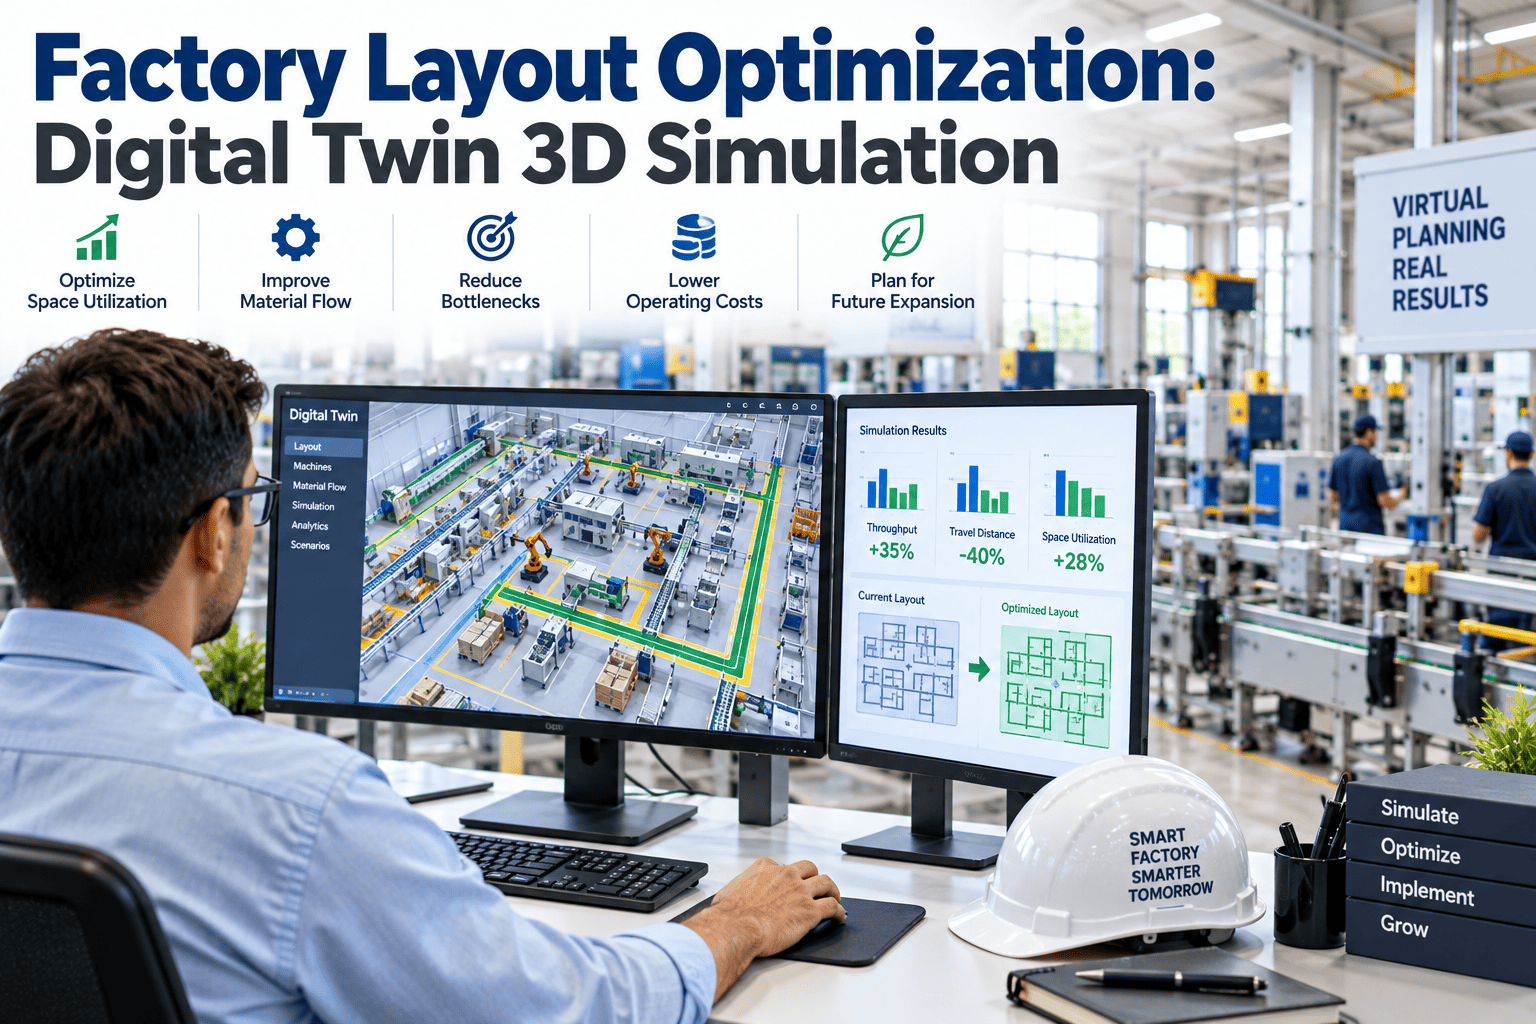
Right-size buffers and station spacing before a physical layout change is implemented.
Persistent Throughput Shortfalls
Diagnose why a line consistently misses its target rate despite no single obvious cause.
FREQUENTLY ASKED QUESTIONS
What Production Engineers Ask Before Simulating a Line
How much historical data is needed to build an accurate throughput simulation?
A simulation benefits from enough historical cycle time and downtime data to capture normal variability across different shifts and conditions, rather than a single averaged snapshot, and the model is validated against a recent known period to confirm it reproduces actual line behavior before being trusted for scenario testing.
Book a demo to review data requirements for your specific line.
Can the simulation tell us the bottleneck will move once we fix the current one?
Yes, this is one of the most valuable outputs of a proper simulation, since fixing the current constraint often reveals a new one immediately behind it, and the model can show where that next constraint is likely to land before you invest in a fix that only shifts the problem one station over.
Contact our support team to see how bottleneck migration is modeled.
Do we need to simulate the entire plant or can this be done for a single line?
A single line can be simulated independently, and most projects start there since the value of identifying a specific line's true constraint is immediate, with broader multi-line or plant-wide simulation added later if cross-line dependencies become relevant to the decision being made.
Book a demo to scope a simulation for your specific line first.
How reliable are the throughput numbers the simulation predicts for a proposed change?
Predicted throughput numbers are directionally reliable once the underlying model has been validated against real historical performance, giving a strong basis for comparing options against each other, though they are best treated as a decision-support estimate rather than an exact guarantee of real-world results once a change is implemented.
Contact our support team to discuss confidence levels for your use case.
Can this simulation also account for planned or unplanned downtime, not just cycle time?
Yes, downtime patterns from maintenance history are incorporated into the model so the simulation reflects realistic availability rather than assuming every station runs continuously at its rated cycle time, which materially changes where the true bottleneck is identified compared to a cycle-time-only model.
Book a demo to see downtime incorporated into your line model.
Stop Guessing Where Your Line's Ceiling Actually Sits
iFactory simulates your real line data to identify the true bottleneck and test fixes before you spend on the wrong one.