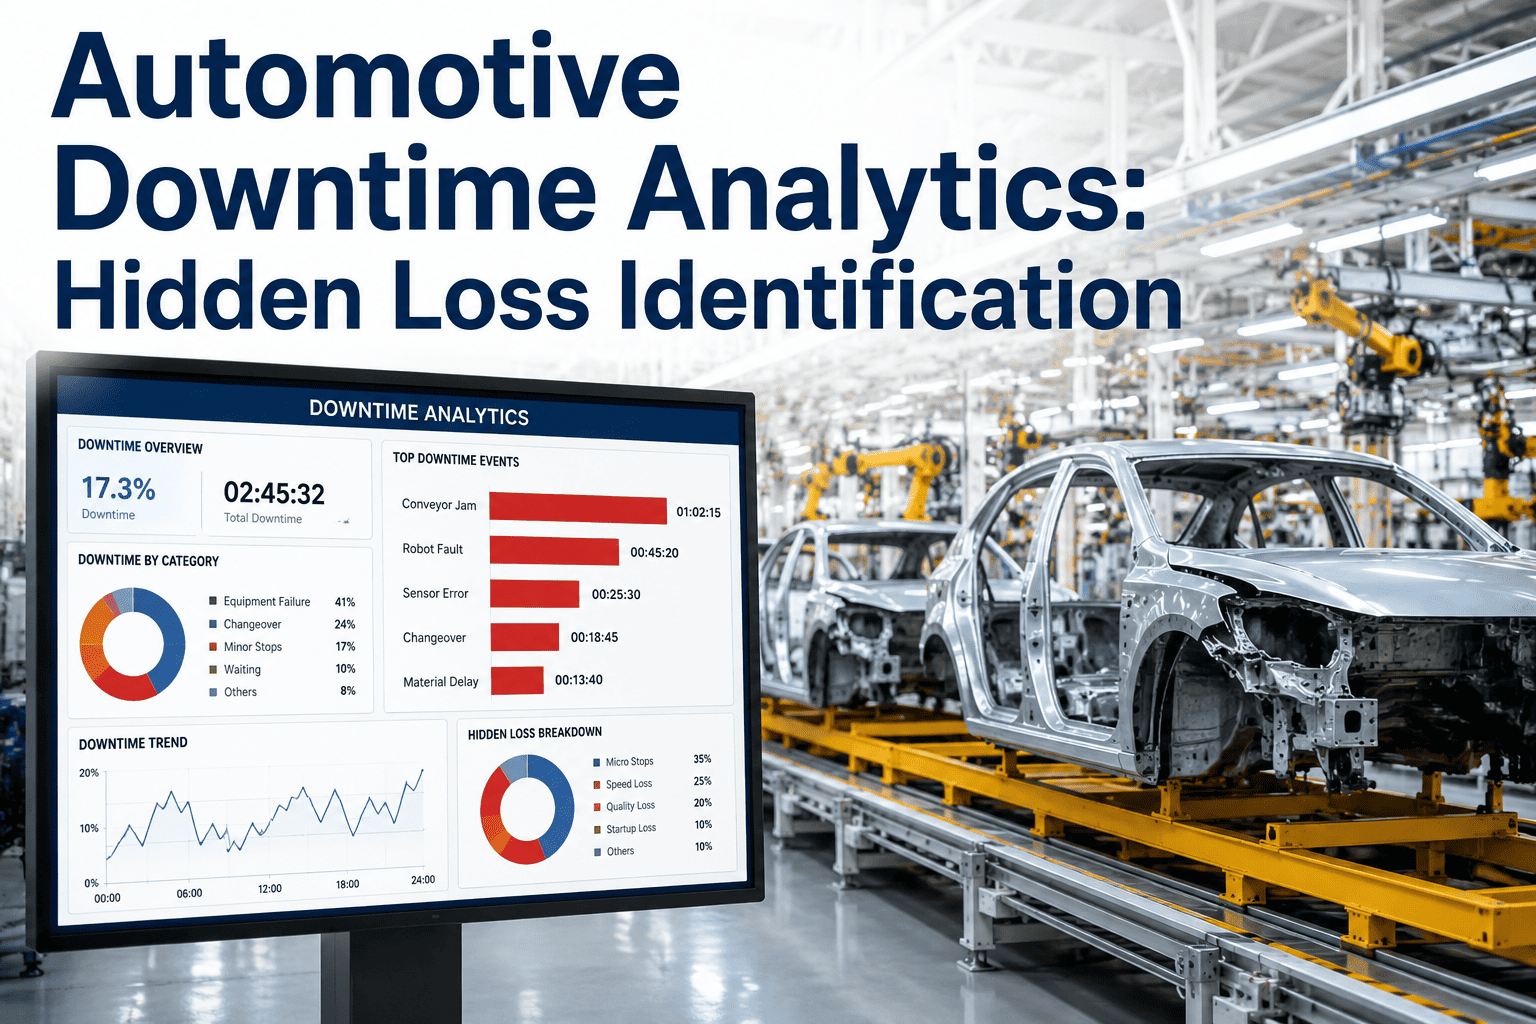
Ask most plant managers how much downtime their line had yesterday and they'll give a confident number pulled from the shift log. Ask how much of that number came from stops under five minutes, or from the line quietly running ten percent slower than nameplate speed all afternoon, and the confidence usually drops. Those hidden losses rarely make it into a paper log, yet across manufacturing they account for a large share of total lost capacity — closer to a third in many plants. This guide walks through how to find losses that never show up in a manual report, using the same data an automotive line already generates every cycle. If your team wants to see what's hiding in your own downtime data, book a demo with iFactory.
The Losses Your Shift Log Never Catches
Micro-stops, speed loss, and cascade failures rarely make it into a paper log — yet they can account for a third of total lost capacity on an automotive line.
The Downtime Iceberg
Major breakdowns are the visible tip of a plant's downtime problem — they get logged, escalated, and discussed in the daily meeting. Below the waterline sits a much larger mass of loss that never gets the same attention, simply because no individual event looks significant enough to write down.
Major breakdowns and planned stops
Equipment failures, tooling changes, and shift changeovers. Easy to see, easy to log, usually already tracked in a CMMS or shift report.
Micro-stops under 5 minutes
Sensor jams, part misalignment, brief jams. Individually trivial, collectively responsible for a large share of total loss.
Speed loss
A line running below its rated cycle time all shift, often invisible unless cycle time is logged automatically per unit.
Cascade failures
One upstream stop triggering a chain of downstream starves and blocks that never get attributed back to the original cause.
Counting What Manual Logs Miss
Finding hidden loss is a data-collection problem before it's an analysis problem. The three techniques below are what turn an invisible loss category into something a Pareto chart can rank.
Sensor-level micro-stop counting
Every stop, regardless of duration, gets timestamped automatically from PLC state changes rather than relying on an operator to notice and log it.
Cycle-by-cycle speed comparison
Actual cycle time compared against ideal cycle time for every single unit, not sampled periodically, to surface gradual speed drift.
Cascade attribution logic
Downstream stops within a defined window of an upstream stop get linked back to the originating event instead of counted as separate losses.
Find Out What's Below Your Own Waterline
iFactory captures every micro-stop and speed variation automatically, so hidden loss shows up on the Pareto chart instead of staying invisible.
Where Hidden Loss Concentrates by Shop
The specific hidden losses that dominate differ by area of an automotive plant. Knowing where to look first speeds up the discovery process considerably.
From Identification to Recovery
Finding hidden loss only matters if it changes what the team does next. The path from a newly visible loss category to an actual OEE gain follows a consistent sequence.
Baseline the new category
Run 30 days of automatic capture before drawing conclusions — hidden losses can vary week to week more than visible breakdowns.
Rank against existing losses
Place the newly quantified hidden loss into the same Pareto as breakdowns and changeovers to see its true relative priority.
Assign a specific owner
Micro-stops often belong to a different owner than breakdowns — usually process engineering rather than maintenance.
Track recovery over weeks, not days
Hidden loss reduction shows up gradually — measure the trend over a rolling four-week window rather than day to day.
Frequently Asked Questions
How much of a typical plant's total loss is actually hidden?
Micro-stops under five minutes alone commonly account for eighteen to thirty-eight percent of total production losses depending on the sector and process type, and that figure rarely includes gradual speed loss or unattributed cascade failures on top. Plants moving from paper-based to automated, sensor-based measurement typically discover five to fifteen percentage points of previously invisible OEE loss within the first month of capture.
Why don't operators just log micro-stops manually if they're that significant?
The practical reason is volume and judgment. A line can generate dozens of sub-five-minute stops in a single shift, and an operator focused on running the line reasonably deprioritizes logging a twenty-second sensor fault. Manual logging also introduces inconsistency — one operator's "not worth logging" threshold differs from another's, which is exactly why automated sensor capture produces more reliable data than asking people to record every event by hand.
How do you tell the difference between a real speed loss and normal cycle variation?
The distinction comes from comparing actual cycle time against the ideal cycle time consistently over a rolling window rather than looking at any single cycle in isolation. Genuine speed loss shows up as a sustained downward trend or a persistent gap below the ideal rate, while normal variation oscillates around the ideal without a clear directional drift — statistical control charting on the cycle-time data separates the two reliably.
Can hidden loss identification work retroactively on historical data, or does it require new sensors?
It depends on what data the line already generates. If PLC or controller logs already timestamp state changes, historical hidden-loss analysis is often possible without new hardware — the gap is usually in the analytics layer, not the sensors. Lines without any automated state capture do need a sensor or PLC integration project before hidden losses can be measured going forward.
What's the fastest way to find out how much hidden loss exists on our line?
A short diagnostic period — typically two to four weeks of automated capture layered onto the existing line — is usually enough to produce a credible estimate of hidden loss as a share of total downtime. Booking a demo is the quickest path to seeing what that diagnostic would look like on your specific line configuration.
See What's Hiding Below Your Waterline
Book a 30-minute demo and find out how much micro-stop and speed loss your current reporting is missing.