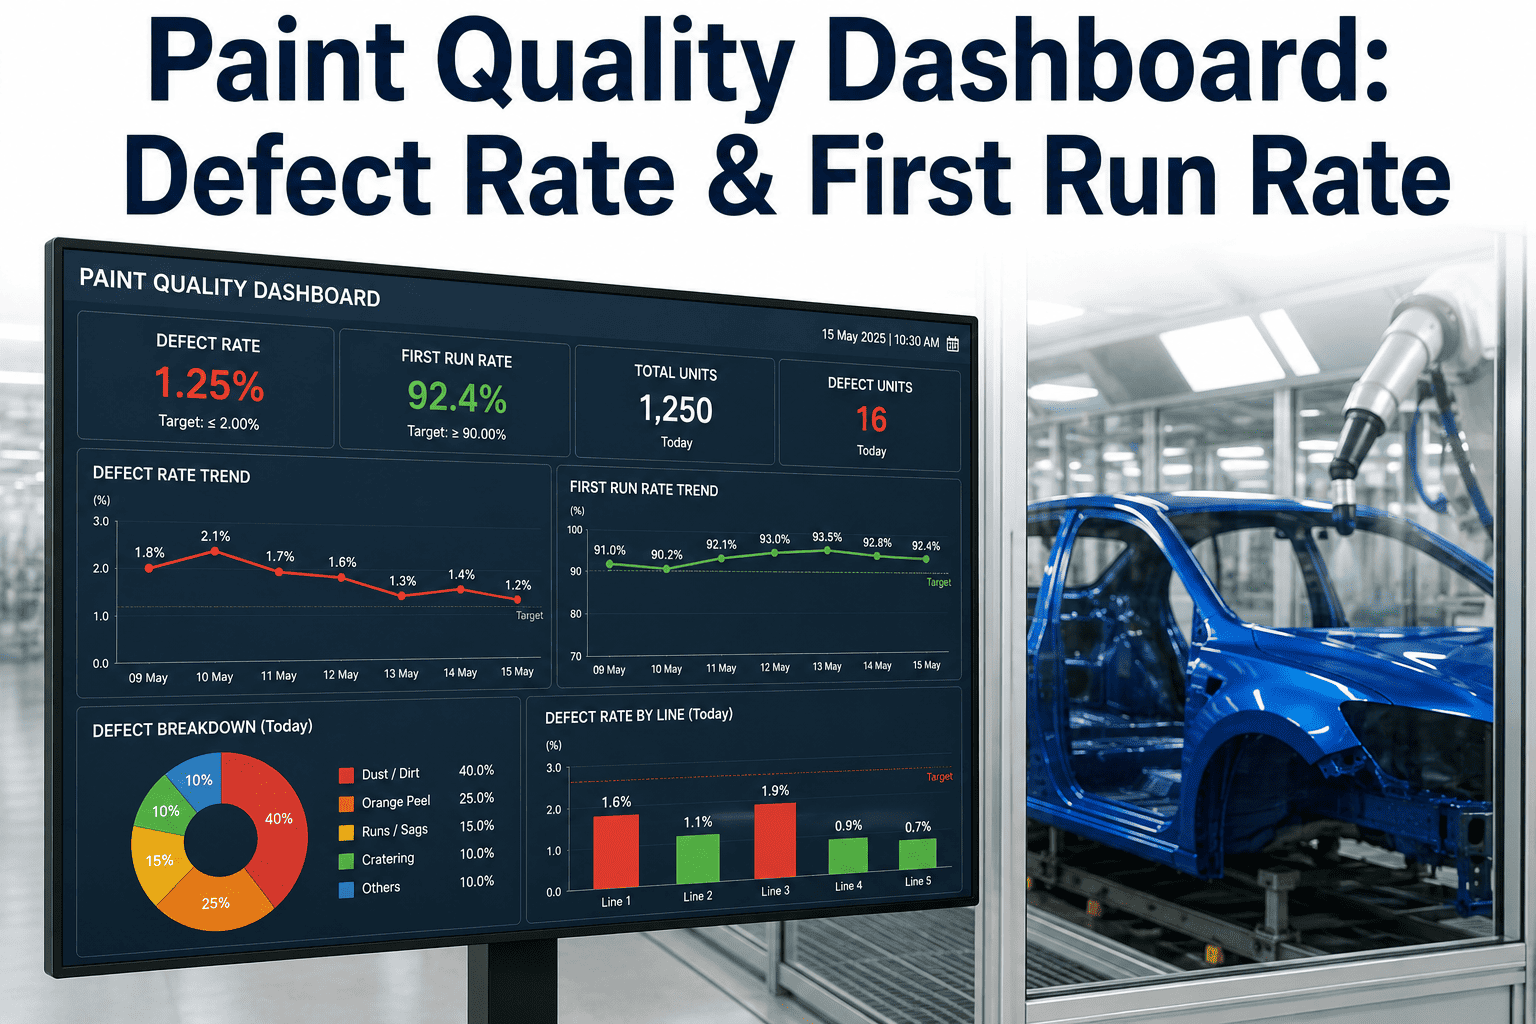
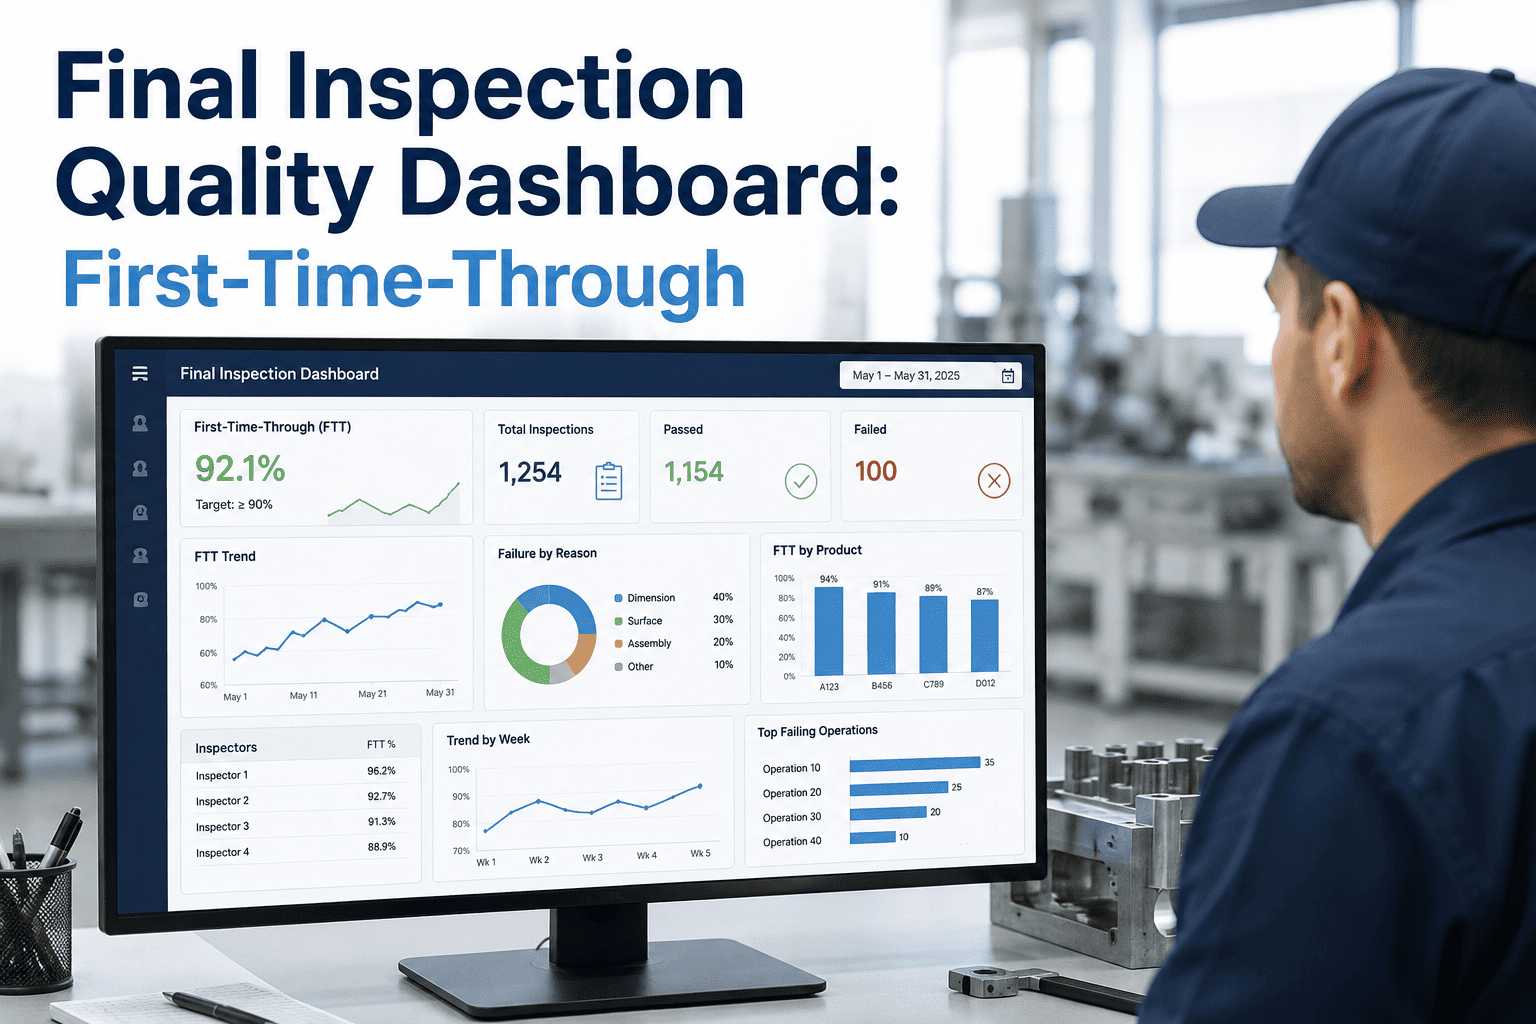
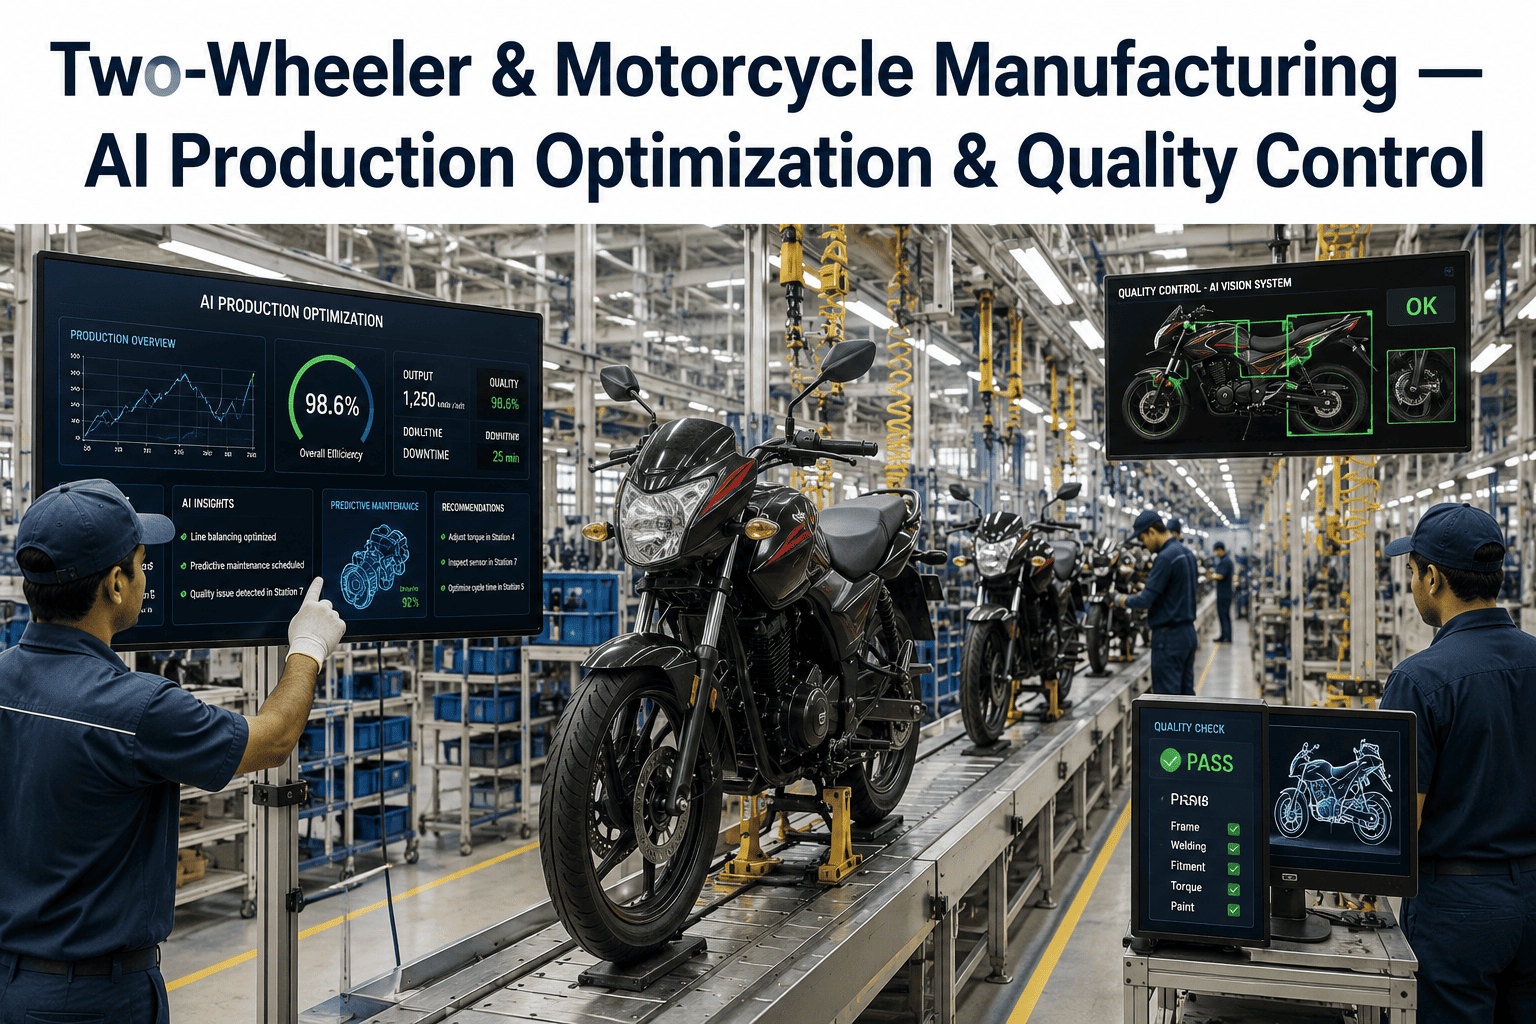
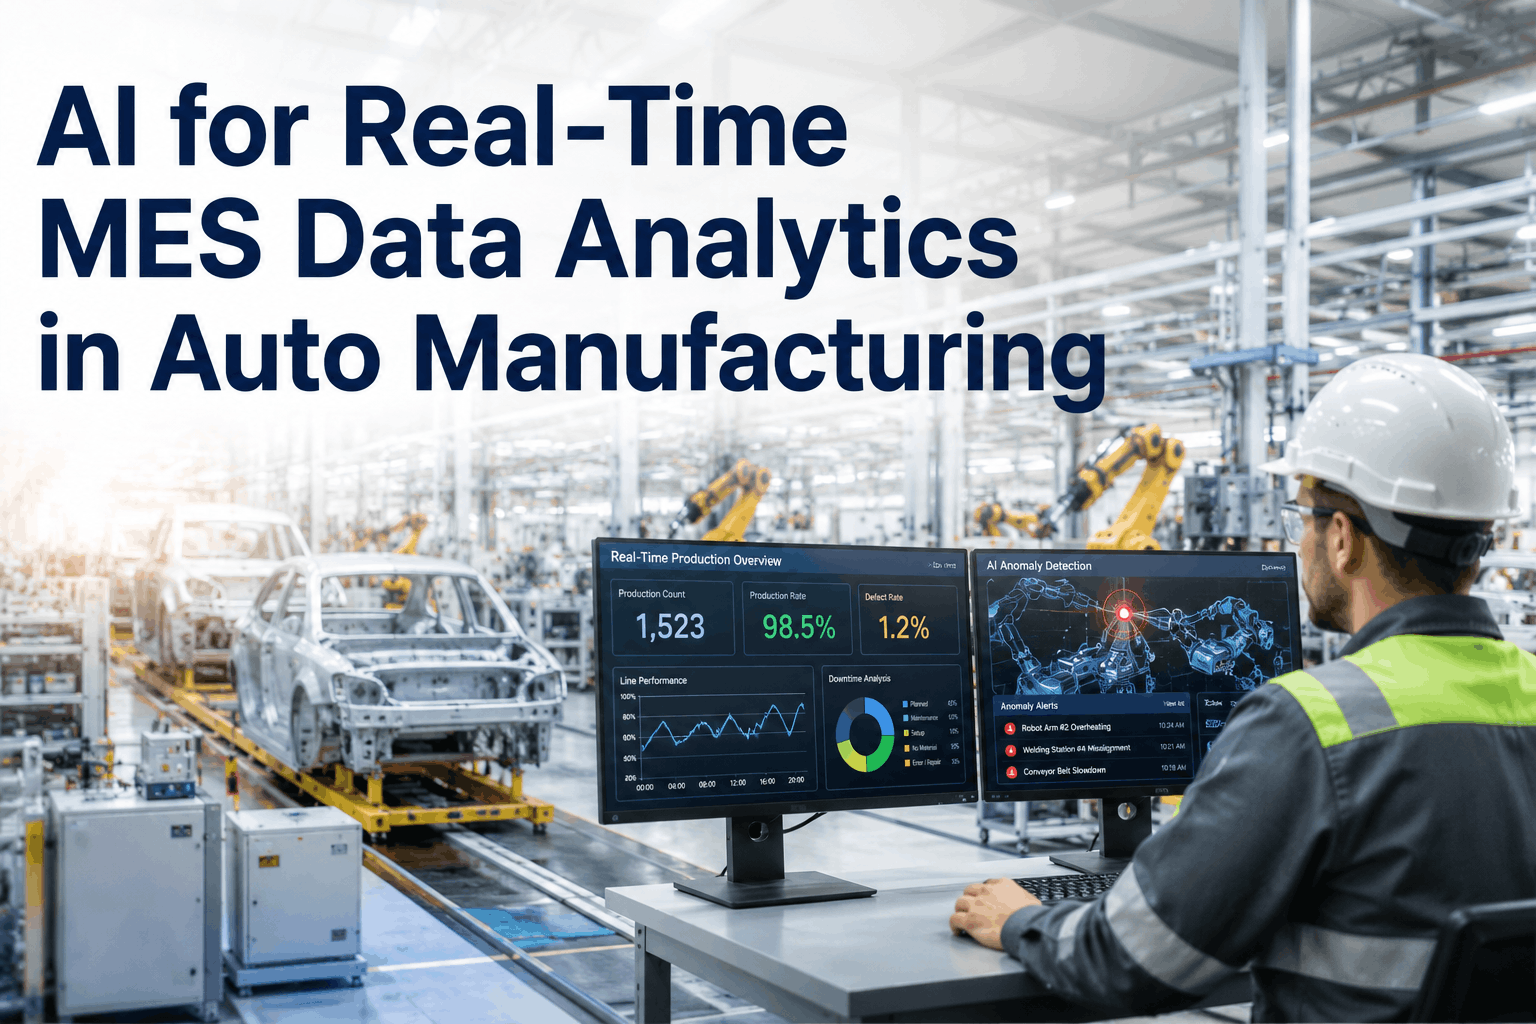
A VP of Operations overseeing six automotive plants typically finds out a plant missed its OEE target the same way everyone else does — at the monthly business review, reading a slide someone built from a spreadsheet that was already two weeks old by the time the meeting happened. Multi-plant manufacturing organizations generate enormous volumes of production, quality, and cost data every shift, but most of it stays trapped in plant-level systems that never roll up into a single view an executive can act on in real time. iFactory consolidates OEE, quality, delivery, cost, and safety data from every plant into one live intelligence layer, so the question "how are we doing right now" has an answer that doesn't require waiting for the next reporting cycle — explore the platform at iFactory support.
AI-Driven Manufacturing Intelligence · Executive Analytics
Manufacturing Intelligence Dashboards: One Live View of OEE, Quality, Delivery, Cost, and Safety Across Every Plant
iFactory pulls production, quality, and cost data from every plant's existing MES and ERP systems into one consolidated executive dashboard, refreshed continuously instead of assembled once a month for a business review.
Fleet OEE
78.4%
+2.1% vs. last week
On-Time Delivery
94.2%
+0.8% vs. target
Quality PPM
62
Plant 4 flagged
Recordable Rate
0.81
Below industry benchmark
The Executive Visibility Gap
Why Multi-Plant Data Rarely Reaches an Executive in Time to Matter
Every plant in a manufacturing network runs its own MES, quality system, and often its own spreadsheet-based reporting process, and none of them were built with a multi-plant executive audience in mind.
Reporting Cadence Mismatch
Plant-level systems produce shift and daily data, but consolidated reporting to leadership typically happens weekly or monthly, discarding the resolution that would catch a problem early.
Inconsistent Metric Definitions
One plant's OEE calculation may include planned downtime differently than another's, making a cross-plant comparison misleading unless every metric is normalized to the same definition.
Manual Roll-Up Labor
Someone, somewhere, is manually copying numbers from plant reports into a corporate spreadsheet every reporting cycle, and that process itself introduces delay and transcription risk.
No Drill-Down Path
A summary slide showing declining OEE gives no way to trace the number back to the specific line or shift driving the change without a separate follow-up request to the plant.
How the Intelligence Layer Works
From Plant Floor Data to Executive Dashboard, With a Full Drill-Down Path
1
Multi-System Integration
Data connects from each plant's MES, ERP, and quality management system through standard integration methods, without requiring plants to change their existing systems.
2
Metric Normalization
OEE, quality, delivery, and safety metrics are calculated using one consistent definition across every plant, so a cross-plant comparison is actually apples to apples.
3
Continuous Refresh
The executive dashboard updates continuously as shift data comes in, replacing a monthly snapshot with a live picture of network performance.
4
Drill-Down Navigation
Any network-level metric can be drilled into down to the plant, line, and shift level, so a question raised in a review meeting can be answered on the spot.
Your Plants Generate the Data Every Shift. Your Leadership Team Shouldn't Have to Wait a Month to See It.
iFactory consolidates every plant's production, quality, and cost data into one continuously refreshed dashboard built for executive decision-making.
Monthly Reports vs. Live Intelligence
Executive Visibility — Spreadsheet Roll-Ups vs. iFactory Manufacturing Intelligence
Function
Manual Monthly Roll-Up
iFactory Manufacturing Intelligence
Data Currency
Reflects the prior reporting period, often two to four weeks old by review time
Refreshed continuously as shift data comes in from every connected plant
Cross-Plant Comparison
Skewed by inconsistent metric definitions between plant reporting systems
Normalized to one consistent calculation method across every plant
Drill-Down Capability
Requires a follow-up request to the plant to explain a summary number
Available immediately, down to the specific line and shift level
Roll-Up Labor
Manual data entry and spreadsheet consolidation every reporting cycle
Automated data connection eliminates manual roll-up work entirely
Anomaly Detection
A plant's declining performance surfaces only at the next scheduled review
Flagged as it happens, with alerts routed to the relevant plant and functional leader
Measured Outcomes
What Operations Leaders Report After Deploying a Unified Intelligence Layer
70%
Less Time Spent Building Reports
Operations and finance teams report a major reduction in hours spent manually consolidating plant reports into executive-ready formats.
Real-Time
Dashboard Refresh Rate
Fleet-wide OEE, quality, delivery, and safety metrics update continuously rather than on a scheduled reporting cycle.
3–5 wks
Faster Identification of Underperforming Plants
Executives report catching a declining plant trend this much sooner than under a monthly business review cadence.
100%
Metric Consistency Across Plants
Every plant's OEE, quality, and delivery figures are calculated using the same normalized definition, eliminating comparison ambiguity.
Seconds
Drill-Down Response Time
A network-level metric can be traced to the specific plant, line, and shift driving it without leaving the dashboard.
2–4 wks
Typical Deployment Timeline
Time from integration kickoff to a live consolidated dashboard, depending on how many plants and source systems are connected.
Field Case
Catching a Delivery Performance Decline Three Weeks Before the Next Business Review
A multi-plant automotive components manufacturer running monthly operations reviews had no visibility into a gradual decline in on-time delivery performance at one plant until the review deck was assembled — by which point the trend had been building for nearly a month. After deploying a live consolidated dashboard, the same delivery metric was flagged as trending below target within days of the pattern starting, giving the VP of Operations time to schedule a direct conversation with the plant manager and address a root cause tied to a supplier delay well before it affected the following month's shipments. The plant recovered to target performance before the issue would have even appeared on the next scheduled review.
~3 weeksEarlier detection vs. monthly review cadence
1Root cause identified and addressed
0Shipment impact to downstream customers
Frequently Asked Questions
Manufacturing Intelligence Dashboards — What Executives Ask First
Which systems does iFactory need to connect to for a multi-plant dashboard?
iFactory connects to each plant's existing MES, ERP, and quality management systems through standard API or database integration, pulling production, downtime, quality, and cost data without requiring any plant to change or replace its current systems. Where plants run different MES platforms from one another, which is common in organizations that have grown through acquisition, the integration layer normalizes the incoming data to a consistent metric definition before it reaches the executive dashboard.
Book a Demo to review your specific system landscape across plants.
How does the dashboard normalize metrics across plants that calculate OEE differently?
Each plant's data is mapped to a single standardized OEE, quality, and delivery calculation methodology during integration, so that differences in how individual plants historically classified planned versus unplanned downtime, for example, don't distort a cross-plant comparison. Plants can still view their own metrics using their historical local definition if needed for internal continuity, while the executive-level rollup always reflects the normalized, comparable figure.
Can different roles see different levels of detail on the same dashboard?
Yes — the dashboard is built with role-based views, so a VP of Operations sees a network-level summary by default while a plant manager logging into the same platform sees their plant's detailed line and shift-level data first. Drill-down access is available to any authorized user regardless of their default view, and permissions can be configured to match existing organizational reporting lines and data access policies.
Does this require a separate data warehouse or IT infrastructure project?
No — iFactory's integration layer handles the data consolidation and normalization without requiring the manufacturer to build or maintain a separate data warehouse. This significantly shortens the typical deployment timeline compared to a traditional business intelligence infrastructure project, since the heavy lifting of connecting disparate plant systems and reconciling metric definitions is handled as part of the platform itself.
Contact support to review the technical integration approach for your environment.
How long does it take to get a multi-plant dashboard live?
For a network of plants running common MES and ERP platforms with existing data connectivity, a live consolidated dashboard typically takes two to four weeks from integration kickoff, covering system connection, metric normalization, and validation against existing plant reports. Larger networks with a wider mix of source systems, or plants with limited existing data connectivity, generally take six to ten weeks.
Book a Demo for a timeline specific to your plant network.
Stop Waiting for the Monthly Review to Find Out How Your Plants Are Actually Performing.
A live, consolidated manufacturing intelligence dashboard covering OEE, quality, delivery, cost, and safety across every plant — live in as little as two weeks.