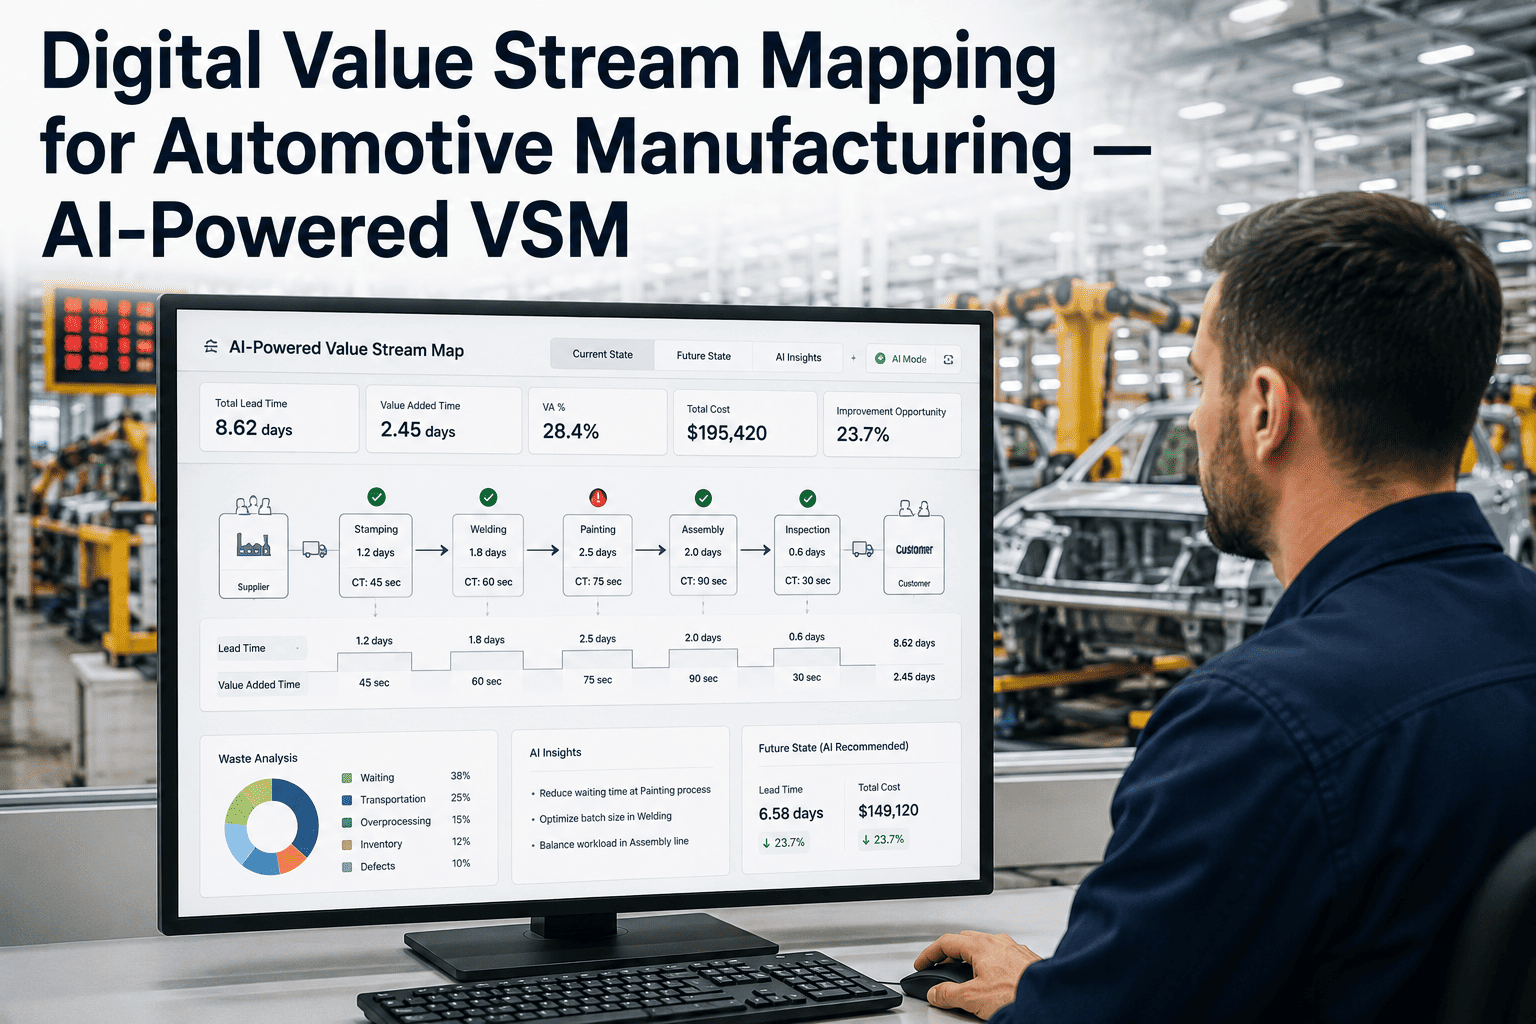
Every plant manager who has pitched an OEE dashboard to finance has heard the same question back: what does it actually return? It's a fair question, because a dashboard on its own doesn't make a single part faster — its value comes entirely from the decisions it changes and the minutes it recovers. Quantifying that value takes more than a vague "improves visibility" claim; it takes a defensible model built on capacity recovered, response time cut, and quality caught earlier. This guide breaks that model down step by step so the next capital request comes with numbers finance can actually evaluate — and if you'd like that math run against your own plant's figures, book a session with iFactory.
Turn Production Visibility Into a Number Finance Trusts
Real-time OEE visibility recovers capacity that already exists on your line — this guide shows exactly how to calculate what that capacity is worth.
The Hidden Factory: Capacity You Already Own
Most automotive plants run somewhere between the 60% median OEE and the 75–85% top-quartile range documented across the industry. That gap — often 15 to 25 percentage points — is what's often called the hidden factory: production capacity the plant already paid for in equipment and labor, sitting unconverted into good output because losses go unseen until a weekly or monthly report surfaces them.
A line running 55,000 units per month at 62% OEE with a realistic 78% segment target has roughly 26% more capacity sitting unconverted — without adding a single machine hour.
The Three Value Streams a Dashboard Actually Delivers
An ROI case built on "better visibility" alone rarely survives a finance review. Break the value into three streams that each map to a specific, measurable mechanism.
Faster response to stops
A live alert cuts the gap between a stoppage starting and a person responding, versus discovering it at shift-end review. Even a 10-minute reduction per stop across dozens of daily events compounds into meaningful recovered output.
Fewer repeat losses
Ranked, visible loss data lets maintenance and engineering fix root causes before a pattern repeats for the tenth time, instead of the first time it shows up buried in a monthly spreadsheet.
Earlier quality catch
Quality drift visible in real time gets contained before an entire shift's output is at risk, reducing scrap and rework volume compared to catching the issue at end-of-line inspection.
See What This Model Looks Like on Your Line
iFactory builds this ROI case using your actual OEE baseline and loss data — no generic industry assumptions.
A Worked Example: What One OEE Point Is Worth
The clearest way to make the case land with finance is to convert a single OEE percentage point into a dollar figure specific to your line. The steps below walk through the logic without requiring a finance background to follow.
Start with scheduled run time
Take the line's total scheduled production hours for the period — a month is a practical unit for this exercise.
Apply the ideal cycle rate
Multiply scheduled hours by the line's designed units-per-hour rate to get theoretical maximum output for the period.
Convert one OEE point into units
One percentage point of OEE equals one percent of that theoretical maximum — for a line capable of 50,000 units a month, that's 500 units per point.
Apply contribution margin
Multiply those recovered units by the per-unit contribution margin — the value of output that would otherwise require new capital to produce.
Visibility Investment vs. Capital Equipment
The strongest part of the ROI case is often the comparison against the alternative: buying more capacity outright versus converting capacity that already exists.
Frequently Asked Questions
How quickly does an OEE dashboard typically pay for itself?
Most automotive plants see measurable OEE gains within the first 30 to 60 days of moving from manual or batch reporting to real-time visibility, largely because the first thing a live feed does is surface losses that were previously invisible — often five to fifteen percentage points worth. Full payback timing depends heavily on the line's contribution margin per unit, but plants starting from a genuine 55–65% baseline commonly see payback inside two to four months once the recovered capacity is converted into shippable output.
Is the ROI different for a high-volume line versus a low-volume specialty line?
Yes, meaningfully. High-volume lines convert each OEE point into a larger absolute unit count, so the dollar value per point tends to be higher in raw terms. Low-volume specialty lines see a smaller absolute gain per point but often start from a lower baseline with more headroom, and the visibility itself carries additional value in quality traceability that doesn't show up in the unit-count math alone.
What's the biggest mistake plants make when building the ROI case?
Using a generic industry percentage instead of the plant's own measured baseline. A finance team will trust a case built on the line's actual scheduled hours, ideal cycle rate, and contribution margin far more than one that cites an industry average improvement figure. The baseline measurement step is what makes the rest of the case credible.
Does the ROI model need to account for the cost of the dashboard itself?
Absolutely — a credible ROI case nets the software, integration, and any hardware sensor cost against the recovered capacity value, rather than presenting only the upside. Presenting a fully netted figure, even a conservative one, holds up far better under finance scrutiny than an unqualified gross benefit number.
Can this ROI model be built before we've deployed anything?
Yes — the model only requires your current scheduled hours, ideal cycle rate, an honest current OEE estimate, and contribution margin, all of which most plants already have on hand even without a live dashboard in place. A pre-deployment estimate is exactly what most finance teams want to see before approving the project, and it's a straightforward exercise to work through in a short call.
Build Your ROI Case With Real Numbers
Book a 30-minute session and leave with an ROI model built on your line's actual scheduled hours, OEE baseline, and contribution margin.