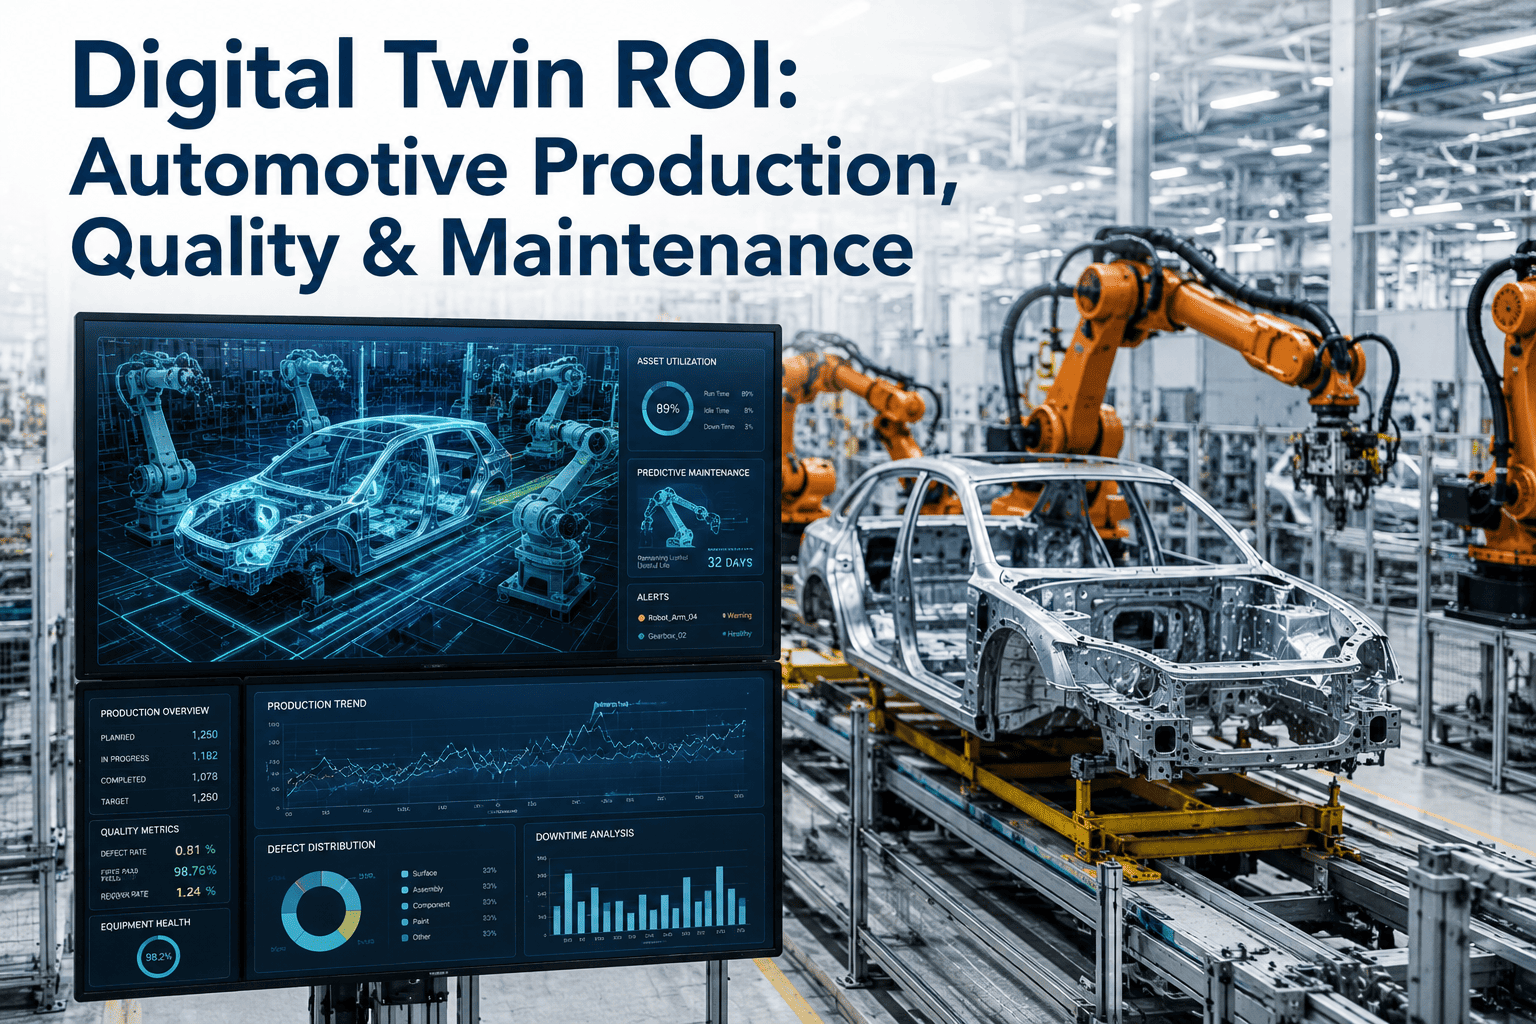
A digital twin project pitched as "a virtual replica of the production line" rarely survives a capital committee, because that description doesn't answer the only question that matters to whoever signs the check: what does it return. The honest answer is that a digital twin pays back through three separate, independently measurable levers — production throughput, quality yield, and maintenance cost — and a business case that prices all three, rather than leaning on one impressive-sounding number, is the one that actually gets approved. iFactory builds that three-lever model from your own plant data, not a single industry benchmark.
A Digital Twin Doesn't Pay Back Once. It Pays Back Three Times, From Three Different Places.
Production optimization, quality improvement, and maintenance cost reduction are three separate, independently verifiable savings streams — and a credible digital twin business case prices each one on its own rather than folding them into a single vague number.
Three Levers, Three Different Financial Stories
Most digital twin pitches lead with one lever — usually maintenance, because avoided downtime is the easiest story to tell — and leave the other two as an afterthought. That's a missed opportunity in the business case itself, since production and quality improvements often carry a larger annual value than maintenance savings alone, particularly on a high-volume automotive line where a single percentage point of throughput is worth far more than it looks on paper.
The reason all three levers deserve separate treatment rather than a single combined pitch is that they get validated differently and by different stakeholders. A plant manager can sanity-check a production throughput projection against their own OEE tracking. A quality director can check a defect reduction estimate against existing scrap and warranty records. A maintenance manager can verify an emergency repair premium against their own work order history. Presenting one number asks a single reviewer to trust the whole model; presenting three lets each stakeholder validate the piece they actually know best.
Throughput & Bottleneck Elimination
A process-level twin simulates flow, identifies the true constraint on the line, and tests schedule or sequencing changes virtually before committing to a physical change.
Defect Rate & Yield Improvement
Correlating process parameters against quality outcomes in the twin surfaces which specific conditions produce defects, turning quality control from inspection-after-the-fact into process correction beforehand.
Downtime Avoidance & Asset Life
An asset-level twin models degradation against live sensor data, converting unplanned failures into scheduled work and extending the useful life of major equipment.
The ROI Formula, and Why It Needs Three Separate Line Items
A single blended ROI percentage is easy to present but hard to defend, because a finance team reviewing it has no way to tell which part of the projection is solid and which part is optimistic. Breaking the formula into its three source levers turns one number a committee has to trust into three numbers they can each individually stress-test.
Total ROI (%) = (Production Value + Quality Savings + Maintenance Savings − Platform Cost) ÷ Platform Cost × 100
Automotive assembly plants running 24-hour, multi-shift operations at high fixed cost per hour are precisely the environment where this three-lever structure delivers the clearest financial case, because a modest percentage improvement in any one lever compounds against a very large base of annual production value.
One Blended ROI Number Is Easy to Doubt. Three Sourced Numbers Are Easy to Approve.
iFactory helps price production, quality, and maintenance savings separately, using your plant's own OEE, defect, and downtime data.
Lever One: Production — What a Single OEE Point Is Actually Worth
Overall Equipment Effectiveness is the metric most plant managers already track, which makes it the easiest lever to build a defensible twin business case around — the baseline data typically already exists, it just hasn't been priced in dollar terms before.
The conversion from OEE percentage to dollar value is the step most internal pitches skip, and it's a short one once daily production value per vehicle is known. A plant losing 107 vehicles a day to downtime, inefficiency, and quality issues isn't losing an abstract percentage — it's losing a specific number of saleable units every single day, each carrying the plant's actual per-unit margin. Multiplying that gap by 250-plus operating days a year turns an OEE improvement target into an annual figure large enough to anchor an entire business case on its own.
| Input | Baseline | With Digital Twin |
|---|---|---|
| Daily Vehicle Output | 400 vehicles/day | Increased via bottleneck elimination |
| OEE | 72% | Targeting 85-87% |
| Vehicles Lost to Downtime/Inefficiency | ~107/day | Substantially reduced |
| Daily Value per Vehicle | Plant-specific margin figure | Same figure, applied to added capacity |
A process-level twin's core value here is virtual testing — simulating a sequencing change, a buffer adjustment, or a shift pattern change inside the model before committing capital or floor time to it physically, which converts what used to be a costly trial-and-error improvement process into a low-risk simulation exercise that only implements changes already validated to work.
Lever Two: Quality — Correcting the Process Instead of Catching the Output
A quality-focused digital twin shifts the entire logic of defect prevention. Traditional inspection catches a defect after it's already been produced; a twin that correlates live process parameters against quality outcomes can flag the drifting condition — a temperature trending outside spec, a pressure variance on a specific station — before it produces a defective part at all.
This distinction matters more in automotive than in most manufacturing sectors because the downstream cost curve for an escaped defect is unusually steep — a caught-in-process correction costs a fraction of the same defect surfacing as a warranty claim, and a small fraction again of what it costs if the pattern is severe enough to become a recall consideration. A quality lever priced only on immediate scrap reduction, without accounting for that steep downstream cost avoidance, is almost always understating its own value.
Root Cause Correlation
The twin links specific process parameters to specific downstream defect patterns, turning a vague quality problem into a targeted process adjustment.
Simulated Process Changes
A proposed process adjustment can be tested against the twin's historical defect correlation data before it's ever applied to a live production line.
Scrap and Rework Reduction
Catching drift before it produces a defect avoids the scrap, rework labor, and line disruption a downstream catch would have caused instead.
The financial case here compounds with the production lever rather than competing with it — fewer defects means fewer units pulled off the line for rework, which independently improves effective throughput on top of whatever bottleneck elimination the production lever already delivered.
Lever Three: Maintenance — Where the Emergency Premium Actually Comes From
Maintenance is the lever most digital twin pitches lead with, and for good reason — it's the most immediately intuitive to a plant floor audience. The financial mechanism is specific: emergency repairs consistently run at a documented multiple of planned repair cost, driven by overtime labor rates, expedited parts procurement, and the secondary damage an in-progress failure often causes before a technician arrives.
A plant with a large annual maintenance budget and a meaningful share of that spend still classified as emergency work is sitting on one of the more straightforward wins in this entire model, because the fix doesn't require new capital equipment — it requires converting unplanned failures into planned ones through earlier detection, which is exactly what an asset-level twin modeling live degradation against a physics-based failure curve is built to do.
Equipment runs until failure, then an emergency repair crew responds under time pressure
Emergency labor, rushed parts sourcing, and secondary damage typically run 3.5 to 4.5 times the cost of the same repair performed as planned work
The asset-level twin models degradation against live sensor data and predicts a specific failure window
The repair moves to a scheduled maintenance window with parts pre-staged, avoiding the emergency premium entirely
Beyond the immediate repair cost differential, running equipment at its optimal operating conditions — the correct speed, temperature, and pressure a twin can continuously verify — measurably slows wear rates on major assets, which defers capital replacement by extending useful equipment life and pushes a significant capital expense further into the future than it would otherwise occur.
The Emergency Repair Premium Is the Single Costliest Line in Most Maintenance Budgets
iFactory's digital twin converts emergency failures into scheduled work orders, eliminating the labor and parts premium that comes with reactive repair.
Pricing the Platform Investment Honestly
A credible digital twin business case prices the investment side with the same specificity as the three savings levers, rather than a single vague figure. A production-grade deployment typically spans sensor and connectivity infrastructure, the digital twin platform itself, integration with existing SCADA, MES, and historian systems, and the implementation labor to build and validate the initial model against real plant data.
| Cost Component | Timing | What It Covers |
|---|---|---|
| Sensor & Connectivity Infrastructure | One-time, Year 1 | IoT sensors and data pipelines feeding the twin in near real time |
| Digital Twin Platform | Annual, recurring | Software licensing for the modeling, simulation, and analytics layer |
| SCADA/MES/Historian Integration | One-time, Year 1 | Connecting the twin to systems of record already running the plant |
| Model Build & Validation | One-time, Year 1 | Constructing and validating the twin's model against historical plant data |
Starting with a single high-impact line or asset as a pilot, rather than a full-plant deployment on day one, keeps the initial investment figure modest and gives finance a proven result to expand from — a pattern that shows up consistently across successful digital twin rollouts regardless of industry.
Why the Pilot Scope Matters as Much as the Business Case Math
The financial model can be perfectly sound and still fail to get approved if the proposed scope feels too large a first step. A full-plant digital twin covering every line, every asset, and every quality checkpoint is a compelling long-term vision, but it's also a much harder capital request to approve than a pilot scoped to the single line or asset where the business case is strongest.
Larger upfront investment before any result has been demonstrated
Longer time to first measurable outcome, delaying the proof point finance wants to see
Harder to isolate which specific change drove which specific result
Modest initial investment scoped to the highest-value line or asset
Faster time to a documented, verifiable result
A proven pilot becomes the evidence base for approving the larger rollout
This sequencing pattern — prove on one line, then scale — shows up consistently across successful digital twin rollouts, largely because it converts an internal capital decision from a leap of faith into a straightforward extension of something the organization has already seen work.
A Composite Scenario: The Bottleneck Nobody Could See Until It Was Simulated
A composite mid-size automotive assembly plant running 400 vehicles a day at 72% OEE had spent over a year attributing its throughput ceiling to a specific final-assembly station widely assumed to be the constraint, based on where visible queues tended to form. A pilot digital twin covering the full assembly line, built from six months of existing PLC and MES data, modeled the actual flow of work-in-process through every station rather than relying on where queues were visually observed.
The simulation identified a different, less visually obvious station — a torque verification step two stations upstream — as the actual binding constraint, with the visible queue at final assembly merely a downstream symptom rather than the root cause. Testing a sequencing adjustment in the twin before touching the physical line showed a projected throughput gain, which the plant then implemented physically and confirmed against the simulation's prediction within a few percentage points. The correction added meaningful daily saleable capacity without any new capital equipment, using a change the plant would very likely never have identified through direct floor observation alone.
Assumptions That Undercut a Digital Twin Business Case
Maintenance savings alone are enough to justify the investment, so production and quality don't need separate modeling.
Production and quality improvements frequently carry a larger annual value than maintenance savings on a high-volume line, and leaving them out of the model understates the case rather than simplifying it.
A full-plant twin needs to be built before any ROI can be demonstrated.
A pilot scoped to a single high-impact line or asset proves the model and produces a verifiable result far faster than a full-plant build, and that proven pilot is what typically unlocks approval for the larger rollout.
The plant's own historical data isn't clean or complete enough to build a useful twin model.
Existing PLC, MES, and maintenance log data, even when imperfect, is usually sufficient to build a directionally useful initial model, with accuracy improving as live sensor data accumulates after deployment.
A Checklist Before the Digital Twin Case Goes to Finance
Production, quality, and maintenance savings are modeled as separate line items
A single blended figure is harder to defend than three individually sourced numbers a committee can question one at a time.
The pilot scope is a single high-impact line or asset, not the full plant
A focused pilot proves the model faster and at lower initial cost, building the track record that justifies a larger rollout.
The investment side lists platform, integration, and hardware separately
A broken-out cost table is easier for finance to verify than a single bundled total.
Existing PLC, MES, and maintenance data has been assessed for the initial model
Most plants already have enough historical data to start, and confirming that early avoids an unnecessary data-collection delay before the pilot begins.
Frequently Asked Questions
How long does a typical automotive digital twin deployment take to show payback?
Documented automotive deployments commonly show measurable return within 6 to 12 months, with the specific timeline depending heavily on the pilot's scope and how much of the three-lever savings model — production, quality, and maintenance — the initial deployment targets. Visit support to scope a realistic timeline for a specific line.
Which of the three levers typically delivers the fastest measurable result?
Maintenance savings from avoided emergency repairs are often the fastest to show up in a plant's records, since the cost differential between planned and emergency work is immediate and easy to track, while production and quality gains from process changes sometimes take a few additional months to fully materialize and stabilize.
Does a digital twin require replacing existing SCADA and MES systems?
No — a production-grade twin platform is built to integrate with existing SCADA, MES, and historian systems rather than replace them, pulling data from what's already running the plant instead of requiring a separate systems overhaul. Book a demo to see how integration works with a specific existing stack.
How much historical data is needed before a digital twin model becomes useful?
Several months of existing PLC, MES, or maintenance log data is often enough to build a directionally useful initial model, with the model's accuracy continuing to improve as live sensor data accumulates over the following months of operation.
Should a digital twin pilot target the most visibly problematic line or the highest-value line?
The highest-value line, not necessarily the most visibly problematic one, usually produces the strongest business case, since a modest percentage improvement on a high-volume, high-margin line often outweighs a larger percentage improvement on a smaller or lower-value process. Contact support to help identify the right starting scope for a specific plant.
Price Production, Quality, and Maintenance Separately. Approve Faster.
iFactory builds digital twin ROI models from your own OEE, defect, and downtime data, giving finance three sourced numbers instead of one they have to take on faith.

.png)
