Every plant manager evaluating an AI monitoring system for their stamping operation eventually asks the same question in a boardroom: what does this actually save us, in dollars, and how fast does it pay for itself. It's a fair question, and it's also one that's harder to answer than most vendors make it sound, because the savings come from several different places at once — fewer die crashes, less scrap, fewer unplanned stoppages, and less labor spent manually inspecting parts that a camera could catch faster. Treating those as one vague "efficiency gain" number tends to underwhelm a finance team that wants to see the math, and it usually gets sent back for more detail before any budget gets approved. Breaking the same figure into its actual components — die protection, quality improvement, and downtime avoidance — is what makes a stamping AI investment defensible on its own terms rather than as a leap of faith.
Stamping AI · Investment Justification
Stamping AI Monitoring ROI: Where the Savings Actually Come From
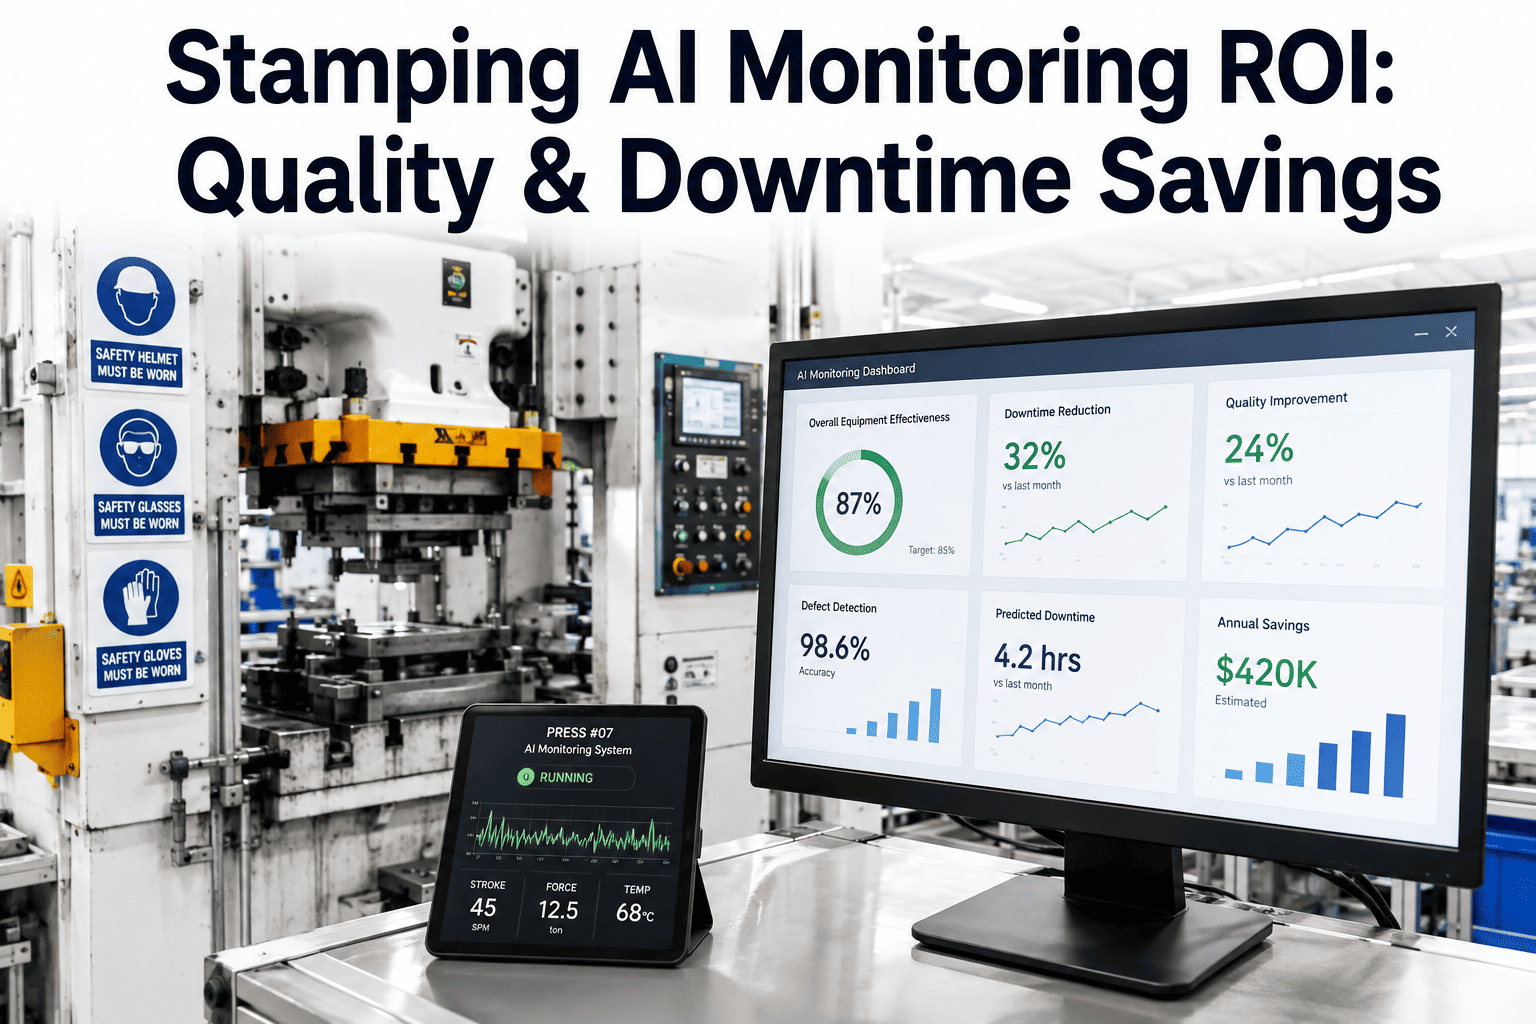
Stamping AI monitoring pays for itself through three distinct cost categories — die protection savings, quality improvement gains, and downtime reduction — and quantifying each one separately is what turns a vague efficiency pitch into a number a finance team can actually approve.
Die Protection
Fewer crashes, less tooling replacement cost
Quality Gains
Less scrap, fewer warranty escapes
Downtime Avoided
Fewer unplanned stoppages per month
The Three Savings Categories
Where a Stamping AI Investment Actually Pays Off
1
Die Protection Savings
A die crash caused by a misfeed, a double-blank, or a slug buildup is one of the most expensive single events on a stamping line, often requiring emergency tooling repair or replacement and taking the press out of production for hours or days. AI monitoring that detects these conditions in real time before impact converts a subset of what would have been crashes into simple stops, avoiding the tooling repair cost entirely and keeping the press available for the next scheduled job instead of an emergency repair queue.
2
Quality Improvement Gains
Parts with dimensional defects, surface issues, or incomplete forms that slip past manual inspection eventually surface as warranty claims, customer complaints, or costly downstream rework, all of which cost significantly more to resolve than catching the same defect at the press. Automated inspection catches a higher percentage of defects consistently, shift after shift, without the fatigue-driven variability of manual checks, which tends to decline predictably over the course of a long shift regardless of how skilled the inspector is.
3
Downtime Reduction
Unplanned stoppages from tooling issues, feed problems, or undetected wear cost more than the repair time itself once you count the lost production, the changeover to get the line running again, and the schedule disruption on downstream operations waiting on stamped parts. Predictive alerts shift a portion of that unplanned time into planned, scheduled maintenance windows instead, which are far cheaper to absorb because they can be timed around a shift change or a planned changeover rather than stopping a line mid-run.
Building the Case
A Simple Framework for Estimating Your Own Numbers
| Cost Category | What to Measure Today | What AI Monitoring Changes |
| Die crashes |
Crashes per month, average repair cost and downtime hours |
Reduces frequency by catching feed and condition issues pre-impact |
| Scrap and rework |
Scrap rate, cost per defective part, rework labor hours |
Catches more defects at the press instead of downstream |
| Warranty and recall exposure |
Field defect rate, average claim or recall cost per incident |
Reduces defect escapes reaching the customer |
| Unplanned downtime |
Stoppages per month, average duration, cost per hour down |
Converts a portion of unplanned time to scheduled maintenance |
| Manual inspection labor |
Hours spent on manual visual checks per shift |
Reallocates inspection time to higher-value tasks |
Common Mistakes
Why Some ROI Estimates Fall Apart Under Scrutiny
Using Plant-Wide Averages Instead of Press-Specific Data
A single average scrap rate across an entire stamping shop hides the fact that one or two presses usually account for a disproportionate share of the problem, and building a business case on the average understates the savings available on the worst-performing equipment while overstating them on the best. A press-by-press breakdown almost always tells a more compelling and more accurate story.
Ignoring the Cost of Downstream Rework
A defective stamped part that gets caught at final assembly or, worse, after it reaches a customer, costs far more to resolve than the same defect caught at the press. Estimates that only count the cost of scrap material at the stamping stage miss the larger downstream cost that automated inspection actually helps avoid, including labor for rework, line stoppages at assembly, and the administrative cost of processing a warranty claim.
Treating One Good Month as Representative
Die crash frequency and downtime can vary significantly month to month depending on tooling age, job mix, and maintenance timing, so basing an ROI estimate on a single unusually good or bad month tends to produce a number that doesn't hold up once real monitoring data starts coming in. A rolling average across six to twelve months gives a much more realistic baseline to build against.
Leaving Out Labor Reallocation Value
Teams sometimes focus entirely on scrap and downtime savings while overlooking that inspection labor freed up by automated checks has real value too, whether that's redeployed to process improvement work or simply reduces the need for overtime during high-volume periods. It's a smaller line item than die protection or quality gains in most cases, but it still belongs in a complete picture.
Build Your Own ROI Case
Bring Your Current Numbers, We'll Help You Model the Payback
Crash frequency, scrap rate, and average downtime cost are usually already tracked somewhere in your plant — we'll help translate them into a realistic payback estimate for AI monitoring on your specific line.
How the Detection Actually Works
What AI Monitoring Is Watching For at the Press
Sensing
Vision and Force Sensors at Critical Stations
Cameras positioned at feed and die stations, paired with force and position sensors on the press itself, capture the conditions that typically precede a crash or a defect — a misaligned blank, an object left in the die, or a force signature that deviates from the established normal pattern for that job.
Detection
Pattern Recognition Against a Known-Good Baseline
The system compares incoming sensor and vision data against a baseline built from normal, defect-free production runs, flagging deviations in real time rather than requiring a person to manually notice something looks or sounds different from usual.
Response
Alerting or Stopping Before Impact
Depending on severity and configuration, a detected anomaly either alerts an operator immediately or triggers a press stop before the stroke completes, which is the critical difference between catching a misfeed condition and cleaning up after an actual die crash has already happened.
A Composite Scenario
A Stamping Line Where the Real Cost Was Hiding in Three Places
Before
A mid-size stamping operation tracked overall equipment downtime but hadn't broken it out by cause, and scrap was recorded as a single monthly percentage without attribution to specific defect types or presses. Die crashes were treated as occasional bad luck rather than a pattern worth investigating, since no one had put a number on how often they actually happened or what each one cost in repair and lost production. The finance team had rejected two prior automation proposals because the projected savings were presented as a single round number without a clear breakdown.
After
Once AI monitoring was in place and the three cost categories were tracked separately, the plant discovered that die crashes on one specific press accounted for a disproportionate share of total unplanned downtime, and that a single recurring defect type was responsible for most of the warranty claims tied to stamped parts. Both became targeted fixes instead of a vague, unattributed downtime and scrap number that no one had been able to act on directly, and the follow-up business case for expanding monitoring to two more presses was approved on the first pass because it could point to specific, already-measured savings.
Before You Build the Case
Data to Pull Together Before Presenting an ROI Estimate
Die crash frequency and average repair or replacement cost over the last 12 months, broken out by press where possible
Current scrap rate and cost per defective part, along with the most common defect types driving it
Unplanned downtime hours per month and the fully loaded cost of an hour of lost production on that line
Recent warranty or recall costs, if any, tied back to stamped components, and the manual inspection hours currently spent per shift
Common Questions
Stamping AI Monitoring ROI — FAQ
How long does it typically take to see a return on a stamping AI investment?
It depends heavily on current crash frequency and scrap rate, since a line with frequent die crashes or a high defect escape rate sees payback faster than one that's already running relatively clean. Most plants start seeing measurable savings within the first few months as die protection alone begins reducing crash frequency, with quality and downtime gains compounding from there as more data accumulates and process adjustments get made based on what the monitoring reveals.
Our team can help model a realistic timeline against your current numbers.
Which of the three savings categories usually has the biggest impact?
It varies by plant, but die protection savings tend to show up fastest and most visibly because a single avoided crash can offset a meaningful portion of the investment on its own. Quality improvement gains and downtime reduction usually build more gradually but often add up to a larger cumulative number over a full year of operation, particularly for plants with a history of warranty claims tied to stamped components.
Do we need a full year of historical data to build an ROI case?
No, even a rough estimate from the last few months of crash logs, scrap reports, and downtime records is usually enough to build a directionally useful case. The estimate gets refined once actual monitoring data starts coming in, but you don't need perfect historical records to get started, and most plants find that gathering even partial data is a useful exercise on its own.
Does this replace our existing quality inspectors?
Not typically — most plants reallocate inspection time toward more complex judgment calls and process improvement work rather than eliminating the role, since AI monitoring is best suited to catching consistent, well-defined defect patterns at high speed rather than every possible quality issue a trained inspector might notice. The two work best as complementary layers rather than a straight replacement of one for the other.
Book a demo to see how this fits alongside your current quality team.
How is warranty and recall cost avoidance actually estimated?
It's based on your historical field defect rate and the average cost per warranty claim or recall event tied to stamped components, applied against the reduction in defect escapes that automated inspection typically achieves compared to manual checks alone. This category is often the hardest to quantify precisely but can represent the largest single savings if a plant has had a costly recall in its recent history, since a single major recall event can dwarf every other line item in the estimate combined.
Stop Estimating ROI as One Vague Number
Build a Stamping AI Business Case From Your Own Die Protection, Quality, and Downtime Data
iFactory helps plants quantify each savings category separately, turning a general efficiency pitch into a specific, defensible payback estimate your finance team can actually approve.
.png)


.png)
