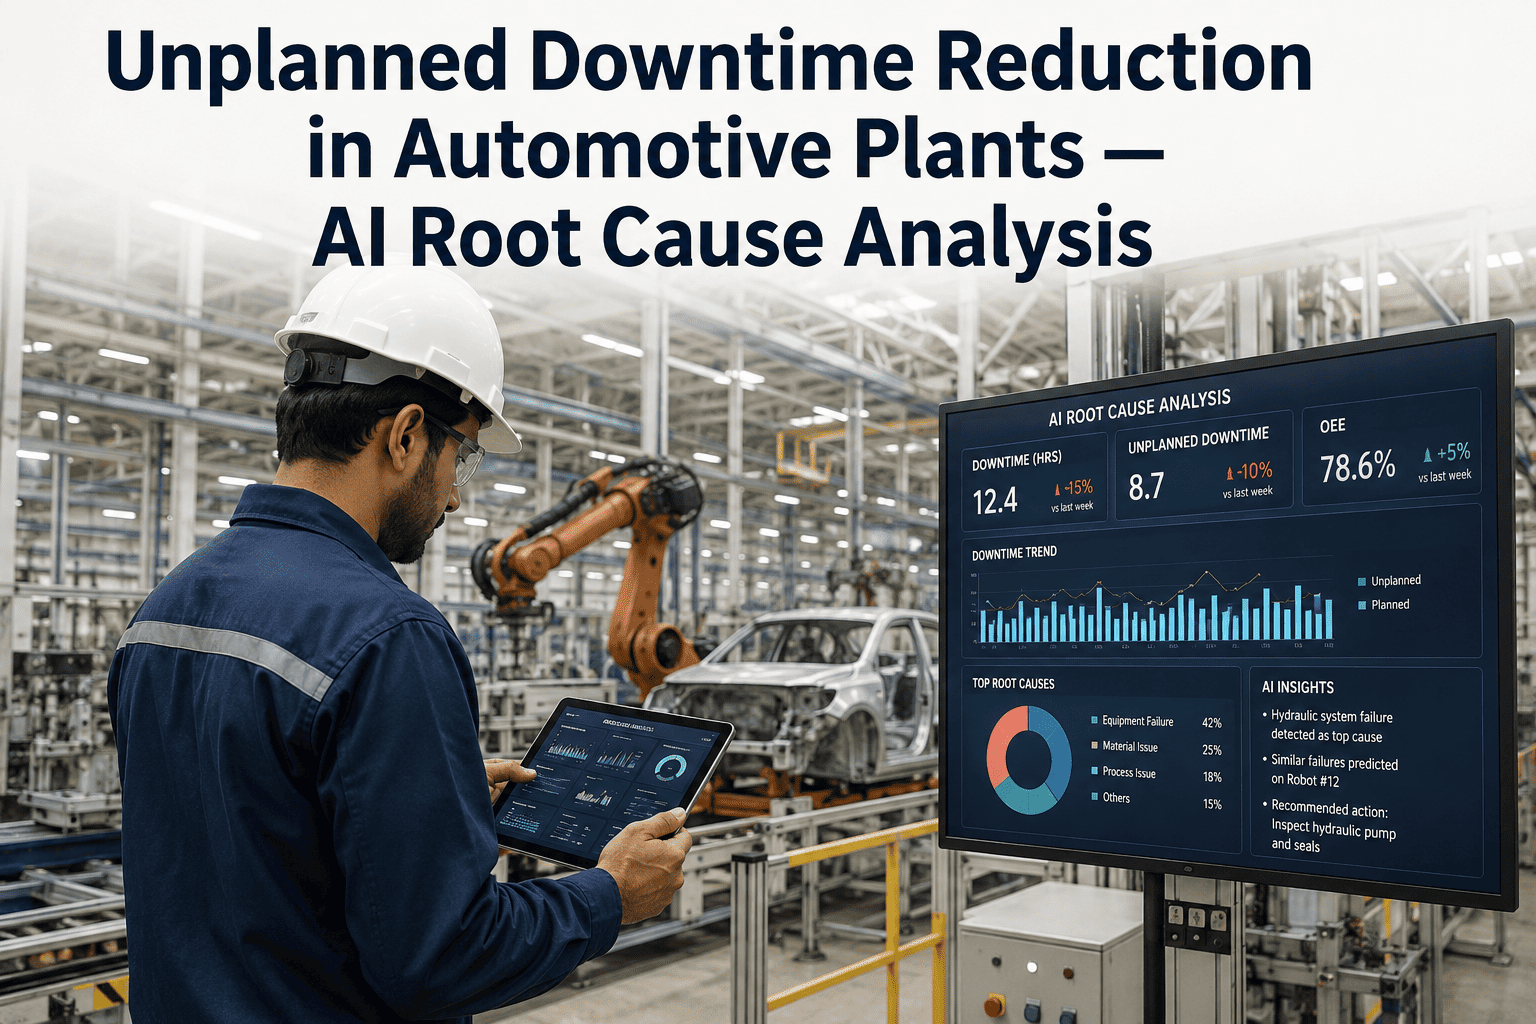
An unplanned stop on a stamping line or a final assembly conveyor rarely costs what the maintenance log suggests. Between lost throughput, overtime to recover the shift, and downstream starvation of stations further down the line, a single hour of unplanned downtime in a large automotive plant can run into the millions. Most plants already track downtime. Very few can tell you, within the first ten minutes of a stop, which of the dozen plausible causes actually triggered it. That gap between logging downtime and understanding it is exactly where Book a Demo conversations with plant managers usually start.
Find the Real Cause of a Stop Before Your Shift Loses the Hour
ifactoryApp cross-references equipment signals, maintenance history, and shift context the moment a line stops, so your team fixes the actual cause instead of the most recent symptom.
Why Unplanned Downtime Is More Expensive Than the Log Shows
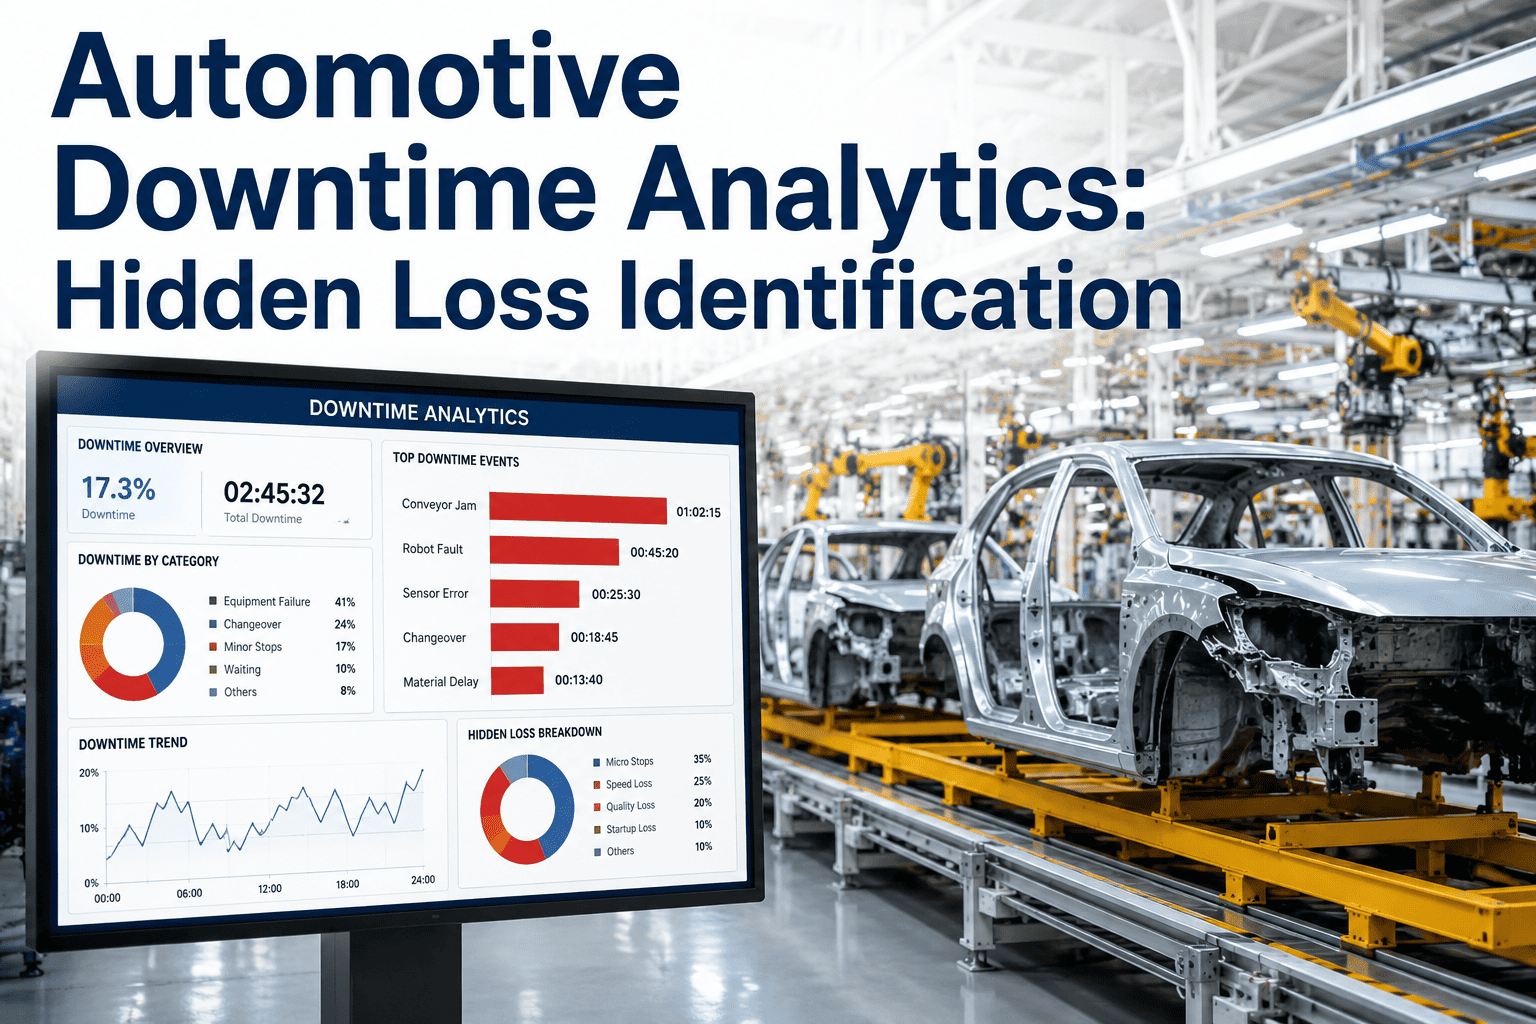
Downtime tracking in most automotive plants captures duration accurately and cause almost never. A stamping press stops, an operator logs "electrical fault" from a dropdown menu because that is the closest available category, and the actual root cause, a worn die component interacting with a marginal sensor calibration, never makes it into any system. The press gets restarted, the line resumes, and the same failure mode returns three weeks later disguised as a new incident.
This matters because the financial impact of a stop compounds far beyond the stop itself. Body shop and paint stations feeding a starved final assembly line lose throughput even while technically running. Suppliers running just-in-time delivery schedules absorb the disruption further up the chain. And maintenance teams, working from incomplete cause data, end up performing reactive repairs on symptoms rather than preventive work on the actual failure pattern, which guarantees the same category of stop keeps recurring across shifts, weeks, and eventually across sister plants running identical equipment.
Typical drop-off from stop detection to closed preventive action across manually logged downtime programs.
The Four Zones Where Downtime Root Cause Gets Lost
Downtime does not fail evenly across a plant. Certain zones consistently generate ambiguous cause data because they sit at the intersection of mechanical, electrical, and process variables that a single operator log entry cannot capture.
Stamping & Press Lines
Die wear, material variation, and press hydraulics interact in ways that produce similar-looking stops from entirely different root causes, making manual categorization unreliable across shifts.
Body Shop Weld Cells
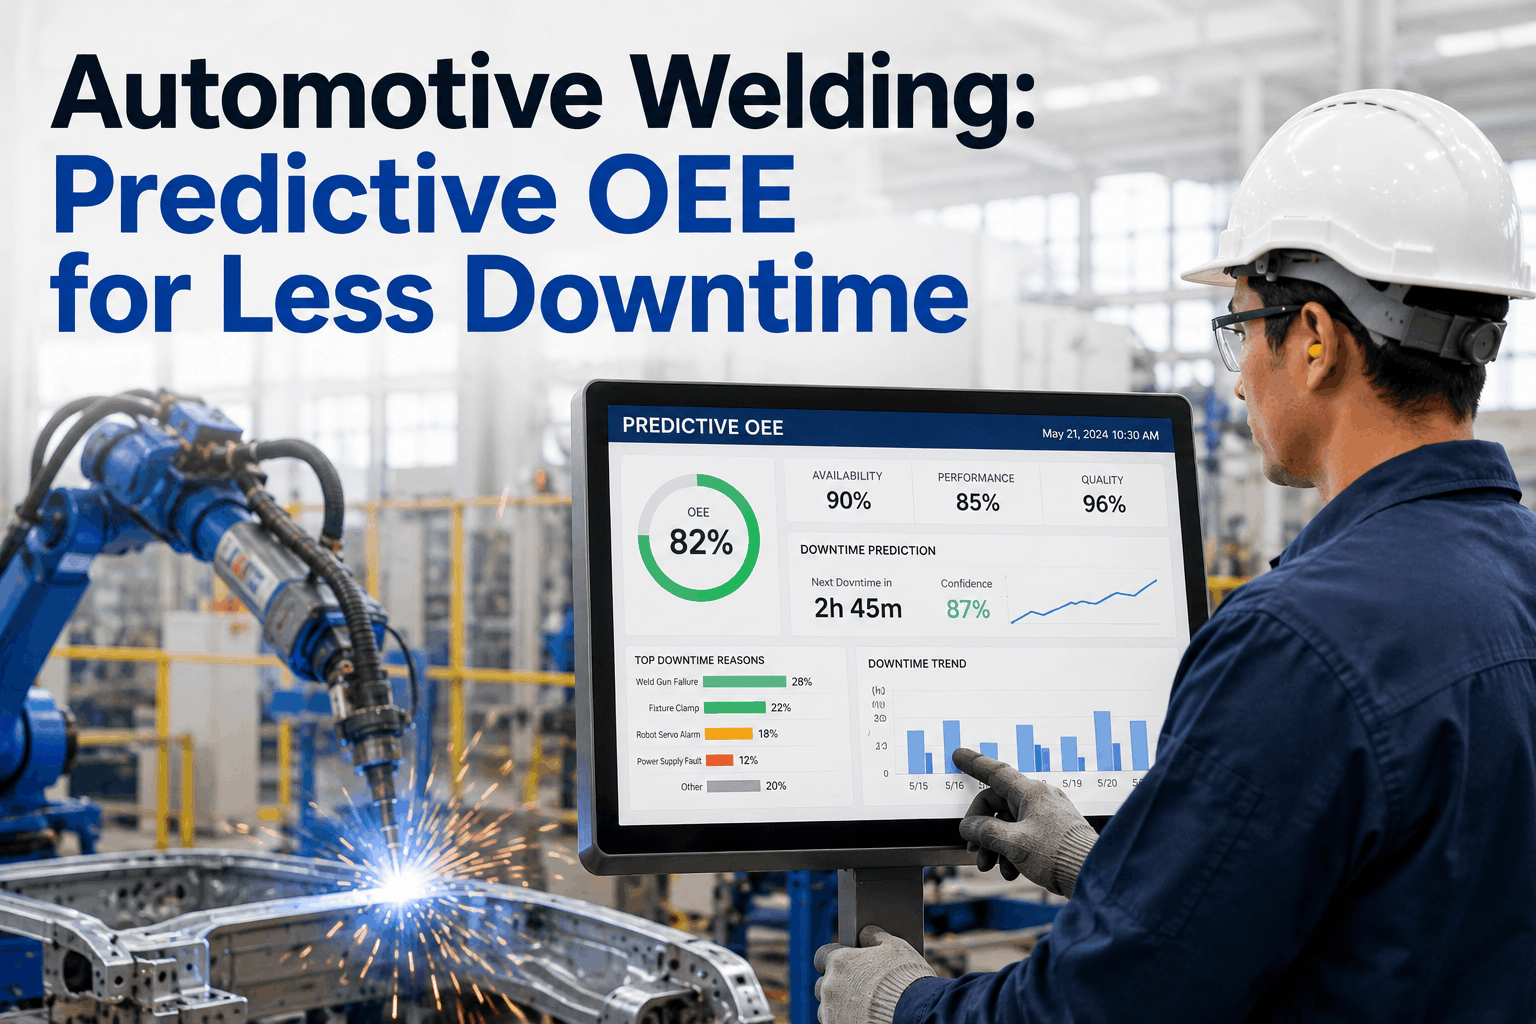
Robotic weld failures often trace back to upstream fixture drift or part variation rather than the robot itself, but operators typically log the stop against the station where it was noticed.
Paint Shop Environmental Systems
Humidity, booth pressure, and conveyor speed all influence paint defect stops, yet these variables are rarely captured together in a single downtime record.
Final Assembly Torque & Fastening
Fastening tool faults are frequently logged as tool failures when the underlying issue is a part-fit tolerance stack-up traceable to an upstream station entirely.
How AI Root Cause Analysis Reads a Stop the Way a Senior Technician Would
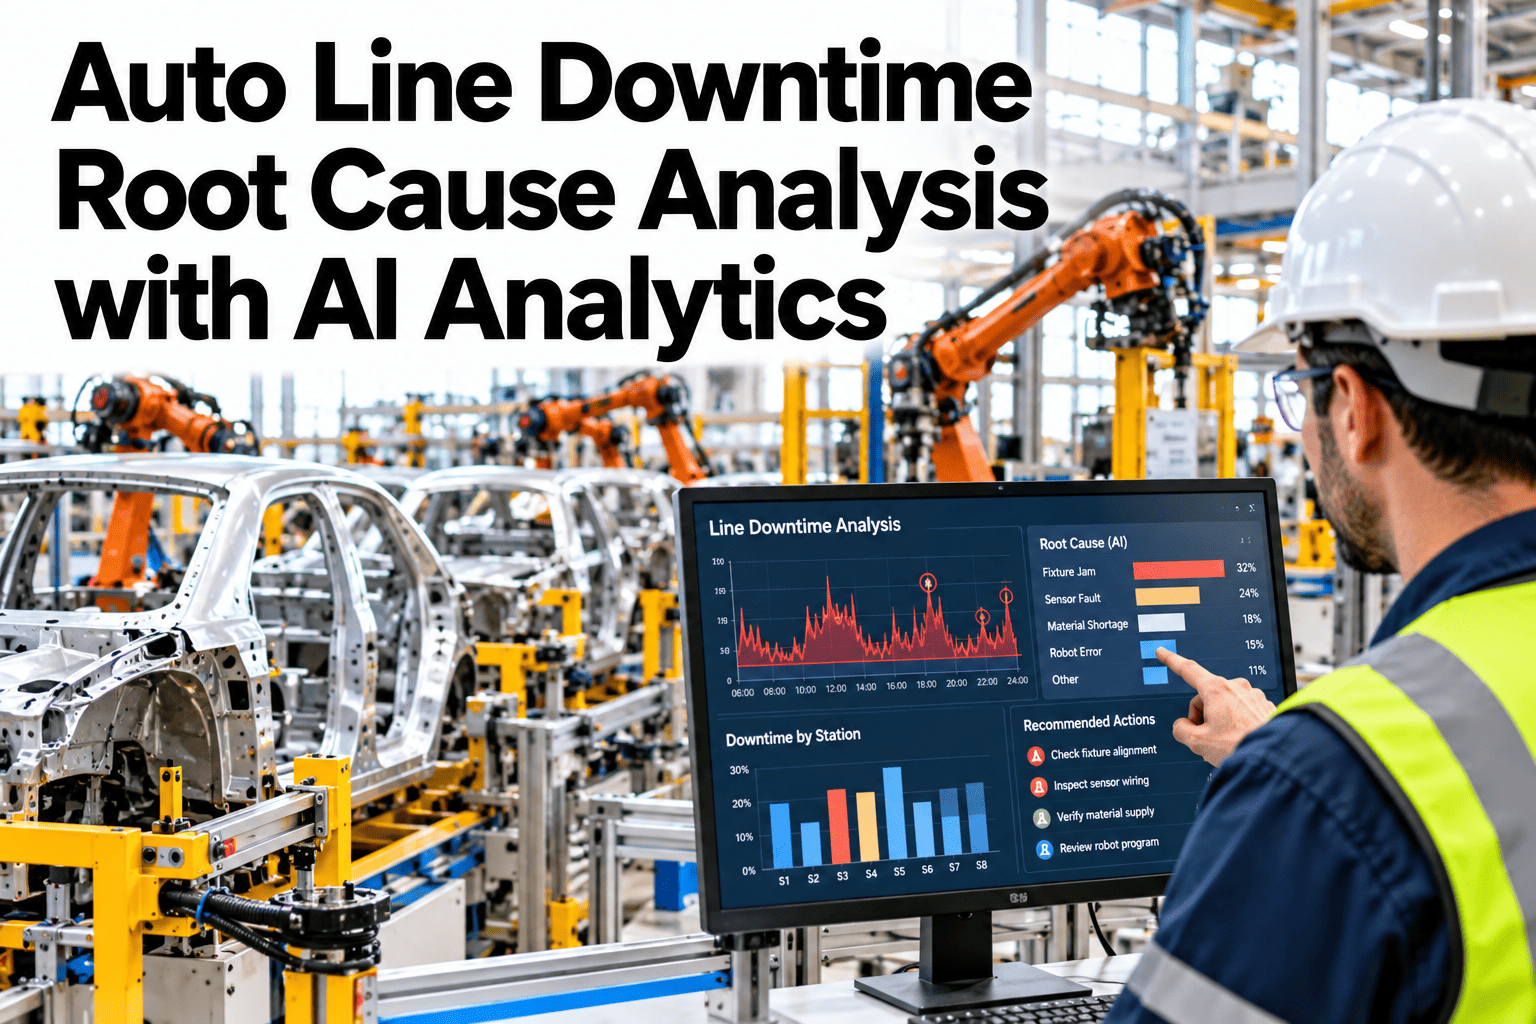
ifactoryApp does not wait for an end-of-shift review to determine what caused a stop. It correlates the signal patterns leading up to the stop, cross-references maintenance history for that asset, and checks whether the pattern matches known failure signatures from across your plant network, all within the same window the line is already down.
Sensor and PLC data from the seconds before a stop are compared against normal operating ranges to isolate which parameter actually deviated first.
The asset's maintenance and repair history is checked automatically for recurring patterns that a single technician reviewing one incident would not have visibility into.
The same failure signature is checked against identical equipment on other lines or plants, surfacing whether this is an isolated event or an emerging fleet-wide issue.
The most probable root cause and recommended corrective action are pushed directly to the responding technician's device, cutting diagnostic time before a wrench is even picked up.
Bring Us Your Worst Recurring Stop
ifactoryApp's team will walk through your last quarter of downtime data live and show what the actual root cause pattern looks like once signal, history, and cross-line data are analyzed together.
What Improves in Your OEE Availability Number
Availability is the OEE component most directly affected by how quickly and accurately your team identifies root cause. These are the changes plant managers typically report after moving to AI-assisted root cause analysis.
Mean time to identify root cause
Recurring stop frequency for repeat failure modes
OEE availability improvement, plant average
Overtime hours spent recovering lost shift volume
How This Changes the Numbers Reliability Teams Already Track
Mean time between failures and mean time to repair are the two numbers most maintenance organizations already report on monthly. AI-assisted root cause analysis moves both in the same direction: MTBF extends because true root causes get closed instead of masked, and MTTR shrinks because the diagnostic phase of every repair starts with a probable cause already identified rather than a blank troubleshooting sheet. Plants running this consistently across stamping, body shop, and final assembly report that the combined effect compounds over two to three quarters as the historical pattern library grows and cross-line matching becomes more precise with every new incident logged.
Downtime Root Cause Analysis — Common Questions
How fast does root cause analysis actually run after a stop occurs?
The signal correlation and history cross-reference steps run within the same minute the stop is detected, since the underlying sensor and maintenance data are already flowing into the system continuously. A probable root cause and recommended action are typically available to the responding technician before they physically reach the asset, which is the primary driver of the reduction in mean time to repair that plants report.
Do we need new sensors installed to get this working?
In most cases no. ifactoryApp reads from PLC, SCADA, and existing historian data that automotive plants already have in place across stamping, body shop, paint, and assembly. Where a specific asset lacks sufficient signal coverage, our support team will identify the gap during onboarding and recommend the minimum instrumentation needed.
Can this identify failure patterns across multiple plants, not just one line?
Yes, when your organization runs identical or similar equipment across multiple facilities, the system checks new failure signatures against the full network's history, which is often how an emerging issue on one press gets caught before it becomes a fleet-wide problem on sister equipment elsewhere.
How does this differ from the downtime tracking software we already use?
Most downtime tracking software logs duration and a manually selected cause category, which is exactly the data gap this addresses. ifactoryApp adds the analysis layer on top, correlating signal data and history automatically so the cause category is evidence-based rather than an operator's best guess under time pressure during a live stop.
What does a typical deployment timeline look like for one plant?
Most single-plant deployments reach initial root cause recommendations within three to four weeks of connecting to existing PLC and historian data, with the pattern library becoming meaningfully more precise over the following two quarters as more incidents are analyzed and technician feedback refines the model's confidence scoring.
Turn Your Downtime Log Into a Root Cause Engine
Talk to ifactoryApp about connecting your existing PLC and historian data to a system that tells your team what actually caused the stop, not just how long it lasted.