A paint shop can finish thousands of bodies a day, and one recurring defect can turn into hundreds of repair hours before anyone agrees on its cause. Traditional root cause analysis depends on a few experienced people, a pile of spreadsheets and several days of debate about which variable moved first. AI changes the order of work by clustering defects, tracing them upstream and showing cause and effect on a single screen. To see how this could work on your own paint line, book a paint quality walkthrough with the iFactory AI team.
Trace Every Paint Defect Back to the Process Step That Caused It
iFactory AI connects surface defect inspection with booth, oven and material data, so paint teams move from finding a defect to proving its cause in hours instead of days.
Why Paint Defects Are Among the Hardest Problems to Explain
A car body passes through pretreatment, electrocoat, sealer, primer, basecoat, clearcoat and several ovens before anyone judges the finish. Each stage has its own chemistry, temperature, humidity and airflow, so a defect seen at final inspection may have started in a step that finished hours earlier. The visible symptom and the real cause are separated by time, distance and many other variables. That gap is why paint shops so often fix the symptom, such as extra sanding or an adjusted spray, while the actual source keeps producing the same defect on the next shift.
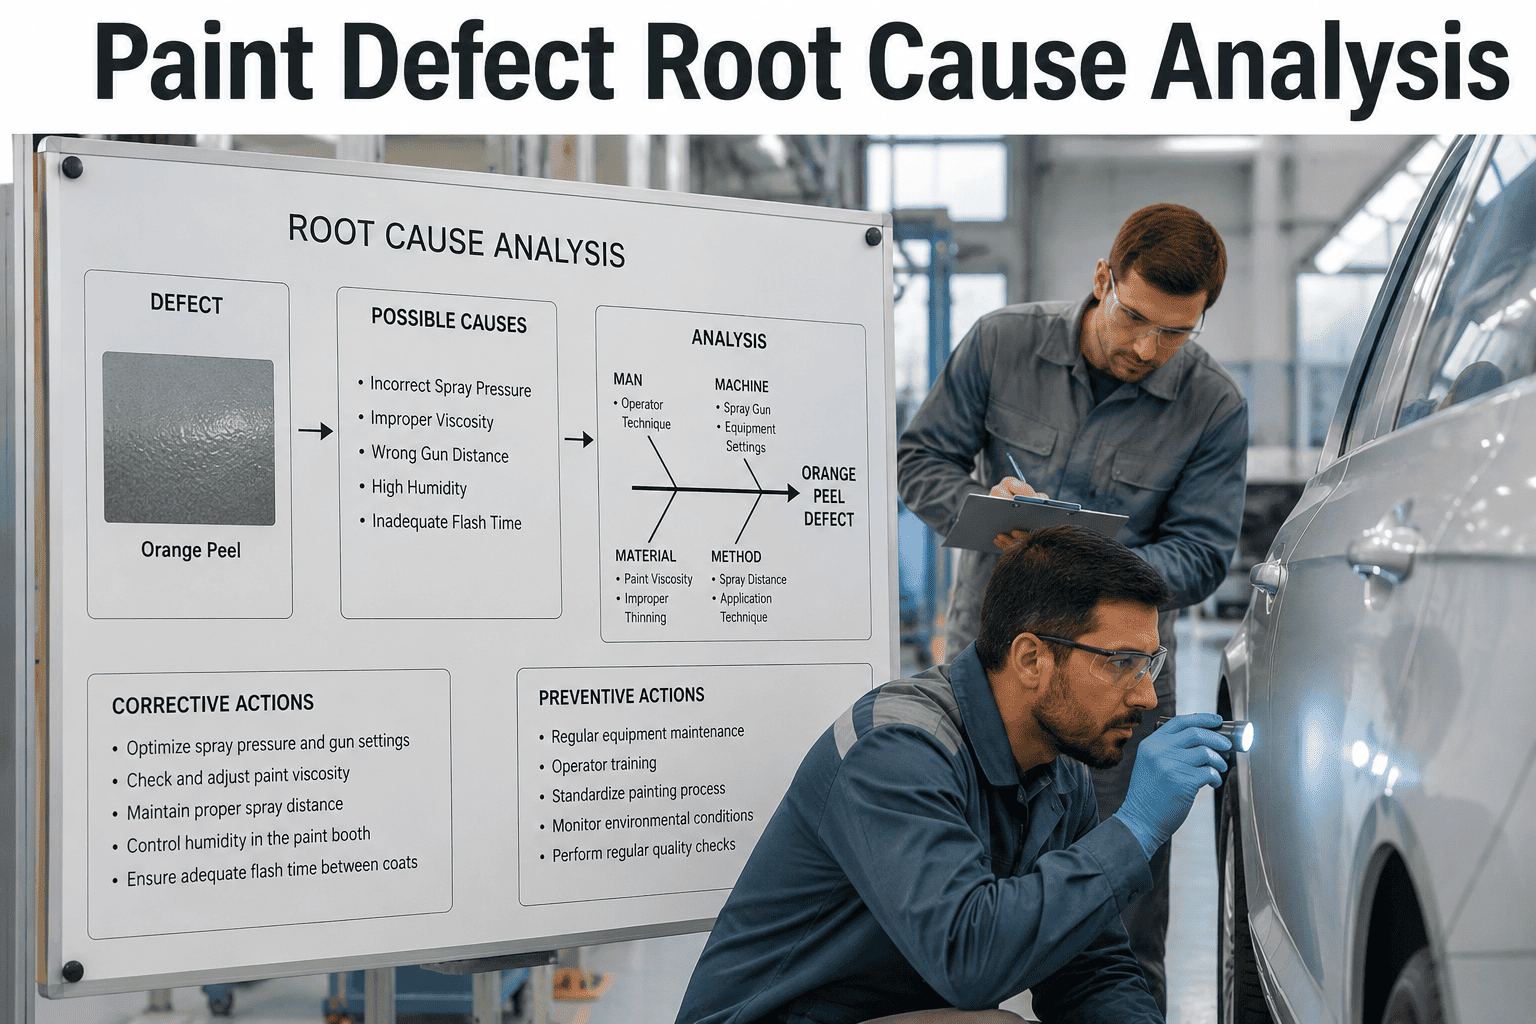
The diagram above is a simple cause-and-effect map, often called a fishbone. It is useful because it reminds the team that suspects live in six areas, but on paper it cannot tell you which area is guilty today. That is where measured data from the line has to take over from opinion.
Each Defect Type Points Toward a Different Family of Causes
Good analysis starts with correct classification, because a crater and a solvent pop can look similar to a tired eye while pointing to unrelated causes. AI inspection separates them by shape, size, depth and position, then attaches the class to every vehicle record.
| Defect | Visual signature | Common upstream suspects | Data worth linking |
|---|---|---|---|
| Crater or fisheye | Small round depression with a raised rim | Oil, silicone or incompatible cleaning residue | Colour change events, wipe and sealer batches |
| Dirt or nib | Raised speck trapped in the film | Booth air, filters, overspray, clothing fibres | Filter status, air balance, cleanroom logs |
| Run or sag | Downward drip or curtain on vertical areas | Excess film build, low temperature, slow flash-off | Film thickness, robot flow, booth temperature |
| Orange peel | Uneven texture instead of a smooth gloss | Viscosity, atomisation settings, booth conditions | Paint temperature, bell speed, humidity |
| Solvent pop | Tiny blisters or pinholes after baking | Heavy film, short flash-off, fast oven ramp | Film build, flash time, oven profile |
| Water spot | Ring or mark after drying | Rinse quality, drying delay, condensation | Rinse conductivity, dwell time, ambient dew point |
The last column matters most for analysis. A class alone only names the problem, while the linked data supplies the evidence needed to test each suspect, which is why inspection and process records must sit in one place.
Defect Pattern Clustering Shows Where the Problem Concentrates
Random defects look scattered, but systematic ones cluster. Clustering groups defects by position on the body, time of day, colour, booth, robot, shift and batch, then highlights the grouping that explains the most. A pattern that humans would take days to find appears as soon as enough vehicles are inspected.
In this example the hood carries far more defects than any other zone, and the right doors are mildly elevated. That uneven shape is a clue by itself, because a random contamination source would usually spread more evenly, while a robot path or a booth airflow pattern tends to favour specific panels.
Clustering also protects teams from chasing noise. Every plant has a normal background rate of defects, and a good system shows whether a bump in the numbers is genuine or simply within expected variation. Teams that learn the normal rate for each colour and panel can react to real changes within hours and ignore ordinary noise.
Time Patterns Often Reveal What Position Cannot
Many paint problems begin at a specific event, such as a filter swap, a colour change, a long stop or a shift handover. Plotting the defect rate against time makes those events visible and shows whether the defect appears suddenly or builds slowly.
A sudden jump that lines up with an event points to a cause tied to that event, while a slow climb points toward wear, buildup or drifting conditions. Because the timing differs, the follow-up checks differ too, and the data tells the team which set of checks to run first.
Either shape gives the team a head start, because it narrows hundreds of possible causes to a short and testable list.
Upstream Trace-Back Follows the Body Through the Whole Process
Once a cluster is clear, the next question is which process step touched the affected bodies and what condition they shared. Trace-back uses the vehicle identity to walk backwards through every station, so conditions at each step can be compared between good and defective bodies.
The comparison in step three is the heart of the method. A condition shared by every defective body means little if clean bodies shared it too, so only differences between the two groups count as evidence. This is also why keeping clean reference bodies in the data matters as much as collecting the defective ones.
See a Paint Defect Traced to Its Cause on Your Own Data
Share your most persistent paint defect and the data you already collect, and see how iFactory AI would cluster it, trace it upstream and rank the likely causes.
Cause-and-Effect Visualisation Turns Evidence Into a Story the Team Can Act On
Numbers alone rarely convince a busy shop floor. A visual chain from symptom to cause lets paint, maintenance and quality teams look at the same picture and agree on the next action. The case below is invented to show how the chain reads.
Each row in the chain is backed by data, so a sceptical engineer can click through and see the bodies, the timing and the comparison with clean vehicles. That transparency matters, because teams adopt a finding only when they can see why the system reached it.
An evidence meter keeps the discussion honest. It reminds everyone that a ranked suspect is a hypothesis to test on the line, and that a strong correlation still needs a physical confirmation before the process is changed permanently.
Where the Time Savings in Root Cause Analysis Really Come From
Most of the delay in a paint investigation is not the fix itself. It is the days spent gathering records, matching them to vehicles, building charts and arguing about which variable matters. Automating those steps compresses the whole investigation.
The bars are a directional comparison, not measured data. Real results depend on data quality and how quickly teams act, yet the structure of the saving is consistent: less time collecting, less time debating and more time confirming.
Every hour a systematic defect continues, the plant keeps producing repair work, so speed of diagnosis has a direct effect on throughput and on the first time quality rate.
Three Kinds of Data an Effective Paint Root Cause System Needs
Analysis can only be as good as the information behind it. Successful projects usually combine three layers, and gaps in any one layer limit how far the trace can go.
Inspection data tells you what happened, process data tells you under which conditions and context data tells you what else changed around the same time. Most plants already hold much of this information in separate systems, so the first task is joining it by vehicle identity rather than collecting something new.
What One Unresolved Defect Costs in Repair Hours
A paint defect that is not traced quickly keeps creating rework, and that rework consumes spot repair, polishing and sometimes a full repaint. The calculation below is an example, but it shows how quickly a modest defect rate becomes a large number of labour hours across a production day.
Fifty hours is more than a full working week for one person, and it ignores the knock-on effects of delayed vehicles, extra handling and the risk that repaired areas show differences in gloss. Every hour that the cause stays unknown adds to the total, which is why faster diagnosis has such a direct effect on cost and on delivery schedules.
Repair cost is also only the visible part. Teams that spend their days fixing defects have less time for prevention, so a plant stuck in repair mode tends to stay there until the causes are removed at the source.
A First-Hour Routine for the Paint Quality Lead
Tools help most when they fit an existing rhythm. This simple routine shows how a paint quality lead might use clustering and trace-back at the start of each shift without adding meetings or paperwork.
The last step is easy to skip and valuable to keep. Over months, logged results build a library of confirmed causes and fixes, so a repeat defect can be recognised in minutes because the team has already seen its signature before.
Four Traps That Lead Paint Teams to the Wrong Root Cause
Automation speeds up analysis, but it does not remove the need for judgement. These are the traps experienced teams watch for.
The common thread is discipline. The system finds patterns quickly, and people supply the physical understanding of paint chemistry and equipment that turns a pattern into a correct fix.
Five Levels on the Way to Faster Paint Root Cause Analysis
Few shops jump straight to full automation. Most move through levels, and knowing where you stand makes the next step clear.
Each level builds on the one before it, and each already delivers value on its own. A shop at level two gains consistent classification, while a shop at level four gains the faster investigations described earlier.
A Checklist Before Starting Paint Root Cause Analysis With AI
A short preparation list keeps a first project focused and makes the results easier to trust.
Missing items are normal at the start. Closing those gaps is part of the first project, and a good partner helps prioritise which ones matter most for the defect you want to solve first.
What Paint and Quality Teams Ask About AI Root Cause Analysis
Bring Faster Root Cause Analysis to Your Paint Shop
Book a session with iFactory AI to review your paint defects, process data and investigation routine, and see how clustering and trace-back can speed up quality decisions.