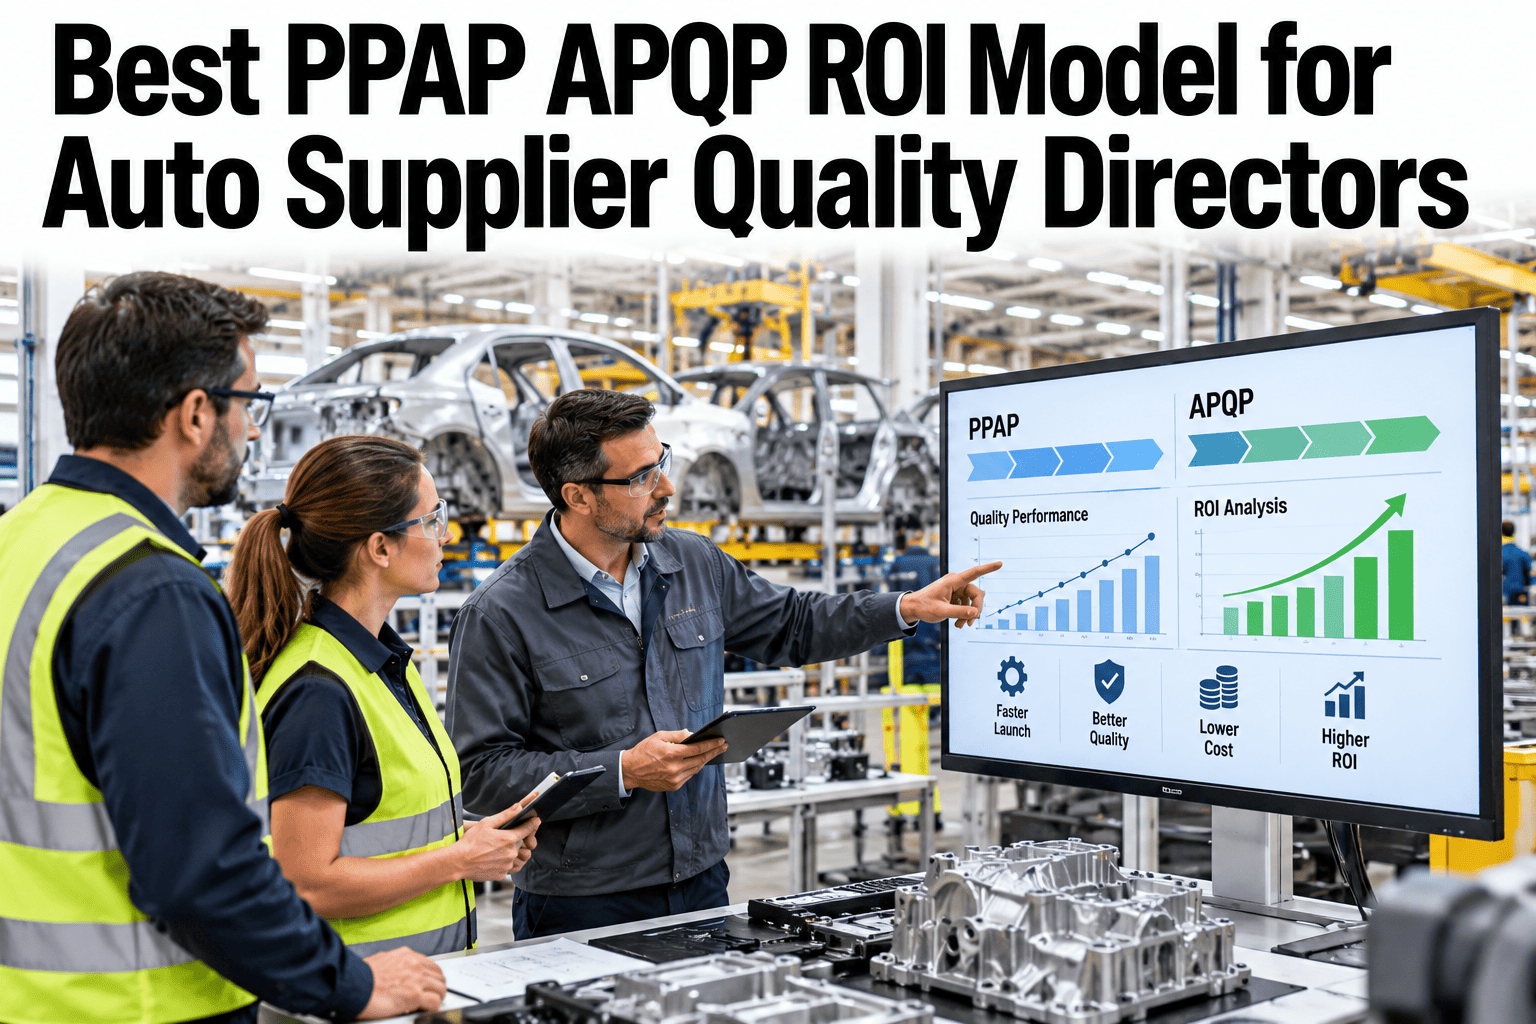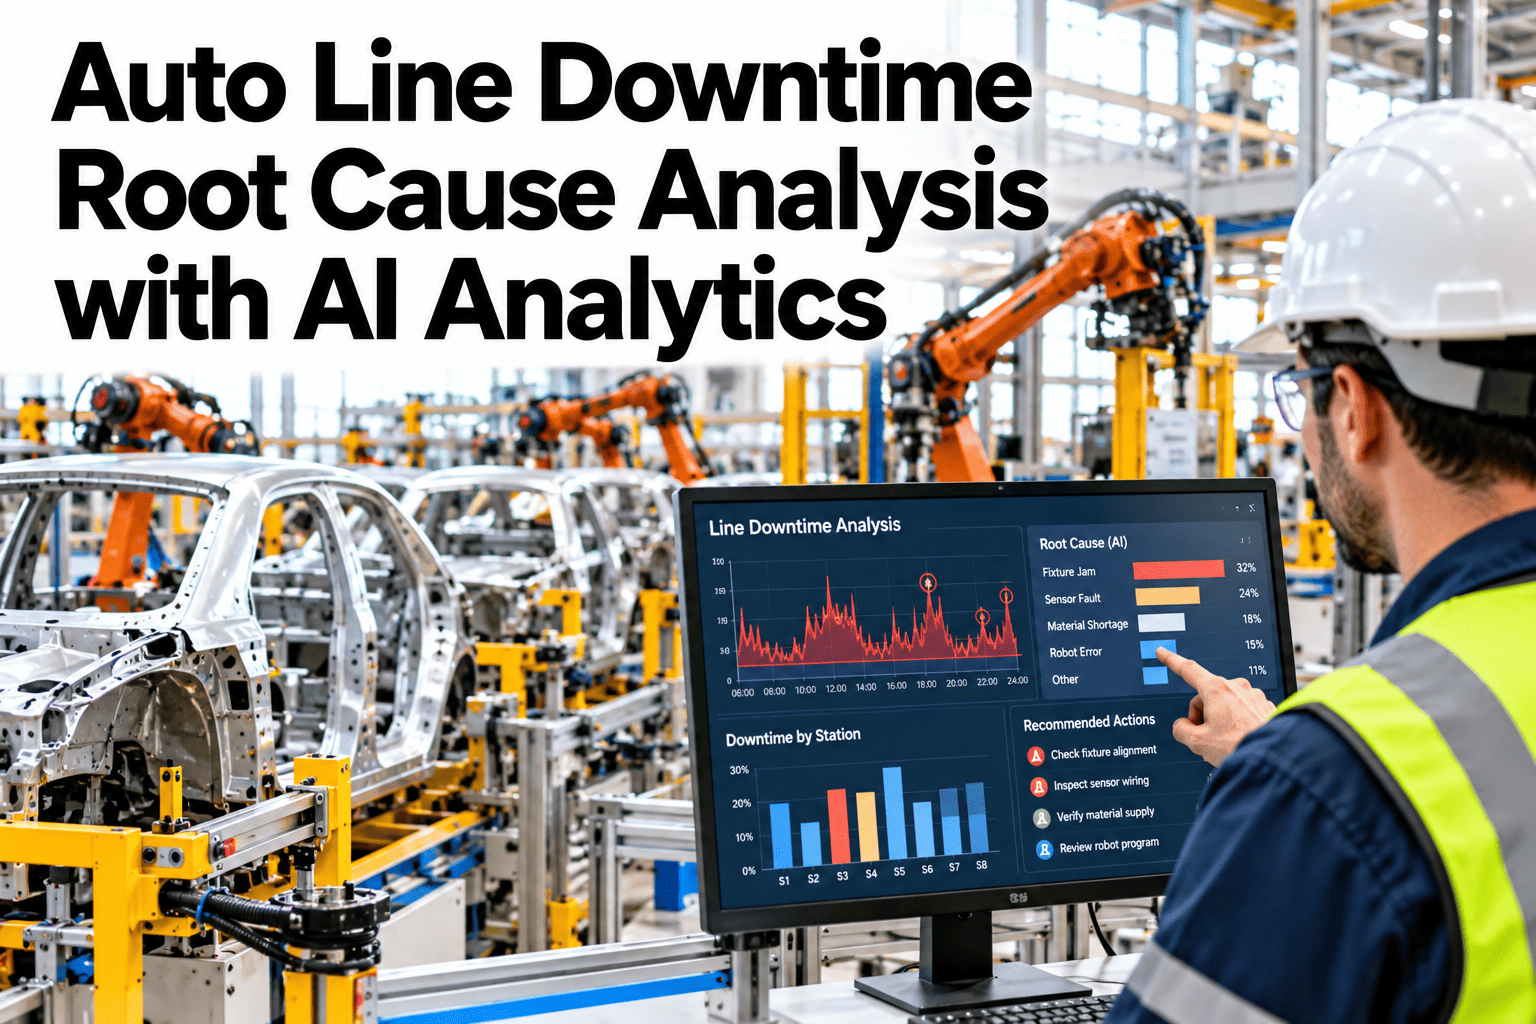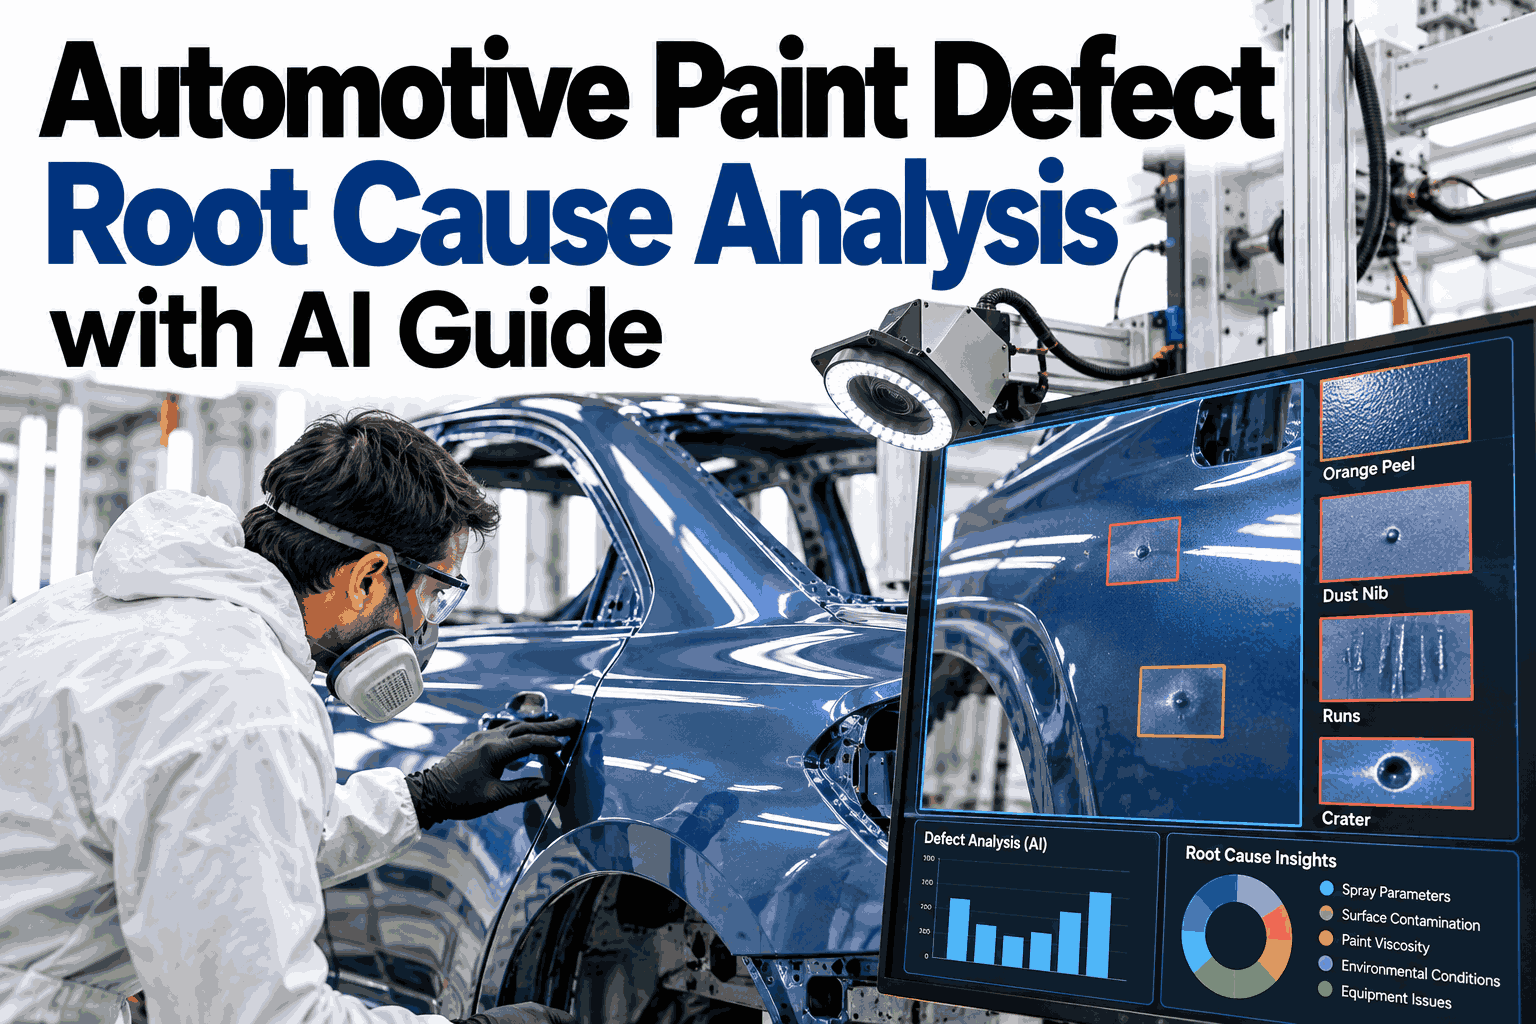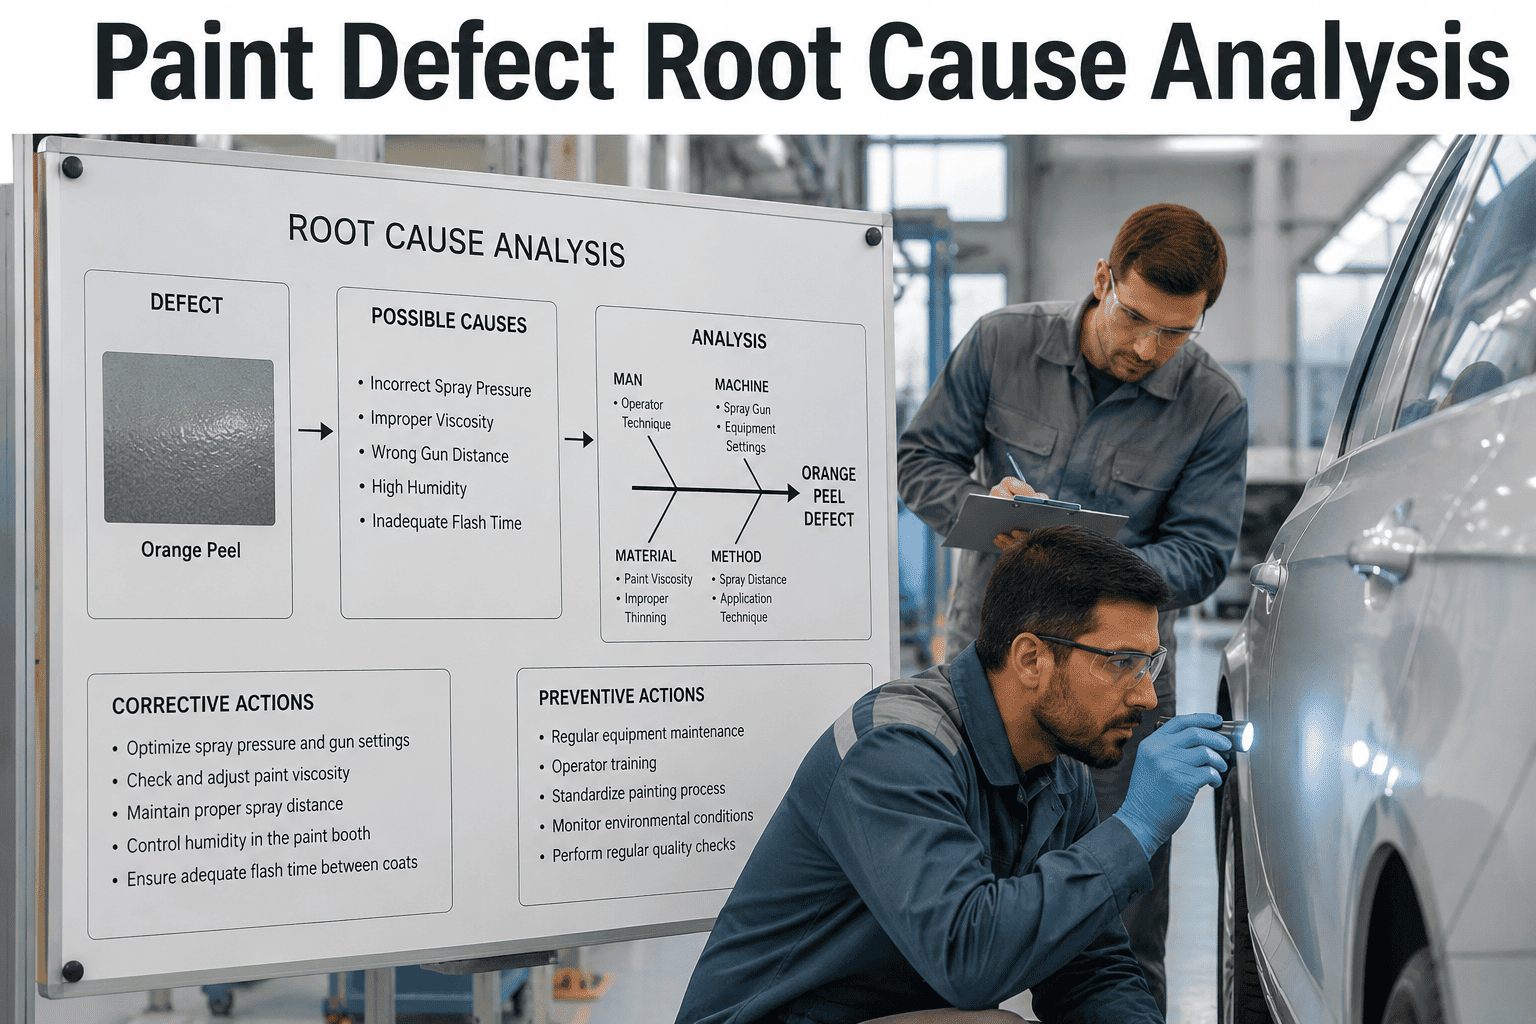
An investment case for root-cause analysis tooling built on "faster investigations" alone rarely survives a budget review, because faster is a process improvement, not a dollar figure a finance committee can weigh against the cost of the platform. A defensible ROI model stacks three distinct savings — RCA-cycle time reduction, containment cost avoided, and warranty cost avoided — into one figure measured against a documented baseline. iFactory AI's team can help build this ROI model against your own plant's RCA and warranty history before the next capital request.
"Faster RCA" Isn't a Number a Budget Review Can Weigh
Stacking RCA-cycle reduction, containment cost savings and warranty cost avoidance into one figure, measured against a documented baseline, is what turns a process improvement into an investment case.
Why a Single Metric Undersells the Investment Case
Root cause isolation on a machining cell defect using manual log review and operator interviews can take days, while automated correlation against process and image data typically closes the same investigation in minutes — but that speed figure alone doesn't translate into a dollar figure finance can compare against the cost of a platform. The real case stacks three distinct savings together, each measurable on its own against a documented pre-investment baseline.
Engineering hours saved per investigation, multiplied by investigation volume.
A narrower, faster-scoped containment costs less than a wide, slow one.
Catching a defect pattern early reduces the population of vehicles that reach the field.
Each component is measured against your own history, not an industry average.
Building Each Component of the Model
Each component needs its own baseline before the platform goes live. Our team can help document a defensible baseline for each component before scoping an ROI case.
Hours from defect detection to confirmed root cause, averaged across recent investigations.
Typical units contained per incident today, and the cost per unit contained.
Historical warranty spend tied to defect categories the platform targets.
The same three metrics, tracked post-implementation against the documented baseline.
A Sample ROI Stack
| Component | What Changed | Basis for the Saving |
|---|---|---|
| RCA-cycle reduction | Days to minutes per investigation | Engineering hours saved × investigation volume |
| Containment cost savings | Entire batch to a narrow, confirmed window | Units contained avoided × cost per unit |
| Warranty cost avoidance | Pattern caught before reaching more vehicles | Field population avoided × average claim cost |
Size This Model Against Your Own History
Share your recent RCA cycle times, containment scopes and warranty costs by defect type, and get a stacked ROI model built from your own numbers.
A Composite Scenario: The Case That Survived the Second Question
Picture an OEM quality director presenting an RCA platform business case built initially around cycle-time improvement alone, which drew an immediate follow-up question about what that time savings was actually worth.
Rebuilding the case with containment cost and warranty cost avoidance stacked alongside the cycle-time figure, each measured against a documented baseline from the plant's own history, gave finance a number they could evaluate against the platform's cost directly rather than a qualitative improvement story. The case was approved on the rebuilt version. The scenario illustrates the method; actual figures depend on each plant's own baseline.
Where iFactory AI Fits
iFactory AI's team helps document the pre-investment baseline for RCA cycle time, containment scope and warranty cost by defect type, then tracks the same three metrics post-implementation so the ROI case is built from measured results, not projected ones.
All three components measured before the platform goes live.
The same metrics measured after, not assumed from an industry figure.
One combined figure built from three defensible, separately-measured parts.
Frequently Asked Questions
As the elapsed time from when a defect is first detected to when the root cause is confirmed and a corrective action is identified, averaged across a representative sample of recent investigations rather than a single best or worst case. Review a baseline measurement approach for your investigations.
By documenting the typical scope and cost of past containment actions — units held, sorted or scrapped — against what a narrower, data-confirmed scope would have required for the same incidents. Ask how to reconstruct past containment costs.
The attribution works best when tied to specific defect categories the platform directly targets, comparing warranty claim rates for those categories before and after implementation rather than claiming credit for all warranty spend broadly. Discuss attribution methodology for your defect categories.
Plants investing in traceability and RCA tooling often see measurable results — fewer escape defects, faster investigations, reduced rework — within three to six months, with warranty cost avoidance typically taking longer to confirm given claim reporting lags. Set expectations for your reporting timeline.
A partial baseline is still useful — building the case around whichever components have reliable historical data, while noting the others as directional, is more credible than presenting a complete but weakly-sourced figure. Discuss building a case with partial data.
Build the RCA Investment Case Finance Can Actually Evaluate
iFactory AI helps stack RCA-cycle reduction, containment savings and warranty avoidance into one measured figure, built from your own baseline.